
Efficient and tunable multi-color and white light Ln-MOFs with high luminescence quantum yields†
Shuzhi Zouab,
Qipeng Li ab and
Shaowu Du*a
ab and
Shaowu Du*a
aState Key Laboratory of Structural Chemistry, Fujian Institute of Research on the Structure of Matter, Chinese Academy of Sciences, Fuzhou, Fujian 350002, P. R. China. E-mail: swdu@fjirsm.ac.cn; Fax: +86 591 83709470
bUniversity of Chinese Academy of Sciences, Beijing 100039, P. R. China
First published on 10th April 2015
Abstract
A series of isomorphic Ln-MOFs, formulated as [Ln2(m-BDC)3(Phen)2]·(DMF) (Ln = Eu 1, Gd 2, Tb 3, Ln = mixed-lanthanide 4–9, m-H2BDC = 1,3-benzenedicarboxylic acid, Phen = 1,10-phenanthroline) have been solvothermally synthesized. Single-crystal X-ray diffraction studies reveal that the isostructural compounds are constructed by two types of dinuclear SBUs, {Ln(COO)5(Phen)}2 and {Ln(COO)4(Phen)}2, which are six-connected by m-BDC2− ligands to generate a 3D pcu topological net. Precisely tuning the stoichiometry of the lanthanide ions in the frameworks leads to the synthesis of high-efficiency multi-color and white light luminescent materials. Moreover, the quantum yields of these materials range from 13 to 75% and the white-light emission quantum yield can reach up to 32%.
Introduction
Multi-color luminescent materials, in particular those with white-light emission, have received consideration attention recently due to their potential applications in many important devices such as low-cost back-lighting, liquid-crystal displays, and the next-generation lighting sources that are envisioned to replace the incandescent light bulb and fluorescent lamp.1 One common approach to realize multi-color and white-light emissions is to incorporate and control the intensity of three fundamental red, green and blue (RGB) light emitting components in the bulk materials.2 Apparently, metal–organic frameworks which are built from lanthanide ions (or clusters) as building blocks and organic ligands as linkers (Ln-MOFs) are excellent candidates for this purpose because the spatial regularity of the building blocks in the structure affords the possibility for incorporating different lanthanide ions into the same framework, enabling the precise control of the emission color output. Furthermore, the optical properties, including the photoluminescent efficiency of these materials can be improved by modifying the coordination environment of Ln3+ ions and the linking organic ligands.3 For example, it has been shown recently that the multi-color and white-light luminescence can be achieved by co-doping Eu3+, Tb3+ ions and a certain blue light emission source (usually organic ligands) as RGB light emitting components into the frameworks of isostructural Ln-MOFs.4 The luminescence of these mixed Ln-MOFs can be effectively tuned by varying the stoichiometric ratio of Ln3+ ions or the excitation wavelengths.5 Although some progress has been made in this field by doping multiple components of Ln3+ ions into the frameworks of Ln-MOFs, the photo-luminescent quantum yields of the resulting multi-color or white-light luminescent materials are usually low.In order to gain high luminescence, the ligands used in the construction of Ln-MOFs should be able to efficiently transfer the energy absorbed by chromophores to the lanthanide ions. In addition, to minimize the nonradiative deactivation by vibronic quenchers, the ligand should contain multiple binding sites to saturate the Ln3+ coordination sites. In our previously studies,3 we discovered that 1,3-benzenedicarboxylic acid (m-H2BDC), which is an easily available ligand wildly used in the industry, was able to act as antenna chromophore to efficiently absorb and transfer energy to the lanthanide ions, and at the same time as bridges to connect lanthanide ions into highly stable 3D frameworks. TD-DFT calculations indicated that the energy gap between the singlet and triplet states of m-H2BDC was within the limit of efficient energy transfer for ISC process (inter-system crossing). Meanwhile, 1,10-phenanthroline (Phen) is one of the excellent ligands in the construction of lanthanide complexes not only because it is a good antenna chromophore but also because its chelating ability can help to saturate the Ln3+ coordination sites. Therefore, by combined use of m-H2BDC and Phen, Ln-MOFs with highly efficient luminescent properties can be expected.6
Following the above-mentioned strategy, we successfully synthesized three isomorphic Ln-MOFs with mixed ligands under solvothermal condition, namely [Ln2(m-BDC)3(Phen)2]·(DMF) (Ln = Eu 1, Gd 2 and Tb 3). By means of co-doping different lanthanide ions into the frameworks of 1–3, a series of mixed Ln-MOFs were isolated which, including 1–3, displayed high-efficiency multi-color emissions of red, blue, green, orange, white, yellow-green, greenish yellow, yellowish and yellow. In addition, the quantum yields of these materials are ranged from 13 to 75% and the white-light emission quantum yield can reach up to 32%. Herein, their synthesis, structures and luminescent properties are reported.
Result and discussion
Synthesis and characterization
Solvo(hydro)thermal methods were employed in this work for the synthesis of compounds 1–9. Compared with the traditional synthetic methods, solvo(hydro)thermal reactions can minimize the problems associated with ligand solubility and enhance the reactivity of reactants in favour of efficient molecular building during the crystallization process. Reactions of m-H2BDC and Phen with Ln(NO3)3·6H2O in a mixed solvent of DMF and deionized water yielded isomorphic Ln-MOFs, formulated as [Ln2(m-BDC)3(Phen)2]·(DMF) (Ln = Eu 1, Gd 2 and Tb 3). The corresponding mixed-Ln MOF, 4–9 can be readily synthesized by using mixed lanthanide salts following the same procedure applied to 1–3. The molar ratio of the Ln3+ ions in 4–9 matches well with that of the starting materials, as further confirmed by the inductively coupled plasma spectroscopy (ICP) (Table 1).| Comp. | Molar ratio of lanthanide ions | ||
|---|---|---|---|
| Gd | Eu | Tb | |
| 1 | 0 | 1 | 0 |
| 2 | 1 | 0 | 0 |
| 3 | 0 | 0 | 1 |
| 4 | 0.9587 | 0.0100 | 0.0313 |
| 5 | 0.9977 | 0.0004 | 0.0019 |
| 6 | 0.9815 | 0.0036 | 0.0149 |
| 7 | 0.9933 | 0.0006 | 0.0061 |
| 8 | 0.9902 | 0.0061 | 0.0037 |
| 9 | 0.9954 | 0.0007 | 0.0040 |
The simulated and experimental powder XRD patterns of 1–9 obtained at room temperature are demonstrated in Fig. S1.† For each compound, the peak positions of the simulated and experimental patterns are in good agreement with each other, indicating the phase purity of the product. The difference in reflection intensities between the simulated and experimental patterns may be due to variation in the preferred orientation of the powder samples during collection of the experimental XRD data. The TGA curves of 1–3 are similar, all of which display a two-step weight loss (Fig. S2†). TGA of 1 is herein discussed. The TGA curve of 1 shows that it releases latticed DMF in the 160–350 °C region with the weight loss of 6.0% (calcd 5.94%). Then a stable plateau appears until 460 °C. This thermal stable temperature is very high, and surpasses most of the reported values for MOFs (below 450 °C). Stability is one of the primary concerns in development of new luminescent materials.7 Thus, the thermal stability of 1 is investigated by variable temperature XRD, which indicates that the sample is stable up to 450 °C (Fig. S3†). The IR spectra of samples 1–9 are shown in Fig. S4.† The positions of the absorption peaks are almost the same for these isostructural compounds. The characteristic νas(C–O) and νsym(C–O) absorption bands of the carboxylate groups are ranged from 1390–1650 cm−1. Characteristic C![[double bond, length as m-dash]](https://www.rsc.org/images/entities/char_e001.gif) O stretching peak appears at around 1680 cm−1 indicating the existence of DMF molecules.
O stretching peak appears at around 1680 cm−1 indicating the existence of DMF molecules.
Structure description
Because compounds 1–3 are isomorphic, only the structure of 1 is described here. X-ray single crystal structure analysis reveals that the asymmetry unit of 1 contains two crystallographically independent Eu3+ centres, three m-BDC2− anions, two Phen and a DMF molecule (Fig. 1a). The Eu1 centre is nine-coordinated by seven oxygen atoms from five m-BDC2− anions and two nitrogen atoms from a chelating Phen ligand. Two Eu1 centres are connected by two bidentate bridging and two tridentate chelating carboxylate groups to generate a dimeric unit (SBU1) (Fig. 1b), in which two EuO7N2 polyhedra share an O⋯O edge with each other. Each Eu2 centre is eight-coordinated by six carboxylate oxygen atoms and two Phen nitrogen atoms. Two such EuO6N2 polyhedra are linked by four bidentate bridging carboxylate groups to from another dinuclear unit (SBU2) (Fig. 1c). The coordination sphere of Eu1 and Eu2 is completed by the ligands and no solvent molecules are coordinated to them.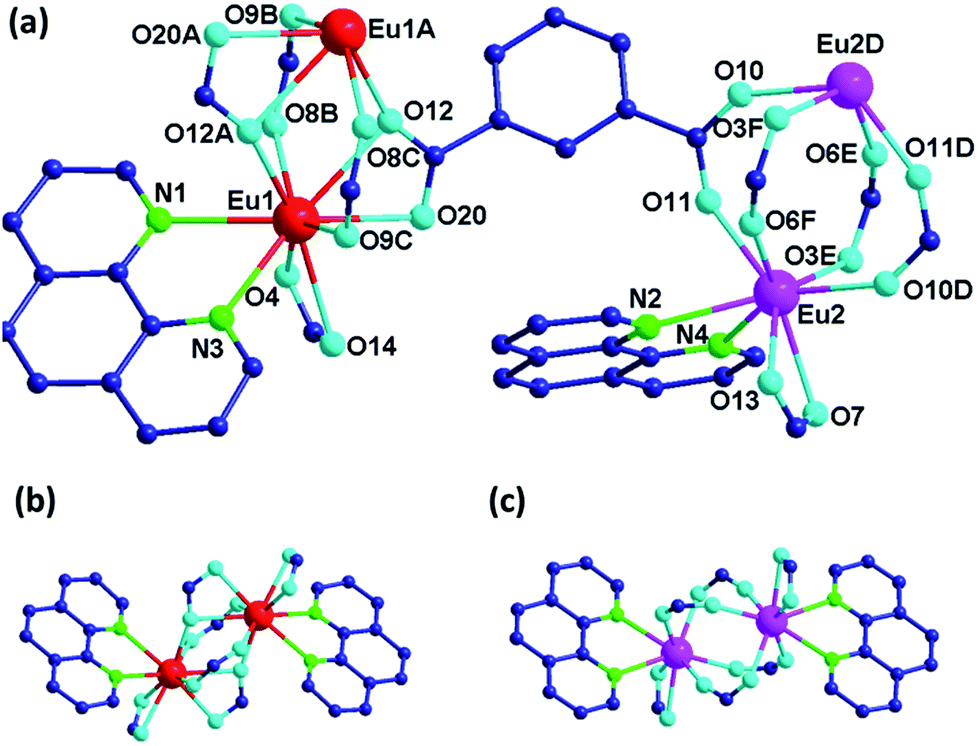 | ||
| Fig. 1 (a) Coordination environment of Eu3+ ions in 1. Symmetry codes for the atoms generated: A: 1 − x, 1 − y, 1 − z; B: −1 + x, y, 1 + z; C: 2 − x, 1 − y, −z; D: 2 − x, 2 − y, −z; E: 1 − x, 2 − y, −z; F: 1 + x, y, z. (b) View of SUB1 in 1. (c) View of SBU2 in 1. Hydrogen atoms and the labels of carbon atoms are omitted for clarity. | ||
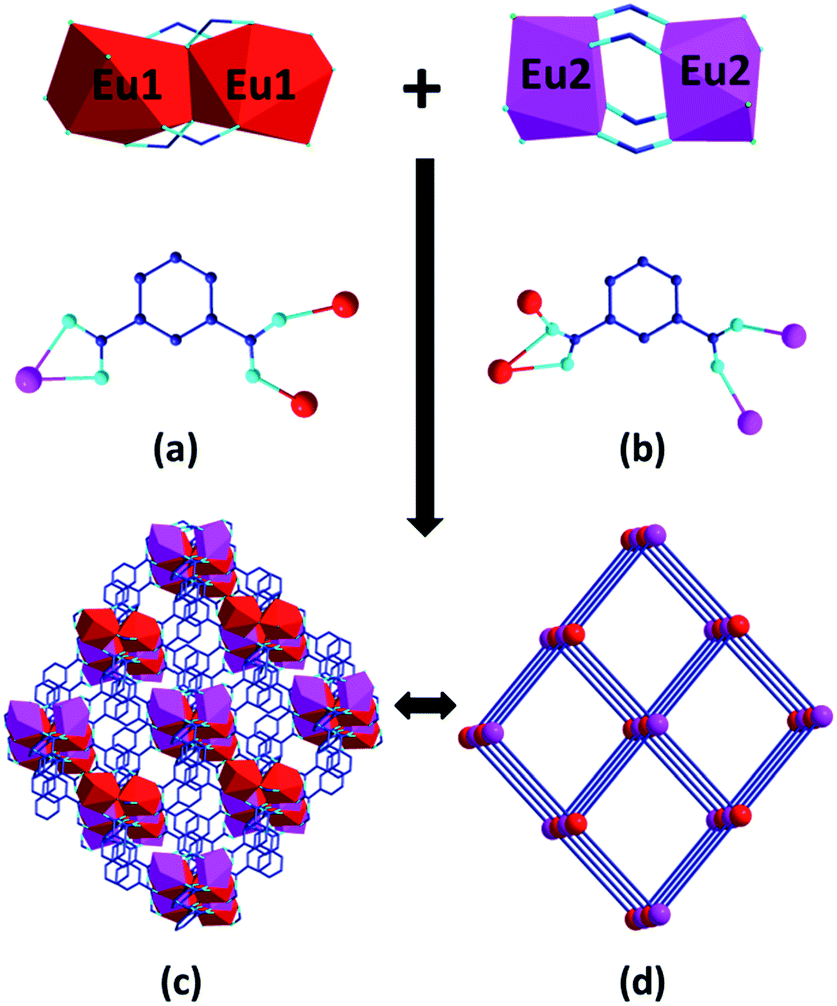
In 1, the m-BDC2− ligands adopt two coordination types, k2 − (k1 − k1) − μ3 and (k1 − k1) − (k2 − μ2) − μ4 to connect Eu3+ ions into a 3D framework (Fig. 2a and b).8 Both SBU1 and SBU2 are six-connected by the m-BDC2− ligands to form a distorted NaCl structure where the SBU1 and SBU2 are connected alternately just in the way of Na+ and Cl− do (Fig. 2c). Topological analysis indicates that 1 is a typical pcu topological net and exhibits a 3D binodal deviated sodium chloride framework (Fig. 2d).9 DMF molecules are inserted in the solvent-accessible pores which are estimated to be 16.5 Å,3 approximately 0.7% of the entire volume by PLATON program.10 As far as we know, in the few examples of Ln-MOFs constructed from m-H2BDC and Phen, none of them is built from two kinds of dinuclear SBUs in one single framework.11
 | ||
| Fig. 2 (a and b) The coordination modes of m-BDC2− ligands. (c) 3D framework of 1. (d) The pcu topological structure of 1. | ||
Photoluminescence properties
Excitation spectra of compounds 1–9 indicated that 350 nm UV is the optimum excitation wave length for these compounds (Fig. S5†). Photoluminescence spectra were thus investigated at room temperature and performed with a 350 nm UV excitation (Fig. 3). Compound 1 emits characteristic emissions of Eu3+ in the range of 570–720 nm, which are associated with the 4f → 4f transitions of the 5D0 excited state of Eu3+ to its low-lying 7FJ (J = 0, 1, 2, 3, and 4) levels, of which the 5D0 → 7F2 transition centred at 614 nm dominates the whole emission spectrum.12 The emission spectrum of 3 shows typical emission peaks at 489, 545, 585, 622, 648, 670 and 680 nm assigned to 5D4 → 7FJ (J = 6–0) transitions. The peak at 545 nm is due to the hypersensitive transition 5D4 → 7F5 of Tb3+ ions and has the maximum intensity and hence showing green luminescence.13 For 2, since the lowest excited states of the Gd3+ 6P7/2 is too high to accept energy from the ligands, its characteristic 4f → 4f transition at 311 nm is not visible. As a result, the emission spectrum of 2 shows a broad blue emission band centred at 450 nm which can be attributed to the emissions of the ligands. Compounds 4–9 accommodating multiple luminescent dopants display overlaid emission patterns of Tb3+, Eu3+ and ligands (Fig. 3). When the molar ratio of Tb3+/Eu3+/Gd3+ changes gradually, compounds 4–9 emit various colors including orange, white, yellow-green, greenish yellow, yellowish and yellow, as illustrated in CIE (Commission International de L'Eclairage) chromaticity diagram (Fig. 4). Their CIE color coordinates and quantum yields are listed in Table 2. Since white emission should ideally be composed of three RGB primary colors and cover the whole visible range from 400 to 700 nm, we have successfully realized the white-light emission by precise control of Tb3+/Eu3+/Gd3+ proportion at 0.9977/0.0004/0.0019. The CIE chromaticity coordinates of 5 are (0.33, 0.34), which is very close to that for pure white light (0.33, 0.33) according to the 1931 CIE coordinate diagram.14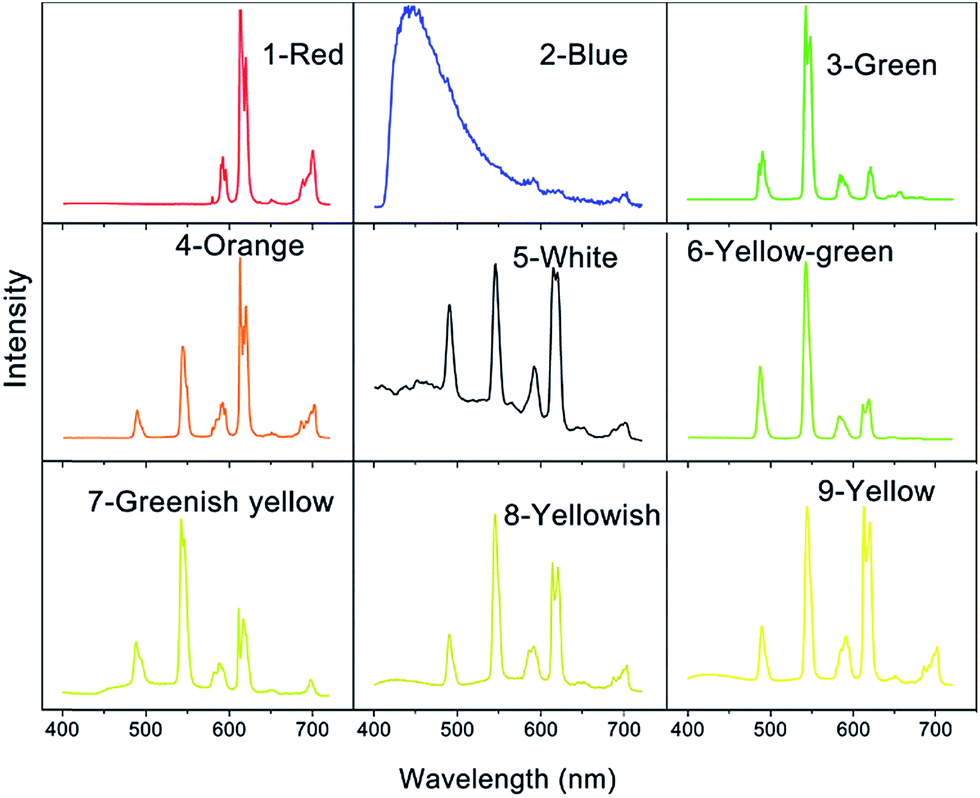 | ||
| Fig. 3 Solid-state emission spectra of 1–9 at room temperature with excitation at 350 nm. | ||
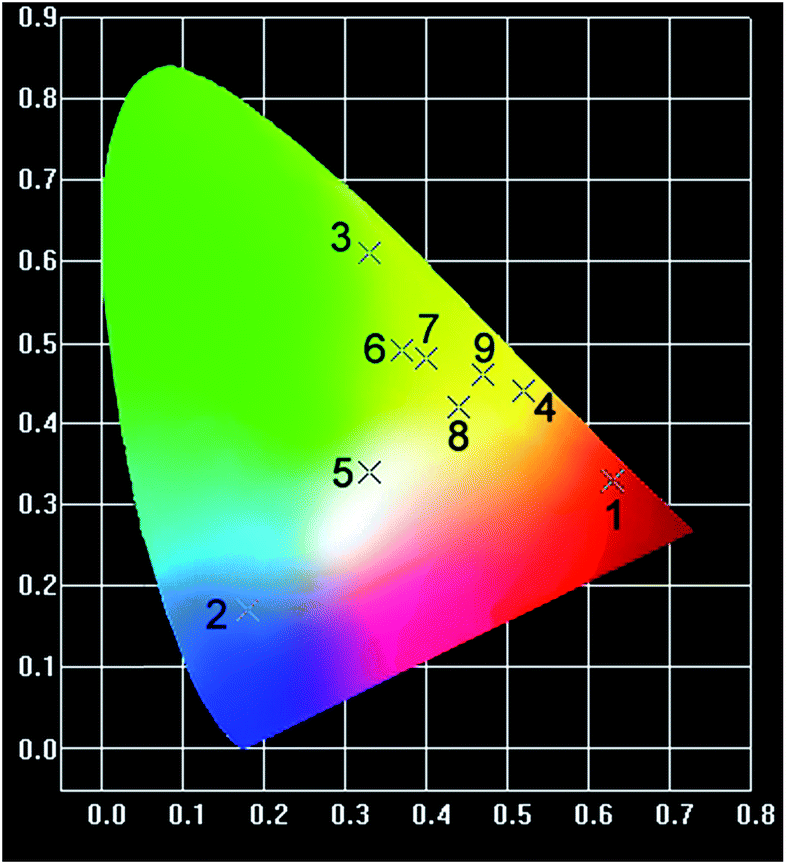 | ||
| Fig. 4 CIE chromaticity diagram showing location of the multi-color luminescence for 1–9. | ||
| Comp. | CIE (x,y) | Quantum yield (%) | Color |
|---|---|---|---|
| 1 | (0.63,0.33) | 75 | Red |
| 2 | (0.18,0.17) | 13 | Blue |
| 3 | (0.33,0.61) | 78 | Green |
| 4 | (0.52,0.44) | 65 | Orange |
| 5 | (0.33,0.34) | 32 | White |
| 6 | (0.37,0.49) | 52 | Yellow-green |
| 7 | (0.40,0.48) | 37 | Greenish-yellow |
| 8 | (0.44,0.42) | 43 | Yellowish |
| 9 | (0.47,0.46) | 41 | Yellow |
The photoluminescence quantum yield (Φ), which is a principal characteristic of luminescent materials, can quantify the efficiency of the energy transfer. The obtained quantum yields of 1–9 range from 13 to 78% and are listed in Table 2. Compound 3 exhibits the highest quantum yield with a value of 78%, which is followed by 1 (75%). The quantum efficiency of the green, red and yellow phosphors in this work is comparable to those of commercial green (e.g. LaPO4:Ce,Tb: 90%) red (e.g. Y2O3:Eu, 84%) and yellow (e.g. YAG:Ce, 45%) phosphors. This result may benefit from a good match of the diverse energy levels between the ligand and the lanthanide ions and the avoidance of the quenching effects of the solvent molecules. Overall, the quantum yields of this series of compounds are much higher than those reported previously for multi-color lanthanide multi-doped phosphors with matrixes of silicate thin film (4.3–35%) and zeolite powders (0.7–28%).15 To date, only a few examples of MOFs can achieve white-light emission, but normally at low quantum yield (below 20%).16 The quantum yield of 5 is 32%, which, is the highest value recorded for white-light emitting metal–organic frameworks.
Experimental section
Materials and instruments
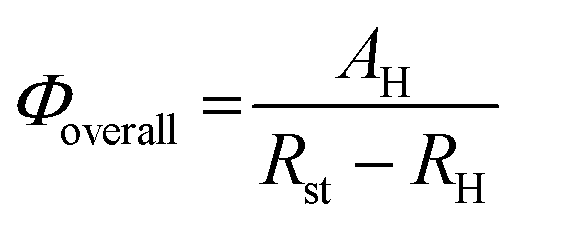
All the chemicals were purchased commercially and used as received. Thermogravimetric experiments were performed using TGA/NETZSCH STA449C instrument heated from 30–1200 °C (heating rate of 10 °C per min, nitrogen stream). The powder X-ray diffraction (XRD) patterns were recorded on crushed single crystals in the 2θ range of 5–50° using Cu-Kα radiation on a MiniFlex II X-Ray Diffractometer. IR spectra using the KBr pellet technique were recorded on a VERTEX70 spectrophotometer. Elemental analyses were measured with an Elemental Vairo Micro Analyzer. Inductively coupled plasma spectroscopy (ICP) was performed on an Ultima 2 spectrometer. Fluorescence spectra for the solid samples were performed on an Edinburgh Analytical instrument FLS920. Quantitative data were measured in the solid state at 298 ± 2 K with excitation and emission slit widths of 2/1.3 nm, and the emission was monitored from 400 to 720 nm. The overall luminescent quantum yields of the solid-state samples were determined by an absolute method using an integrating sphere (150 mm diameter, BaSO4 coating) on Edinburgh Instrument FLS920 and acquired by the following formula:where AH is the area under emission spectrum of the sample and Rst and RH are diffuse reflectance of the reflecting standard and the sample, respectively. The concrete operation for the solid-state quantum yield determination was based on a previously reported technique.17 Reported overall luminescent quantum yields were averages of at least three independent determinations. The estimated errors for quantum yields are within 5%.
Synthesis of [Ln2(m-BDC)3(Phen)2]·(DMF) (Ln = Eu 1; Gd 2; Tb 3)
Compounds 1–3 were synthesized in a similar procedure. A mixture containing Ln(NO3)3·6H2O (0.30 mmol), m-H2BDC (0.6 mmol) and 1,10-phenanthroline (0.45 mmol) was placed in a 23 ml Teflon-lined stainless steel reactor with 8 ml of mixed-solvent of DMF (N,N′-dimethylformamide) and water (v/v = 1![[thin space (1/6-em)]](https://www.rsc.org/images/entities/char_2009.gif) :1). The mixture was heated to 135 °C in 4 h and kept to this temperature for three days. The reaction system was cooled slowly to room temperature during another two days. Colorless block crystals of 1–3 were collected and washed thoroughly with methanol, and dried in air at room temperature.
:1). The mixture was heated to 135 °C in 4 h and kept to this temperature for three days. The reaction system was cooled slowly to room temperature during another two days. Colorless block crystals of 1–3 were collected and washed thoroughly with methanol, and dried in air at room temperature.
Synthesis of mixed lanthanide compounds 4–9
The same procedure as described for the synthesis of 1–3 was used for the synthesis of EuxTbyGd1−x−y by using mixtures of Eu(NO3)3·6H2O, Tb(NO3)3·6H2O and Gd(NO3)3·6H2O with various stoichiometries as metal sources. Since compounds 4–9 are isostructural to 1, they have similar results of elemental and IR analysis as well as identical X-ray powder pattern. Only the result of 5 was given here for clarity.Crystal structure determination
Single-crystal X-ray diffraction data were collected on a Rigaku diffractometer with a Saturn 724 CCD area detector (Mo Kα; λ = 0.71073 Å) at room temperature. Empirical absorption corrections were applied to the data using the Crystal Clear program.18 The structures were solved by the direct method and refined by the full-matrix least-squares on F2 using the SHELXTL-97 program.19 Metal atoms in each compound were located from the E-maps and other non-hydrogen atoms were located in successive difference Fourier syntheses. All non-hydrogen atoms were refined anisotropically. Hydrogen atoms were positioned geometrically. ESI.†Conclusions
In summary, we have synthesized a series of isostructural Ln-MOFs by combined use of m-H2BDC as a good chromophore and 1,10-phenanthroline as a chelating ligand. The structure of these compounds features a 3D pcu framework built upon two kinds of dinuclear SBUs which has not been observed for Ln-carboxylate MOFs. Moreover, we have demonstrated that the mixed Ln-MOFs in this series can be successfully used for efficient tuning of the emission color over the whole visible range by controlling the stoichiometric ratios of the Ln3+ ions in the isostructural frameworks. Significantly, the quantum yields of these materials are ranged from 13 to 75% and the white-light emission quantum yield can reach up to 32%.Acknowledgements
This work was supported by the National Basic Research Program of China (973 Program, 2012CB821702), the National Natural Science Foundation of China (21233009 and 21173221) and the State Key Laboratory of Structural Chemistry, Fujian Institute of Research on the Structure of Matter, Chinese Academy of Sciences.Notes and references
- (a) L. Kreno, K. Leong, O. Farha, M. Allendorf, R. Duyne and J. Hupp, Chem. Rev., 2012, 112, 1105 CrossRef CAS PubMed; (b) Y. C. Zhu, L. Zhou, H. Y. Li, Q. L. Xu, M. Y. Teng, Y. X. Zheng, J. L. Zou, H. J. Zhang and X. Z. You, Adv. Mater., 2011, 23, 4041 CrossRef CAS PubMed; (c) Y. Liu, M. Pan, Q. Yang, L. Fu, K. Li, S. Wei and C. Su, Chem. Mater., 2012, 24, 1954 CrossRef CAS.
- (a) H. A. Höppe, Angew. Chem., Int. Ed., 2009, 48, 3572 CrossRef PubMed; (b) H. Guo, Y. Zhu, S. Qiu, J. A. Lercher and H. Zhang, Adv. Mater., 2010, 22, 4190 CrossRef CAS PubMed; (c) N. Guo, H. You, Y. Song, M. Yang, K. Liu, Y. Zheng, Y. Huang and H. Zhang, J. Mater. Chem., 2010, 20, 9061 RSC; (d) P. Falcaro and S. Furukawa, Angew. Chem., Int. Ed., 2012, 51, 8431 CrossRef CAS PubMed.
- (a) H. Zhang, L. Zhou, J. Wei, Z. Li, P. Lin and S. Du, J. Mater. Chem., 2012, 22, 21210 RSC; (b) N. Wartenberg, O. Raccurt, E. B. Lami, D. Imbert and M. Mazzanti, Chem.–Eur. J., 2013, 19, 3477 CrossRef CAS PubMed; (c) B. Wang, Z. Zang, H. Wang, W. Dou, X. Tang, W. Liu, Y. Shao, J. Ma, Y. Li and J. Zhou, Angew. Chem., Int. Ed., 2013, 52, 3756 CrossRef CAS PubMed; (d) L. K. Truman, S. Comby and T. Gunnlaugsson, Angew. Chem., Int. Ed., 2012, 51, 9624 CrossRef CAS PubMed.
- (a) H. Zhang, X. Shan, L. Zhou, P. Lin, R. Li, E. Ma, X. Guo and S. Du, J. Mater. Chem. C, 2013, 1, 888 RSC; (b) A. R. Ramya, S. Varughese and M. L. P. Reddy, Dalton Trans., 2014, 43, 10940 RSC; (c) Y. Cui, H. Xu, Y. Yue, Z. Guo, J. Yu, Z. Chen, J. Gao, Y. Yang, G. Qian and B. Chen, J. Am. Chem. Soc., 2012, 134, 3979 CrossRef CAS PubMed; (d) S. Dang, J.-H. Zhang and Z.-M. Sun, J. Mater. Chem., 2012, 22, 8868 RSC; (e) P. R. Matthes, C. J. Höller, M. Mai, J. Heck, S. J. Sedlmaier, S. Schmiechen, C. Feldmann, W. Schnick and K. Müller-Buschbaum, J. Mater. Chem., 2012, 22, 10179 RSC.
- (a) H. Zhang, X. Shan, Z. Ma, L. Zhou, M. Zhang, P. Lin, S. Hu, E. Ma, R. Li and S. Du, J. Mater. Chem. C, 2014, 2, 1367 RSC; (b) F. Zhang, P. Yan, H. Li, X. Zou, G. Hou and G. Li, Dalton Trans., 2014, 43, 12574 RSC.
- H. B. Zhang, Y. Peng, X. C. Shan, C. B. Tian, P. Lin and S. W. Du, Inorg. Chem. Commun., 2011, 14, 1165 CrossRef CAS PubMed.
- (a) J. Song, Z. Luo, D. K. Britt, H. Furukawa, O. M. Yaghi, K. I. Hardcastle and C. L. Hill, J. Am. Chem. Soc., 2011, 133, 16839 CrossRef CAS PubMed; (b) F. Song, Y. Ding, B. Ma, C. Wang, Q. Wang, X. Du, S. Fu and J. Song, Energy Environ. Sci., 2013, 6, 1170 RSC.
- R. Hoffmann, M. M. L. Chen and D. L. Thorn, Inorg. Chem., 1977, 16, 503 CrossRef CAS.
- V. A. Myagchenkov and S. Y. Frenkel, Usp. Khim., 1978, 47, 1261 CAS.
- A. L. Spek, PLATON-97, University of Utrecht, Utrecht, The Netherlands, 1997 Search PubMed.
- (a) Y. Wan, L. Zhang, L. Jin, S. Gao and S. Lu, Inorg. Chem., 2003, 42, 4985 CrossRef CAS PubMed; (b) Y. Wan, L. Zhang and L. Jin, J. Mol. Struct., 2003, 658, 253 CrossRef CAS; (c) L. Zhang, Y. Wan and L. Jin, Polyhedron, 2003, 22, 981 CrossRef CAS.
- O. L. Malta, M. A. C. dosSantos, L. C. Thompson and N. K. Ito, J. Lumin., 1996, 69, 77 CrossRef CAS.
- Z. L. Huang, V. B. Cajipe, B. Lerolland, P. Colombet, W. J. Schipper and G. Blasse, Eur. J. Solid State Inorg. Chem., 1992, 29, 1133 CAS.
- L. I. Braddock, T. J. Podlas and N. Marec, Microchem. J., 1967, 12, 55 CrossRef CAS.
- (a) Y. Wada, M. Sato and Y. Tsukahara, Angew. Chem., Int. Ed., 2006, 45, 1925 CrossRef CAS PubMed; (b) D. Zhao, S. Seo and B. Bae, Adv. Mater., 2007, 19, 3473 CrossRef CAS PubMed.
- (a) M. Wang, G. Guo, W. Chen, G. Xu, W. Zhou, K. Wu and J. Huang, Angew. Chem., Int. Ed., 2007, 46, 3909 CrossRef CAS PubMed; (b) M. Wang, S. Guo, Y. Li, L. Cai, J. Zou, G. Xu, W. Zhou, F. Zheng and G. Guo, J. Am. Chem. Soc., 2009, 131, 13572 CrossRef CAS PubMed; (c) D. F. Sava, L. E. S. Rohwer, M. A. Rodriguez and T. M. Nenoff, J. Am. Chem. Soc., 2012, 134, 3983 CrossRef CAS PubMed; (d) J. He, M. Zeller, A. D. Hunter and Z. Xu, J. Am. Chem. Soc., 2012, 134, 1553 CrossRef CAS PubMed; (e) Y. Huang, Y. Lai and S. Wang, Chem.–Eur. J., 2012, 18, 8614 CrossRef CAS PubMed; (f) S. Li, X. Zheng, D. Yuan, A. Ablet and L. Jin, Inorg. Chem., 2012, 51, 1201 CrossRef CAS PubMed; (g) K. Liu, H. You, Y. Zheng, G. Jia, Y. Huang, M. Yang, Y. Song, L. Zhang and H. Zhang, Cryst. Growth Des., 2010, 10, 16 CrossRef CAS; (h) X. Rao, Q. Huang, X. Yang, Y. Cui, Y. Yang, C. Wu, B. Chen and G. Qian, J. Mater. Chem., 2012, 22, 3210 RSC.
- (a) Q. Zhu, C. Shen, C. Tan, T. Sheng, S. Hu and X. Wu, Chem. Commun., 2012, 48, 531 RSC; (b) J. C. Mello, H. F. Wittmann and R. H. Friend, Adv. Mater., 1997, 9, 230 CrossRef PubMed.
- CrystalClear, Version 1.36, Molecular Structure Corp and Rigaku Corp., The Woodlands, TX, and Tokyo, Japan, 2000 Search PubMed.
- G. M. Sheldrick, SHELXS 97, Program for Crystal Structure Solution, University of Göttingen, Göttingen, Germany, 1997 Search PubMed.
Footnote |
| † Electronic supplementary information (ESI) available: The table of crystallographic data, XRD patterns, TGA curves and IR spectra for the compounds. CCDC 1033136, 1046744 and 1046758. For ESI and crystallographic data in CIF or other electronic format see DOI: 10.1039/c5ra03710g |
| This journal is © The Royal Society of Chemistry 2015 |