Cytotoxicity, genotoxicity and alteration of cellular antioxidant enzymes in silver nanoparticles exposed CHO cells

Kumud Kant Awasthi*a, Anjali Awasthia, Rajbala Vermaa, Narender Kumarb, Partha Royb, Kamlendra Awasthic and P. J. John*a
aCenter for Advanced Studies, Department of Zoology, University of Rajasthan, Jaipur 302004, India. E-mail: kkantawasthi@gmail.com; placheriljohn@yahoo.com
bDepartment of Biotechnology, Indian Institute of Technology Roorkee, Roorkee 247667, India
cDepartment of Physics, Malaviya National Institute of Technology, Jaipur 302017, India

Received 8th December 2014 , Accepted 7th April 2015

First published on 8th April 2015


Abstract

The broad applications of silver nanoparticles (Ag NPs) increase human exposure and thus the potential risk associated with their toxicity; therefore, the toxicity of Ag NPs, synthesized by a chemical route was studied using Chinese Hamster Ovary (CHO) cells. A UV-vis absorption maximum at 406 nm confirmed the formation of silver nanoparticles. The average diameter of the silver nanoparticles having spherical shape was found to be about 10.0 ± 1.0 nm by transmission electron microscopy (TEM). For toxicity evaluation, cellular morphology, mitochondrial function (MTT assay), mitochondrial membrane potential, anti-oxidant enzyme assay and comet assay were assessed in CHO cells exposed to various dose concentrations of 25, 50 and 100 μg ml−1 as well as in control cells. Ag NPs caused decreased mitochondrial membrane potential and comparable CAT, SOD, GPx, GST, GR activities as well as total Glutathione level. Comet tail length, tail moment and percent DNA in tail were also found to be increased in a dose dependent manner. In summary, the results suggest that Ag NPs of smaller size at low concentration (25 μg ml−1) cause cytotoxicity by oxidative stress induced apoptosis and damage to DNA and other cellular components.
Introduction

Nanoparticles have unique electronic, optical, mechanical, chemical and biological properties which ensure their wide application.1 Among nanoparticles, silver nanoparticles (Ag NPs) are the most commonly used nanomaterials both in fundamental medical sciences and clinical study.2 Silver has been used for decades owing to its health benefits as an antimicrobial and antifungal substance.3 A long before the emergence of antibiotics, silver was believed to have beneficial healing and anti-disease properties.4 Ag NPs are frequently used for medical purposes in both surgical and nonsurgical equipment such as wound dressings, bandages, catheters, medical face masks, heart valves, skin, bone grafts and other implants.5–10

This increasing Ag NPs commercialization has been achieved due to their significant antimicrobial and antifungal properties. Beside antimicrobial potential,11 Ag NPs have also proven to be active against several types of viruses including human immunodeficiency virus, hepatitis B virus, herpes simplex virus, respiratory syncytial virus, and monkey pox virus.12 The activity of silver nanoparticle is dependent on their size as well as dimensions that is, the smaller the size, the higher the antibacterial activity.13

The novel properties of nanomaterials may affect their persuasive toxic effects, since the properties that make these nanoparticles interesting for a wide range of applications might affect their toxicity,14 increasing their concern about the evaluation of the toxicity. A number of studies revealed that Ag NPs interfere with cellular functions; cause toxic effects and may interfere with specific biological systems.15,16 Many studies have demonstrated that mitochondria are the major targets of Ag NPs,17–21 and so they are considered as major cellular compartments of relevance for nanoparticles toxicity. Ag NPs induced toxicity in human hepatoma cell line22 and oxidative stress related responses such as induction of heme oxygenase I or formation of protein carbonyls in THP-1-derived human macrophages is reported.23 In another study, the toxicity of biologically synthesized silver nanoparticles was assessed in Human Epidermoid Larynx Carcinoma cell line.24

Still, there is a lack of information concerning the toxicity of Ag NPs as well as their potential toxicological implications. Therefore, more studies on the toxicity of silver nanoparticles, in particular genotoxicity, are imperative.

Chinese Hamster Ovary (CHO) cell line is recommended by the OECD for use in the genotoxicity testing. However, studies investigating their suitability for the genotoxic evaluation of nanomaterials, including DNA damage, generation of ROS and mitochondrial membrane potential are not reported for Ag NPs till date. This is the first study reporting Ag NPs (10 nm) induced DNA damage in CHO cell lines using comet assay. Besides genotoxicity study, general toxicity studies, cellular morphology, mitochondrial function (MTT assay), mitochondrial membrane potential, anti-oxidant enzymes assay were assessed at various dose concentrations of Ag NPs.

Results and discussion

Transmission electron microscopy

Transmission Electron Microscopy (TEM) studies were carried out to determine the size and shape of synthesized nanoparticles and was found that the Ag NPs were spherical in shape with an average diameter of 10 nm. Fig. 1 shows the TEM image of synthesized Ag NPs.
image file: c4ra15944f-f1.tif
Fig. 1 TEM image showing distribution and size of Ag NPs.

UV-visible spectroscopy

UV-vis absorption spectroscopy of synthesized Ag NPs showed maxima at 406 nm that confirmed the formation of Ag NPs. UV-vis absorption spectra of Ag NPs have been proved to be quite sensitive to the form of Ag colloids, since Ag nanoparticles exhibit a characteristic absorption peak around 400 nm due to the surface plasmon excitation (Fig. 2).
image file: c4ra15944f-f2.tif
Fig. 2 UV-vis absorption spectra of Ag NPs.

XRD pattern

X-ray diffraction measurements have been performed using P analytical system having Cu Kα as a radiation source of wavelength λ = 1.54060 A° within 2θ = 10–70° at the scan speed 0.5° min−1. The typical powder XRD pattern of the prepared nanoparticles is shown in Fig. 3. The data shows diffraction prominent peaks at 2θ = 38.1°, 44.3° and 64.5°, which can be indexed to (111), (200), (220) planes of pure silver and peak position is almost and matches with database of Ag. From XRD results it is concluded that the main composition of the nanoparticles was silver. The prepared nanoparticles were preserved in an airproof condition.
image file: c4ra15944f-f3.tif
Fig. 3 X-ray diffraction of Ag NPs.

MTT assay

MTT assay is based on the metabolic activity (number of mitochondria) of cells. The results of the MTT assay demonstrated that cells exposed to Ag NPs of mean size 10 nm for 24 h resulted in concentration dependent cytotoxicity. At 3.12 μg ml−1 and 6.25 μg ml−1 concentrations, the viability of cells at 24 h was 96% and 93%, respectively. With increasing concentration of Ag NPs (12.5, 25, 50 and 100 μg ml−1), the percentage viability decreased from 90% to approximately 60% (Fig. 4). After Ag NPs exposure for 24 h in CHO cells, IC-50 value was calculated as 128.0 ± 2.52 μg ml−1.
image file: c4ra15944f-f4.tif
Fig. 4 The effects of Ag NPs on CHO cells viability as determined by MTT assay. Concentration dependent cytotoxic effects of silver nanoparticles evaluated after 24 h of incubation.

Morphological characterization of CHO cells

The CHO cells were exposed with different doses (25, 50 and 100 μg ml−1) of Ag NPs for 24 h and observed under phase contrast microscope. A concentration dependent cell damage and cellular apoptosis was observed in the treated cells (Fig. 5). At low dose (25 μg ml−1), the cells appeared similar to the control cells maintaining normal structure and with increasing doses of Ag NPs, the CHO cells progressed to collapse and shrink. However, with increasing dose from 50 to 100 μg ml−1 cell damage, irregular cell shape and apoptosis were more severe in CHO cells. The cellular adhesion capacity was also found to be lost in the Ag NPs treated cells.
image file: c4ra15944f-f5.tif
Fig. 5 Morphological characterization of CHO cells. Cells were treated with different concentrations of Ag NPs in DMEM Media and incubated for 24 h at 37 °C in a 5% CO2 atmosphere. At the end of 24 h exposure CHO cells were washed with PBS and the cells were visualized by inverted microscope (magnification at 10×). (A) Control (B) cells treated with 25 μg ml−1 of Ag NPs (C) cells treated with 50 μg ml−1 of Ag NPs (D) cells treated with 100 μg ml−1 of Ag NPs.

The development of nanotechnology has resulted in a growing public debate on the toxicity and environmental impact of direct and indirect exposures to nanomaterials.25 Theoretically nano materials are expected to be more toxic than their bulk materials due to their greater surface reactivity and the ability to penetrate into and accumulate within cells and organisms.26 Ag NPs of size 10.0 ± 1.0 nm, synthesized by chemical method were used for the present investigation. CHO cells were exposed to different concentrations of Ag NPs and 50% inhibition in cell growth was observed at dose level 128 ± 2.52 μg ml−1. The cell viability was dose-dependent and it increased with increasing doses of Ag NPs.

Mitochondrial membrane potential

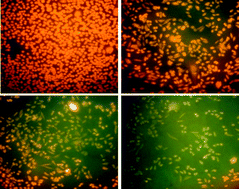
CHO cells were incubated with different concentrations of Ag NPs and stained with the fluorescent dye Rhodamine B. When aggregated inside the healthy mitochondria, Rhodamine B fluoresce reddish orange as in control cells (Fig. 6A). However dispersion of the dye causes it to fluoresce green due to mitochondrial membrane leakage, mitochondrial permeability transition and depolarization in the cytoplasm. Ag NPs exposed cells showed a progressive and continued mitochondrial permeability transition and the green colour became more prominent in cells treated with 100 μg ml−1 of Ag NPs (Fig. 6D).
image file: c4ra15944f-f6.tif
Fig. 6 Fluorescent mitochondria potential staining. Rhodamine B staining indicated mitochondrial depolarization after incubation with Ag NPs. CHO cells were incubated with different concentrations of Ag NPs and stained with the fluorescent dye Rhodamine B. Red punctate staining indicated aggregation of Rhodamine B in intact mitochondria. Green staining of the cytoplasm indicated mitochondrial permeability transition and depolarization with concomitant discharge of Rhodamine B into the cytoplasm. (A) Untreated CHO cells, (B) cells treated with 25 μg ml−1 of Ag NPs (C) cells treated with 50 μg ml−1 of Ag NPs (D) cells treated with 100 μg ml−1 of Ag NPs showed progressive and continued mitochondrial permeability transition (PT).

In cellular apoptotic pathways, mitochondrial damage leads to dissipation of mitochondrial membrane potential (MMP) which is an indicator of mitochondrial integrity and an essential factor responsible for apoptosis.27 Mitochondria are one of the potential target site for Ag NPs mediated cytotoxicity. Following the structural damage to mitochondria from nanoparticles exposure, a loss of mitochondrial membrane integrity, opening of the permeability transition pore, DNA damage and thus cell death may occur.28,29

In the present findings, Ag NPs exposed CHO cells showed a progressive rounding of the cells and dose dependent enhancement in green coloration for Rhodamine dye which is probably due to mitochondrial membrane leakage, permeability transition and its depolarization in the cytoplasm. The fluorescent reagent when aggregated inside the healthy mitochondria fluoresces red, whereas dispersion of the dye due to mitochondrial membrane leakage causes it to fluoresce green in the cytoplasm. These observations indicate a decrease in mitochondrial membrane potential which are in accordance with.30,31

Comet assay

DNA damage was visualized under fluorescent microscope using comet assay. Fig. 7 shows the formation of tailing in individual cells resulting from DNA damage. Similar to the previous observation, the Ag NPs treated CHO cells showed a significant DNA damage as compared to control cells as shown in single cell gel electrophoresis. The comet tail length of 100 cells showed a significantly high level of DNA tailing in both the cells treated with 50 μg ml−1 and 100 μg ml−1 of Ag NPs (p < 0.01). Percent DNA in comet tail and tail moment in Ag NPs treated CHO cells was also noted significantly higher at 50 μg ml−1 and 100 μg ml−1 doses (Fig. 8) (p < 0.01) as compared to control respectively.
image file: c4ra15944f-f7.tif
Fig. 7 Single cell alkaline gel electrophoresis (SCGE) showing DNA fragmentation in Ag NPs treated CHO cells. The cells were incubated for 24 h with different concentrations of Ag NPs. Nuclear staining was visualized under 20× objective of fluorescent microscope. The DNA breaks from individual cells were visualized as comet tails. The experiment was performed in triplicate and a representative experiment is presented. (A) Untreated CHO cells, (B) cells treated with 25 μg ml−1 of Ag NPs (C) cells treated with 50 μg ml−1 of Ag NPs. (D) Cells treated with 100 μg ml−1 of Ag NPs.

image file: c4ra15944f-f8.tif
Fig. 8 (A) Comet tail length (B) percent DNA in comet tail and (C) comet tail moment following Ag NPs treatment in CHO cells. Comet tail length/comet tail area of 100 cells (means ± SD) was calculated with the help of image analyzer software. * and ** indicates statistically significant at p < 0.05 and p < 0.01 levels of comet tail length/percent DNA in comet tail/comet tail moment in Ag NPs treated cells with respect to control respectively.

Studies have suggested that Ag NPs are responsible for biochemical and molecular changes related to DNA damage and genome alterations in cultured cells and animal models.32–34 In fundamental research for DNA damage, genotoxicity testing of novel chemicals and pharmaceuticals, comet assay is a widely used in in vitro as well as in in vivo assay.35 In the present study, there was an intensified DNA damage in the cells exposed to Ag NPs which was found to increase with increase in dose level. The percent DNA in comet tail and tail length were also found to be higher at high doses. Ag NPs induced DNA damage has also been reported earlier in other cell lines using the DNA comet assay like normal human lung fibroblasts (IMR-90), human glioblastoma cells (U251), Jurkat T cells, human mesenchymal stem cells (hMSCs), L-929 fibroblast cell lines, human lung cells BEAS-2B cells.18,36–39 At least 46 cellular in vitro studies and several in vivo studies using the comet assay have been reviewed.40

Anti-oxidant enzyme assays

In this study CAT activity significantly decreased in a dose-dependent manner. At higher concentration of Ag NPs, an inhibition of SOD activity was observed. When tested for the glutathione related anti-oxidant enzymes, glutathione peroxidase activity increased while there was no significant change in glutathione reductase activity or the total glutathione level in Ag NPs treated CHO cells (p < 0.05). However, glutathione-S-transferase activity decreased marginally which were not significant at p < 0.05 (Fig. 9).
image file: c4ra15944f-f9.tif
Fig. 9 Anti-oxidant enzyme profile of CHO cells after treatment with Ag NPs for 24 h. Values represent mean ± SD. * and ** indicates statistically difference at p < 0.05 and p < 0.01 levels of enzyme activity in Ag NPs treated cells with respect to control respectively. (A) CAT activity (B) SOD activity (C) GPx activity (D) GST activity (E) GR activity (F) total glutathione level.

ROS are chemical species including superoxide anion, hydrogen peroxide and the hydroxyl radical that are produced as a by-product of cellular oxygen metabolism. The abnormal accumulation of ROS is called oxidative stress and leads to cellular damage. Oxidative stress plays an important role in many types of cellular injuries resulting in DNA damage and apoptotic cell death.41 In the present study, production of reactive oxygen species (ROS) was found to be increased in CHO cells after incubation with Ag NPs which could be attributed to the production of singlet oxygen or hydrogen peroxide as the major product. Production of free radicals has been demonstrated to have a direct correlation with cytotoxicity of NPs.42 Previous studies have provided strong evidence indicating a relationship between Ag NPs mediated ROS production, the subsequent generation of oxidative stress, and cytotoxicity.18–21,36–38,43,44

A number of in vitro studies revealed that Ag NPs are able to interfere with cellular functions, cause toxic effects and may interfere with specific biological systems in in vitro. Generation of oxidative stress is the most prominent reported mechanism of Ag NPs toxicity, which is the consequence of the generation of intracellular reactive oxygen species (ROS), the depletion of glutathione, altered level of superoxide dismutase (SOD) and catalase enzyme activity in the cells.17,45

To investigate the potential role of oxidative stress as a mechanism of Ag NPs induced toxicity, the effects on catalase, SOD, GPx, GST, total glutathione and glutathione reductase were monitored. In the present study, level of CAT and SOD was found to deplete with increase in dose concentration. CAT and SOD enzymes include antioxidant activities and they protect cells against adverse effects of ROS. Normally, cells are able to reduce oxygen to water through their electron transport chains and protect themselves from normal ROS damage through the use of enzymes such as SOD and CAT.46,47

In the present study we observed higher SOD activity in control but at higher doses, an inhibition tendency of SOD activity was observed, possibly due to toxic effects of higher doses of the Ag NPs. Therefore, oxidative stress is related to decrease in SOD activity. Damage in SOD can significantly affect the defensive mechanisms against free radical attack in the living cell. CAT activity was significantly decreased in a dose-dependent manner. Low CAT activity could also be attributed to enzyme inactivation by ROS-induced damage to proteins.48 CAT plays a role in the decomposition of hydrogen peroxide to give H2O. On balance, our results are in accordance with other investigations that showed nanoparticles cause a decrease in CAT activity.49

Glutathione is a tripeptide with a free reductive thiol functional group, responsible for the detoxification of peroxides such as hydrogen peroxide or lipid peroxides, and acting as an important antioxidant in cells. During the detoxification process glutathione (reduced form) becomes oxidized glutathione (GSSG) which is then recycled to reduced glutathione by the enzyme glutathione reductase present in cells. In the present investigation, levels of total glutathione, GST, GPx and glutathione reductase were also decreased after treatment with Ag NPs as compared to respective controls. Studies on rat liver derived cell line (BRL 3A) showed that there was a significant increase in ROS and decrease in glutathione levels at 25 and 50 μg ml−1 of Ag NPs.17 Statistically insignificant changes observed in the levels of catalase and GPx after treatment with Ag NPs in the present work is suggestive of a differential and less pronounced response by these cellular defense mechanisms as compared to total glutathione, glutathione reductase and SOD. On the whole, data obtained clearly suggest that oxidative stress is the cause of ensuing cytotoxicity in case of Ag NPs exposed CHO cells.

Experimental details

Ag NPs synthesis

Silver nanoparticles (Ag NPs) were synthesized by chemical method as described previously.21 The chemical reduction method involved with well-controlled size in which silver ions are reduced by reductants and stabilizing or protecting agents to prevent these nanoparticles from agglomeration. For Ag NPs synthesis 1 g of citric acid and 50 mg of sodium citrate was dissolved in 100 ml of deionised water. This solution was used to prepare 0.08% sodium borohydrate solution. Precursor solution of silver nitrate was prepared in boiled deionised water and then citrate solution was added and solution was stirred for ∼30 to 60 seconds. Then quickly freshly prepared sodium borohydrate solution was added and the reaction was continued for 10 minutes. The bifurcations of micro and submicron level particles within the colloidal solution were carried out by the centrifuge at 10[thin space (1/6-em)]000 RPM for 10 minutes at room temperature and filtered through a 0.2 micron filter.

Transmission electron microscopy (TEM)

The sample for TEM analysis was obtained by placing a drop of the colloidal solution onto a carbon-covered copper grid and evaporating it in air at room temperature. TEM (FEI Tecnai 20 U Twin, USA) was used for analyzing the size and morphology of Ag NPs.

UV vis spectroscopy analysis

UV-vis spectrophotometer was used to record the absorbance at room temperature with quartz cuvettes (1 cm optical path) as the containers. UV-vis absorption spectra of Ag NPs were obtained in the 300–800 nm wavelength range using an UV-vis spectrophotometer (Varian Cary 50, Germany) operating at a resolution of 2 nm for the analysis of optical properties of colloidal solution.

X-ray diffraction pattern

X-ray diffraction measurements were performed by using P analytical system having Cu Kα as a radiation source of wavelength λ = 1.54060 Å within 2θ = 10–70° at the scan speed 0.4° min−1 for structural confirmation of Ag NPs.

Cell culture

CHO cells were obtained from the National Center of Cell Sciences (NCCS), Pune, India. These were grown in Dulbecco's Modified Eagle Medium (DMEM, Gibco) low glucose (Himedia, India) supplemented with 10% fetal bovine serum (FBS, Gibco) and 1% antibiotics (100 U ml−1 of penicillin and 100 μg ml−1 streptomycin) respectively. Cultures were maintained at 37 °C in an incubator with 5% CO2 atmosphere. Cells were grown in monolayer for 48 h in a T-type culture flask and then trypsinized (0.25% trypsin EDTA, Himedia, India). After trypsinization cells were seeded in different well plates for cytotoxicity assays. Twelve hours later, after the adherence of CHO cells to the plates, different doses of Ag NPs were added to different groups after removal of the culture medium. After 24 h incubation, the cells were observed under an inverted phase contrast microscope (Axiovert 25, Carl Zeiss MicroImaging Co., Ltd, Berlin, Germany) to detect morphological changes.

MTT assay

MTT assay was carried out as described previously.21,50 CHO cells were harvested by incubation in 0.02% EDTA in phosphate-buffered saline for 5 min at 37 °C. After resuspension in fresh medium, 5 × 10³ cells were suspended in 200 μl fresh medium and seeded in a 96-well plate (Griener, Germany) using a multichannel pipette. The plates were incubated at 37 °C for 12 h to allow cells to reattach and reequilibrate. Without removing any medium, serial dilutions of Ag NPs initially ranging from 0 to 100 μM were added to the monolayer. The cells were incubated for 24 h at 37 °C. The cultures were assayed by the addition of 20 μl of 5 mg ml−1 MTT and incubating for 4 h at 37 °C. The MTT-containing medium was then aspirated, after that 200 μl of DMSO (Himedia, Mumbai, India) and 25 μl of Sorensen glycine buffer (0.1 M glycine and 0.1 M NaCl, pH 10.5) were added to solubilize the water insoluble formazone. Absorbances of the lysates were determined on a Fluostar optima (BMG Labtech, Germany) microplate reader at 570 nm.

Morphological characterization by phase contrast inverted microscopy

CHO cells were exposed as mentioned above at various concentrations of Ag NPs for 24 h. After completion of the exposure period, cells (control and exposed) were washed with PBS and observed by phase contrast inverted microscopy at 100× magnification.

Mitochondrial membrane potential

Mitochondrial membrane potential was determined by using a molecular probe; Rhodamine B. This uptake of Rhodamine B into the cells was monitored by following the decrease of the fluorescence intensity at 582 nm (excited at 553 nm) due to the local quencher of Rhodamine B fluorescence, formazan crystals, which took place in the mitochondria.

Anti-oxidant enzyme profile

Adherent cells were collected in centrifuge tubes with the help of a rubber policeman and then subjected to centrifugation at 2000g for 10 min at 4 °C. Cell pellets were homogenized in cold phosphate buffer pH 7.5. Cells were again centrifuged at 14[thin space (1/6-em)]000g for 15 min. at 4 °C and supernatant were removed for enzyme assays.

Total glutathione

Total glutathione was determined according to the protocol described earlier.51 Briefly, the cell pellets were washed with ice cold PBS and were resuspended in 300 μl of buffer A containing 125 mM potassium dihydrogen phosphate, 6.3 mM EDTA, pH 7.5 and was subjected to rapid freeze–thaw processing followed by sonication for 1 min. The protein from the supernatant obtained thereafter was precipitated with 5% trichloro acetic acid for 15 min. After centrifugation at 14[thin space (1/6-em)]000g for 15 min the protein free lysate was then analysed for the total glutathione content. The reduction of glutathione by glutathione reductase was carried out in a 1 ml cuvette containing NADPH (0.525 mM), 5′,5′-dithiobis-2-nitrobenzoic acid (1.5 mM) and supernatant in the ratio of 2[thin space (1/6-em)]:[thin space (1/6-em)]2[thin space (1/6-em)]:[thin space (1/6-em)]1 and 1 U ml−1 of glutathione reductase. The absorbance of the reaction mixture was carried out in a spectrophotometer for 3 min for every 20 s interval and the glutathione content was calculated from the rate of change of absorbance.

Glutathione-S-transferase (GST)

GST activity was assayed in accordance with the protocol described earlier.52 Briefly, the reaction mixture containing 1 mM 1-chloro-2,4-dinitrobenzene (CDNB) and 100 μl of cell lysate was incubated in potassium-phosphate buffer for 10 min at 37 °C. Thereafter 100 μl of 30 mM reduced glutathione was added, mixed thoroughly and the absorbance was calculated immediately at 340 nm at every 30 s for 3 min. The activity of GST was expressed as units per mg protein per min where 1 U is the amount of enzyme that conjugated 1 nM of 1-chloro-2,4-dinitrobenzene with reduced glutathione per min.

Glutathione peroxidase (GPx)

GPx was estimated according to the method.53 Briefly, the assay buffer consisting of 50 mM potassium phosphate buffer at pH 7, 4 mM NaN3, 5 mM GSH, 0.35 mM of NADPH, 1 U glutathione reductase and 100 μl of H2O2 was added to the total protein of 300 μg ml−1. The absorbance of NADP produced was estimated at 340 nM after 5 min of incubation. The activity of glutathione peroxidase was expressed as units per mg protein per min where 1 U is the amount of enzyme that produced 1 nM of oxidized glutathione which is indirectly measured by the reduction of 1 nM of NADPH by glutathione reductase in 1 min.

Glutathione reductase (GR)

Glutathione reductase (GR) assay was performed according to the method described earlier.54 For this, 0.01 ml of 10 mM EDTA, 0.06 ml of 10 mM NADPH, 2 μl β-mercaptoethanol, 0.1 ml of 250 mM GSSG (glutathione oxidized) were added to 0.78 ml of potassium phosphate buffer solution at pH 7.4. Then 0.05 ml of the total homogenate consisting of 0.5 mg total protein per ml was thoroughly mixed with the above. After incubating for 5 min the absorbance of NADPH was measured at 340 nm. The activity of glutathione reductase was expressed as units per mg protein per min where 1 U is the amount of enzyme that reduced 1 nM of oxidized glutathione to reduced glutathione per min.

Catalase (CAT)

CAT activity was assayed according to the method.55 The principle of this method was based on the hydrolyzation of H2O2 by catalase. The conversion of H2O2 into H2O and 1/2 O2 in 1 min under standard condition was considered to be the enzyme reaction velocity. For the reaction, an aliquot (0.02 ml) of cell lysate was homogenised in potassium phosphate buffer, pH 7.0. The spectrophotometric determination was initiated by the addition of 0.1 ml of 0.3 mol L−1 hydrogen peroxide. The reduction rate of H2O2 was followed at 240 nm for 1 min. Catalase activity was expressed in μmol per mg protein per min.

Superoxide dismutase (SOD)

Total superoxide dismutase activity was measured spectrophotometrically in duplicate in the media of different groups of cells by monitoring the SOD-inhibitable autoxidation of pyrogallol.56 The reaction mixture (4.5 ml) consisted of 0.2 mM pyrogallol, 1 mM diethylenetriamine pentaacetic acid, 50 mM Tris–cacodylic acid buffer (pH 8.2), and 4 μg catalase. The reaction was carried out at 25 °C. The rate of increase in absorbance at 420 nm was recorded. One unit of enzyme activity is defined as 50% inhibition of pyrogallol autoxidation under the assay condition.

Alkaline single cell gel electrophoresis (comet assay)

Ag NPs induced cytotoxicity leading to DNA damage was also validated by single cell gel electrophoresis (SCGE) in accordance with the protocol described earlier.57,58 The LMPA (Low Melting Point Agarose, 0.5%) containing cells were then layered onto the slides pre-coated with 1% NMA (Normal Melting Agarose). The slides were placed on ice for 30 min until the agarose layer hardens. One more layer of LMPA to the slides were casted and the slides were then placed into freshly made cold lysing solution (2.5 M NaCl, 100 mM EDTA and 10 mM Tris, pH10.0[thin space (1/6-em)]:[thin space (1/6-em)]DMSO[thin space (1/6-em)]:[thin space (1/6-em)]Triton-100, 89[thin space (1/6-em)]:[thin space (1/6-em)]10[thin space (1/6-em)]:[thin space (1/6-em)]1) overnight. Next day the slides were placed in the electrophoresis buffer (300 mM NaOH, 1 mM EDTA, pH ≥ 13) and electrophoresed for 20 min at the 1 V cm−1 and ≈300 mA in a horizontal electrophoresis unit. Slides were washed 3–4 times with neutralization buffer (0.4 M Tris), then dehydrated in chilled absolute alcohol and stored until analysis. To analyze the DNA damage, the slides were stained with ethidium bromide (EtBr) (10× stock – 20 μg ml−1) and examined by randomly selecting 100 cells (50 on each replicate slide) in each experiment group using fluorescent microscope (Axiovert25, Carl Zeiss Micro Imaging Co., Ltd, Berlin, Germany) with an excitation filter of 515–560 nm and a barrier filter of 590 nm. In the present study DNA migration was analyzed by image analysis software (Tritek Cometscore™ version 1.5), calculating the tail length, % DNA in tail i.e., tail intensity (TI) and tail moment (TM).

Statistical evaluation

The data were expressed as mean ± standard deviation (SD) of three independent experiments. Wherever appropriate, the data were subjected to statistical analysis by one-way analysis of variance (ANOVA) followed by Tukey honest significant difference (HSD) test for comparison between the treated and control groups and within the treated groups. A value of p < 0.05 was considered significant and p < 0.01 level was set as highly significant.

Conclusion

This study aimed at investigating feasibility and challenges associated with conducting a human health risk assessment for silver nanoparticles based on the open literature by following toxicity assays. Ag NPs of size 10 nm prepared by chemical reduction method was used for in vitro toxicity evaluation using CHO cells. The CHO cells exposed to various concentrations of Ag NPs and was found to induce oxidative stress resulting from the generation of intracellular ROS, the changing the antioxidant enzymes activity in the cells which in turn damaged the DNA, leading to apoptosis. These findings suggest that the design and usage of Ag NPs which is associated with health hazard and the risk associated with human exposure requires special care, particularly with respect to their size, to gain satisfactory actions for target sites as well as to reduce cellular toxicity.

Acknowledgements

Authors acknowledge the support from University Grants Commission (UGC) New Delhi, F. 40-410/2011 (SR). One of the authors (KA) owes his due thanks to DST, Govt. of India for INSPIRE Faculty award.

References

  1. R. G. Chaudhuri and S. Paria, Chem. Rev., 2012, 112, 2373 CrossRef PubMed.
  2. I. Pantic, Rev. Adv. Mater. Sci., 2014, 37, 15 Search PubMed.
  3. M. Ahamed, R. Posgai, T. J. Gorey, M. Nielsen, S. M. Hussain and J. J. Rowe, Toxicol. Appl. Pharmacol., 2010, 242, 263 CrossRef PubMed.
  4. K. Kulthong, R. Maniratanachote, Y. Kobayashi, T. Fukami and T. Yokoi, Xenobiotica, 2012, 42, 854 CrossRef PubMed.
  5. L. J. Wilkinson, R. J. White and J. K. Chipman, J. Wound Care, 2011, 20, 543 CrossRef PubMed.
  6. S. W. P. Wijnhoven, W. J. G. M. Peijnenburg, C. A. Herberts, W. I. Hagens, A. G. Oomen, E. H. W. Heugens, B. Roszek, J. Bisschops, I. Gosens, D. Van De Meent, S. Dekkers, W. H. De Jong, M. Van Zijverden, A. J. A. M. Sips and R. E. Geertsma, Nanotoxicology, 2009, 3, 109 CrossRef.
  7. D. Li, J. Diao, J. Zhang and J. Liu, J. Nanosci. Nanotechnol., 2011, 11, 4733 CrossRef PubMed.
  8. J. Lemcke, F. Depner and U. Meier, Acta Neurochir., Suppl., 2012, 114, 347 Search PubMed.
  9. K. N. Stevens, S. Croes, R. S. Boersma, E. E. Stobberingh, C. van der Marel, F. H. van der Veen, M. L. Knetsch and L. H. Koole, Biomaterials, 2011, 32, 1264 CrossRef PubMed.
  10. R. Singh and D. Singh, Int. Wound J., 2014, 11, 264 CrossRef PubMed.
  11. K. K. Awasthi, A. Awasthi, Kamakshi, N. Bhoot, P. J. John, S. K. Sharma and K. Awasthi, Adv. Electrochem., 2013, 1, 42 CrossRef PubMed.
  12. S. Galdiero, A. Falanga, M. Vitiello, M. Cantisani, V. Marra and M. Galdiero, Molecules, 2011, 16, 8894 CrossRef PubMed.
  13. A. R. Shahverdi, A. Fakhimi, H. R. Shahverdi and M. S. Minaian, Nanomedicine, 2007, 3, 168 CrossRef PubMed.
  14. J. P. Wise, B. C. Goodale, S. S. Wise, G. A. Craig, A. F. Pongan, R. B. Walter, W. D. Thompson, A. K. Ng, A. M. Aboueissa, H. Mitani, M. J. Spalding and M. D. Mason, Aquat. Toxicol., 2010, 97, 34 CrossRef PubMed.
  15. E. Fröhlich, Curr. Drug Metab., 2013, 14, 976 CrossRef.
  16. R. Foldbjerg, D. A. Dang and H. Autrup, Arch. Toxicol., 2011, 85, 743 CrossRef PubMed.
  17. S. M. Hussain, K. L. Hess, J. M. Gearhart, K. T. Geiss and J. J. Schlager, Toxicol. In Vitro, 2005, 19, 975 CrossRef PubMed.
  18. P. V. AshaRani, G. L. K. Mun, M. P. Hande and S. Valiyaveettil, ACS Nano, 2009, 3, 279 CrossRef PubMed.
  19. R. Foldbjerg, D. A. Dang and H. Autrup, Arch. Toxicol., 2011, 85, 743 CrossRef PubMed.
  20. J. S. Teodoro, A. M. Simões, F. V. Duarte, A. P. Rolo, R. C. Murdoch, S. M. Hussain and C. M. Palmeira, Toxicol. In Vitro, 2011, 25, 664 CrossRef PubMed.
  21. K. K. Awasthi, A. Awasthi, N. Kumar, P. Roy, K. Awasthi and P. J. John, J. Nanopart. Res., 2013, 15, 1898 CrossRef.
  22. S. Kim, J. E. Choi, J. Cho, K. H. Chung, K. Park, J. Yi and D. Y. Ryu, Toxicol. In Vitro, 2009, 23, 1076 CrossRef CAS PubMed.
  23. A. Haase, J. Tentschert, H. Jungnickel, P. Graf, A. Mantion, F. Draude, J. Plendl, M. E. Goetz, S. Galla, A. Mašić, A. F. Thuenemann, A. Taubert, H. F. Arlinghaus and A. Luch, J. Phys.: Conf. Ser., 2011, 304, 012030 CrossRef.
  24. K. Satyavani, S. Gurudeeban, T. Ramanathan and T. Balasubramanian, Avicenna J. Med. Biotechnol., 2012, 4, 35 CAS.
  25. A. K. Patlolla, A. Berry, L. May and P. B. Tchounwou, Int. J. Environ. Res. Public Health, 2012, 9, 1649 CrossRef CAS PubMed.
  26. C. Carlson, S. M. Hussain, A. M. Schrand, L. K. Braydich-Stolle, K. L. Hess, R. L. Jones and J. J. Schlager, J. Phys. Chem. B, 2008, 112, 13608 CrossRef CAS PubMed.
  27. C. Mammucari and R. Rizzuto, Mech. Ageing Dev., 2010, 131, 536 CrossRef CAS PubMed.
  28. N. Li, C. Sioutas, A. Cho, D. Schmitz, C. Misra, J. Sempf, M. Wang, T. Oberley, J. Froines and A. Nel, Environ. Health Perspect., 2003, 111, 455 CrossRef CAS.
  29. T. Xia, M. Kovochich and A. E. Nel, Front. Biosci., 2007, 12, 238 CrossRef PubMed.
  30. Z. Han, R. Vassena, M. M. Chi, S. Potireddy and M. Sutovsky, Am. J. Physiol.: Endocrinol. Metab., 2008, 295, 798 CrossRef PubMed.
  31. C. Velagapudi, B. S. Bhandari, S. Abboud-Werner, S. Simone and H. E. Abboud, J. Am. Soc. Nephrol., 2011, 22, 262 CrossRef CAS PubMed.
  32. P. Kovvuru, P. E. Mancilla, A. B. Shirode, T. M. Murray, T. J. Begley and R. Reliene, Nanotoxicology, 2015, 9, 162 CrossRef CAS PubMed.
  33. K. Kawata, M. Osawa and S. Okabe, Environ. Sci. Technol., 2009, 43, 6046 CrossRef CAS.
  34. K. K. Awasthi, R. Verma, A. Awasthi, K. Awasthi, I. Soni and P. J. John, Adv. Mater. Lett., 2015, 6, 187 CAS.
  35. G. Speit and A. Rothfuss, Methods Mol. Biol., 2012, 920, 79 Search PubMed.
  36. H. J. Eom and J. Choi, Toxicol. Lett., 2009, 187, 77 CrossRef CAS PubMed.
  37. S. Hackenberg, A. Scherzed, M. Kessler, S. Hummel, A. Technau, K. Froelich, C. Ginzkey, C. Koehler, R. Hagen and N. Kleinsasser, Toxicol. Lett., 2011, 201, 27 CrossRef CAS PubMed.
  38. M. J. Piao, K. A. Kang, I. K. Lee, H. S. Kim, S. Kim, J. Y. Choi, J. Choi and J. W. Hyun, Toxicol. Lett., 2011, 201, 92 CrossRef CAS PubMed.
  39. A. R. Gliga, S. Skoglund, I. O. Wallinder, B. Fadeel and H. L. Karlsson, Part. Fibre Toxicol., 2014, 11, 11 CrossRef PubMed.
  40. H. L. Karlsson, Anal. Bioanal. Chem., 2010, 398, 651 CrossRef CAS PubMed.
  41. R. Franco, R. Sánchez-Olea, E. M. Reyes-Reyes and M. I. Panayiotidis, Mutat. Res., 2009, 674, 3 CAS.
  42. W. Lu, D. Senapati, S. Wang, O. Tovmachenko, A. K. Singh, H. Yu and H. P. C. Ray, Chem. Phys. Lett., 2010, 487, 92 CrossRef CAS PubMed.
  43. L. K. Braydich-Stolle, B. Lucas, A. Schrand, R. C. Murdock, T. Lee, J. J. Schlager, S. M. Hussain and M. C. Hofmann, Toxicol. Sci., 2010, 116, 577 CrossRef CAS PubMed.
  44. P. Sanpui, A. Chattopadhyay and S. S. Ghosh, ACS Appl. Mater. Interfaces, 2011, 3, 218 CAS.
  45. S. Arora, J. Jain, J. M. Rajwade and K. M. Paknikar, Toxicol. Lett., 2008, 179, 93 CrossRef CAS PubMed.
  46. D. White, The Physiology and Biochemistry of Prokaryotes, Oxford University Press, Inc, New York, 2000 Search PubMed.
  47. K. K. Awasthi, P. J. John, A. Awasthi and K. Awasthi, Micron, 2013, 44, 359 CrossRef CAS PubMed.
  48. S. K. Nelson, S. K. Bose, G. K. Grunwald, P. Myhill and J. M. McCord, Free Radical Biol. Med., 2006, 40, 341 CrossRef CAS PubMed.
  49. S. P. Chakraborty, S. KarMahapatra, S. Das and S. Roy, Asian Pac. J. Trop. Biomed., 2011, 1, 482 CrossRef.
  50. T. Mosmann, J. Immunol. Methods, 1983, 65, 55 CrossRef CAS.
  51. H. O. Pae, G. S. Oh, B. M. Choi, E. A. Seo, H. Oh, M. K. Shin, T. H. Kim, T. O. Kwon and H. T. Chung, Toxicol. In Vitro, 2003, 17, 49 CrossRef CAS.
  52. W. H. Habig, M. J. Pabst and W. B. Jakoby, J. Biol. Chem., 1974, 249, 7130 CAS.
  53. D. E. Paglia and W. N. Valentine, J. Lab. Clin. Med., 1967, 70, 158 CAS.
  54. H. U. Bergmeyer and P. Garvehn, Methods of Enzymatic Analysis, Academic Press, New York, 1978, p. 574 Search PubMed.
  55. H. Aebi, Methods Enzymol., 1984, 105, 121 CAS.
  56. S. Marklund and G. Markulnd, Eur. J. Biochem., 1974, 47, 469 CrossRef CAS PubMed.
  57. N. P. Singh, M. T. McCoy, R. R. Tice and E. L. Schneider, Exp. Cell Res., 1988, 175, 184 CrossRef CAS.
  58. R. R. Tice, E. Agurell, D. Anderson, B. Burlinson, A. Hartmann, H. Kobayashi, Y. Miyamae, E. Rojas, J. C. Ryu and Y. F. Sasaki, Environ. Mol. Mutagen., 2000, 35, 206 CrossRef CAS.

This journal is © The Royal Society of Chemistry 2015