
 Open Access Article
 This Open Access Article is licensed under a Creative Commons Attribution-Non Commercial 3.0 Unported Licence
Mechanistic insight into the improved Li ion conductivity of solid polymer electrolytes†
Sudeshna Patra‡
a,
Pallavi Thakur‡a,
Bhaskar Soman‡a,
Anand B. Puthirath ab,
Pulickel M. Ajayanb,
Santosh Mogurampelly§
*c,
V. Karthik Chethan*d and
Tharangattu N. Narayanan*a
ab,
Pulickel M. Ajayanb,
Santosh Mogurampelly§
*c,
V. Karthik Chethan*d and
Tharangattu N. Narayanan*a
aTata Institute of Fundamental Research – Hyderabad, Sy. No. 36/P, Gopanapally village, Serilingampally Mandal, Hyderabad-500107, India. E-mail: tnn@tifrh.res.in; tn_narayanan@yahoo.com
bDepartment of Materials Science and Nanoengineering, Rice University, Houston, TX 77005, USA
cInstitute for Computational Molecular Science, Temple University, Philadelphia, PA 19122, USA. E-mail: santosh@iitj.ac.in
dDepartment of Chemical Engineering, BITS Pilani Hyderabad Campus, Jawahar Nagar, Shameerpet, Hyderabad-500078, India. E-mail: kvenk@hyderabad.bits-pilani.ac.in
First published on 26th November 2019
Abstract
Polymer based solid electrolytes (SEs) are envisaged as futuristic components of safer solid state energy devices. But the semi-crystalline nature and slow dynamics of the host polymer matrix are found to hamper the ion transport through the solid polymer network and hence solid state devices are still far beyond the scope of practical application. In this study, we unravel the synergistic roles of Li salt (LiClO4) and two different polymers – polyethylene oxide (PEO) and polydimethyl siloxane (PDMS), in the Li ion transport through their solid blend based electrolyte. A detailed study using dielectric spectroscopy and thermo-mechanical analysis is conducted to understand the tunability of the PEO chain dynamics with LiClO4 and the mechanism of hopping of Li ions by forming ion pairs with oxygen dipoles on the PEO backbone is established. Despite the lack of PDMS's capability to solvate ions and promote ion transport directly, its proper mixing within the PEO host matrix is demonstrated to enhance ion transport due to the influence of PDMS on the segmental dynamics of PEO. A detailed molecular dynamics study supported by experimental validation suggests that even inert polymers can affect the dynamics of the active host matrix and increase ion transport, leading to next generation high ionic conductivity solid matrices, and opens new avenues in designing polymer based transparent electrolytes.
Introduction
Lithium ion (Li+) based rechargeable batteries have had a tremendous impact and influence in both research and development as high energy density energy storage devices since their commercialization by Sony (Japan) in 1990.1–4 This has revolutionized various industries namely, the automotive industry, portable electronics industry, grid based energy storage sector etc.5,6 Today, most of the conventional Li based rechargeable batteries – working under ambient conditions, use non-aqueous liquid electrolytes to attain a large potential window of operation, high ionic conductivity, high transference number, and low electrode–electrolyte impedance with a suitable solid electrolyte interface (SEI) formation.7–9 But the popularity and widespread usage of organic liquid electrolyte based Li+ based devices recently faced a huge threat in terms of their safety,10–12 and a few incidents even caused regulations on their transport in air travel.13One of the alternatives to alleviate this problem is the development of solid electrolyte (SE) based batteries.14–18. The challenge in the implementation of SE based Li+ batteries is due to their ‘poor’ performance caused by ‘bad’ conductivity of SE with respect to its liquid counterpart (minimum two orders of less magnitude) and unsuitable SEI formation leading to a huge electrode–electrolyte impedance.19 Different classes of SEs were realized in the past, which include (i) inorganic solid electrolytes, (ii) solid polymer electrolytes (SPEs), and (iii) composite solid electrolytes.20–24. Among them, SPEs are emerging as an appealing platform for Li+ batteries due to their excellent safety, superior mechanical stability and flexibility, ease of processability and non flammability along with the amenability of tuning their inherent polymer properties via external agents.25,26 A salt having low lattice energy and a host polymer possessing high dielectric constant are the main constituents of an optimal SPE system.27–29 Among the different polymer matrices, poly(ethylene oxide) (PEO)30–32 has triggered the interest of being served as the host matrix because of its low cost, easy fabrication, outstanding salt-solvating ability, and good electrochemical stability.33–36 The free volume of the polymer host can serve room for the facile movement of Li+.37 The high molecular weight, chain linearity, and presence of substantial number of oxygen atoms in chain backbone serve to facilitate lithium–oxygen hopping. Due to the decelerated polymer chain dynamics caused by its crystallinity at room temperature (melting temperature Tm is ∼65 °C), PEO has low ionic conductivity (10−8–10−4 S cm−1) at room temperature.38–40 Hence most of the Li+ based batteries with PEO based SEs can perform well only above their Tm values, which hence impede their commercial usage.41
In order to tune the Tm to or below the room temperature, various propitious strategies have been adopted where those approaches make the PEO matrix defective/amorphous and reduce the percentage crystallinity below the Tm of the pristine polymer. Addition of inorganic plasticizers or nano fillers,42,43 usage of blends with different polymers,44–46 grafting short PEO oligomers onto polymeric backbone or cross-linking PEO based polymers,47 designing a block co-polymer with a PEO block etc.48 are some of the design criteria to ameliorate the room temperature ionic conductivity of PEO based electrolytes. Recently, the authors have identified PEO–polydimethylsiloxane (PDMS) matrix as a transparent Li+ conducting matrix with high ionic conductivity (0.03 mS cm−1) for Li+ based batteries.49. It is found that the PDMS not only gives a structural integrity to the SE but it also acts as a plasticizer. Further it was found that, being a hygroscopic polymer, modification of PEO with a hydrophobic polymer such as PDMS can help the SE development with relatively high Li+ content. But a mechanistic insight into the underlying mechanism leading to the augmented ion transport in PEO–PDMS matrix was lacking and we undertake this issue both theoretically and experimentally.
The study on the PEO–PDMS based Li+ SEs also disclosed the importance of LiClO4 in tuning the structure of PEO.49 It is hypothesized that the interpenetration of salt inside the PEO lattices and the corresponding formation and disruption of coordination bonds between polar oxygen moiety of PEO and Li salts cause broad relaxation of the local chain segments along with their segmental motion.50,51 Further, through Raman spectroscopy, it is also shown that the cation (Li+) coordination occurs at the C![[double bond, length as m-dash]](https://www.rsc.org/images/entities/char_e001.gif) O site in the PEO.52. The larger anions facilitate easy dissociation of salt in the PEO matrix and set forth the free lithium cations eventually resulting in the increase of ionic conductivity.53 The PEO backbones undergo a segmental motion in the polymer blend while they get amorphized and the inter-segmental ion transport happens through hopping. But a detailed study on the relaxation of PEO chain with the co-ordination of Li+ and/or anions like ClO4− can unveil the ion transport mechanism and it has not been explored much in the literature. A detailed dielectric spectroscopy study conducted here is trying to explore this underlying ion transport mechanism and its effect while increasing the Li+ concentration.
O site in the PEO.52. The larger anions facilitate easy dissociation of salt in the PEO matrix and set forth the free lithium cations eventually resulting in the increase of ionic conductivity.53 The PEO backbones undergo a segmental motion in the polymer blend while they get amorphized and the inter-segmental ion transport happens through hopping. But a detailed study on the relaxation of PEO chain with the co-ordination of Li+ and/or anions like ClO4− can unveil the ion transport mechanism and it has not been explored much in the literature. A detailed dielectric spectroscopy study conducted here is trying to explore this underlying ion transport mechanism and its effect while increasing the Li+ concentration.
It has been known that blending two polymers with different phase transition temperatures can enhance the mechanical compliance by intermixing/entangling physically as well as reduce/suppress the crystallinity of the overall matrix.54,55 PDMS has the Tg at ∼−125 °C.56 Being a polymer having low inter-chain forces, PDMS can change the local viscosity of the matrix. The interface of PEO–PDMS induced dynamics determine the ion transport of this SE and the PDMS induced dynamics in PEO has not been explored so far. Further, this study reports a molecular dynamics (MD) based study to unravel the role of PDMS in PEO dynamics and theoretically calculated the Tg of PEO–PDMS polymer blends based Li+ SEs. At the end, being realized PEO–PDMS–LiClO4 matrix as a futuristic system of SE of interest, Li based coin cells are assembled with the SE, and role of ‘salting in effect’ with different LiClO4 content and role of PDMS in PEO–LiClO4 matrix are verified by experimental and molecular dynamics studies, respectively.
Materials and methods
Synthesis of SEs
Lithium perchlorate (LiClO4, ACS reagent, ≥95.0%), poly(ethylene oxide) (average Mv 600![[thin space (1/6-em)]](https://www.rsc.org/images/entities/char_2009.gif) 000) were obtained from Sigma-Aldrich, USA. The eventual solid polymer electrolyte is formulated following two different methods depending upon the characterization procedures to be performed.
000) were obtained from Sigma-Aldrich, USA. The eventual solid polymer electrolyte is formulated following two different methods depending upon the characterization procedures to be performed.
Samples for dynamic mechanical analysis (DMA) and electrochemical impedance spectroscopy (EIS)
0.1 g of PEO and LiClO4 of varying concentrations dissolved in ethanol were blended thoroughly with 0.5 mL of PDMS (Sylgard 184, viscosity 15–40 mPa s, CAS number 63148-57-2, the details of the PDMS are given in the ESI†). Detailed composition of each precursors are listed in ESI, Table S1.† The mixture was magnetically stirred for 10 minutes to obtain a uniform dispersion of PEO and LiClO4 followed by the addition of curing agent. The possibility of emergence of bubbles during evaporation of ethanol can be circumvented by heating the mixture at 60 °C before the addition of curing agent and the thermo-gravimetric analyses on the cured film shows (data not shown) the absence of any weight loss until 300 °C, indicating the absence of any trapped solvents. Uniform transparent SE films were developed (photographs are given in ESI, Fig. S1†) by a doctor's blade film applicator after curing the films for 5 hours. The films devoid of PDMS were also synthesized in the same procedure except the addition of PDMS and curing agent.Samples for differential scanning calorimetry (DSC), XRD and dielectric spectroscopy
Similar quantities of PEO and LiClO4 were dissolved in excess ethanol at 60 °C till a clear solution was obtained. The solution was casted onto aluminium foils for XRD/DSC studies and onto stainless steel electrodes for dielectric spectroscopy. The films were dried on a hot plate prior to the testing to remove any trace of ethanol. These as prepared films are now named as 10% LiPEO, 20% LiPEO, and 30% LiPEO, respectively, for different salt concentration in PEO and with LiPEOP in respective films having PDMS.Sample preparation for coin-cell studies
In order to prepare SE of PEO and LiClO4, 1 g of PEO and 0.1 g, 0.2 g and 0.3 g (for three different membranes) of LiClO4 were dissolved in excess of acetonitrile at 60 °C till a homogeneous thick slurry is obtained. The bubble free slurry was casted onto aluminium foil. The coating was first allowed to dry at room temperature then dried at 60 °C. The thickness was optimised for 0.6 mm and is kept same for all the different membranes.
The other electrolyte membranes containing PDMS were prepared by mixing 1 g of PEO and 0.2 g of LiClO4 in excess of acetonitrile at 60 °C followed by the addition of 500 μL PDMS and 100 μL of curing agent. A thick turbid slurry is obtained and casted on aluminium foil. The membrane was dried at 60 °C. The thickness is kept similar as that of above (0.6 mm).
The other electrode (anode) of the cell was a lithium chip. The coin cells were assembled inside the glove box as follows: a cathode disc was placed on the coin cell. The SE was then dipped in ethylene carbonate–propylene carbonate solution (0.2 g ethylene carbonate in 1 mL of propylene carbonate) and placed on cathode followed by lithium chip as anode. The coin cell was then closed and sealed through punching.
Characterization
The thermo-mechanical analysis, to study the Tm of PEO in SEs, was conducted with a DMA (Q800 DMA, TA instruments) with a preload of 0.01 N at a constant frequency of 1 Hz. The temperature was swept from room temperature to 90 °C. Dielectric spectroscopy and ionic conductivity measurements were carried out using a Biologic SP300 potentiostat. For dielectric measurement, 100 mg of PEO was mixed with varied concentrations of LiClO4 in 5 mL of ethanol to get a viscous slurry. It was then poured onto flat rectangular stainless steel plates (dimension of 1.5 cm × 1.1 cm, the details of film formation are given above). An oscillatory voltage of 100 mV was employed to evaluate the chain relaxation behaviour of the polymer electrolyte in the frequency ranges of 1 MHz to 10 mHz. The ionic conductivities of the membranes were calculated from the bulk membrane resistance (Rb) measurements using EIS. For the EIS study, the membranes were sandwiched between two stainless steel electrodes of a Swagelok cell with a small oscillatory voltage.The DSC measurements for the melting temperature determination were performed with Shimadzu DSC-60. Precisely weighed samples were placed on aluminium pans and pressure crimped. Scans were performed from 28 °C to 100 °C at a 10°C min−1 temperature ramp in an inert nitrogen atmosphere. An empty aluminium pan was used as reference. The TA instruments, Inc made Q20 differential scanning calorimeter was employed to study the glass transition (Tg) temperatures of the films in the range −80 °C to 100 °C. High pure nitrogen gas purging was ensured (flow rate: 50 mL min−1) throughout the scan period. X-Ray diffraction was carried out using CuKα radiation (Rigaku, λ = 1.5418 Å) at a 2° min−1 scan rate.
Molecular dynamics (MD) simulations
Atomistic MD simulations were used to study the effect of PDMS polymers on PEO–LiClO4 SE. The OPLS set of force field (FF) parameters57 was used to describe the interactions of polyethylene chains. The parameters of Borodin and Smith58 were employed for PDMS polymers (Fig. S2†).To our best knowledge, there is no compatible FF for LiClO4 salt to be used in PEO–PDMS blends. Therefore, we carried out density functional theory (DFT) calculations at the level of B3LYP/6-31g++ theory to derive the respective Lennard–Jones interaction parameters. The DFT energies were fit to the LJ potential to obtain the FF parameters for Li–Cl and Li–O(Cl) atomic pairs. Additionally, the interaction strength in LJ potential was tuned such that the structural features quantified through radial distribution functions (RDFs) of the respective pairs is reproduced (see Table 1). A complete list of bonded and non-bonded FF parameters is provided in Section IV of the ESI.†
| Pair | ε (kcal mol−1) | σ (Å) |
|---|---|---|
| Li–Cl | 0.35 | 3.05 |
| Li–O(Cl) | 0.25 | 2.25 |
Within a polymer molecule, the non-bonded interactions are scaled by a factor 0.5 for indirectly bonded atoms separated by three covalent bonds (i.e., 1–4 interactions) and by a factor of 1.0 for atoms separated by more than three covalent bonds as well as all non-bonded interactions. The non-bonded interactions between the cross-terms in the interaction potential were computed using the arithmetic combining rules: εij = (εiiεjj)1/2 and σij = (σii+σjj)/2. We used a non-bonded interaction cut-off distance of 9.0 Å, beyond which the van der Waals interactions were truncated by including the analytical corrections to pressure and energy. The Coulomb interactions below the cut-off distance were calculated directly, and the particle–particle particle–mesh (PPPM) solver beyond the cut-off distance was used.59
The simulation box contained 40 PEO chains of molecular weight 2.4 kDa and the LiClO4 salt concentration is EO:Li = 15:1. Sufficient number of PDMS chains was added to the simulation box such that the molecular weight of PDMS and its weight percentage were equal to those of PEO. The initial configuration was generated by randomly distributing the PEO, LiClO4 ionic species and PDMS chains in the simulation box without any bias. The blend electrolyte systems were subjected to an equilibration protocol described in our previous articles.60,61 All MD simulations were performed using the LAMMPS simulation package62 at constant number of particles, pressure and temperature (NPT) ensemble with periodic boundary conditions in all three directions. The blend electrolytes were simulated at a temperature of 350 K and 1 atm pressure. Instantaneous snapshots of initial and final configurations of the PEO–PDMS–LiClO4 blend electrolyte are shown in Fig. 4A and B, which will be discussed later in detail.
Ion transport
The long-time diffusive behaviour of ions in PEO–LiClO4 and the effect of PDMS were characterized by computing the mean squared displacement of ions, MSD = 〈(R(t) − R(0))2〉, where R(t) is the position vector of the ions at time t [see Fig. S2†].Results & discussion
Role of LiClO4 in PEO based SEs
The effect of increase in the LiClO4 concentration in SE containing PEO alone is studied using DSC (Fig. 1A). Three different concentrations of PEO–LiClO4 SEs are studied, where those are prepared as discussed in the experimental section. Fig. 1A shows the DSC of pure PEO film and the (PEO–LiClO4) SE films with various weight percentage ratios. The DSC curve of pure PEO shows the Tm around 65 °C, which corroborates well with the reported values.63 On adding the LiClO4 salt to the PEO matrix, the shift in Tm towards room temperature is evident from the figure. This is a direct consequence of the ‘salting in’ phenomenon happening in PEO matrix due to the interaction with the salt, as proposed in our previous work.49 It can be seen that not only the Tm but the melting enthalpy is also gradually decreased – peak intensity decreased along with its broadening. These experimental observations clearly indicate: (i) amorphization of PEO due to the interpenetration of salt in PEO and possible creation of orientational and interfacial defects. The interfaces are being formed between salt and PEO and between various PEO crystals. Secondly, the melting broadening occurrence is due to size heterogeneity of PEO crystals with increase in LiClO4 loading and thirdly, the depression in melting point is possibly due to the combined effects of size reduction of PEO crystals and substantial increase in configurational effects due to defects at the interfaces mentioned earlier.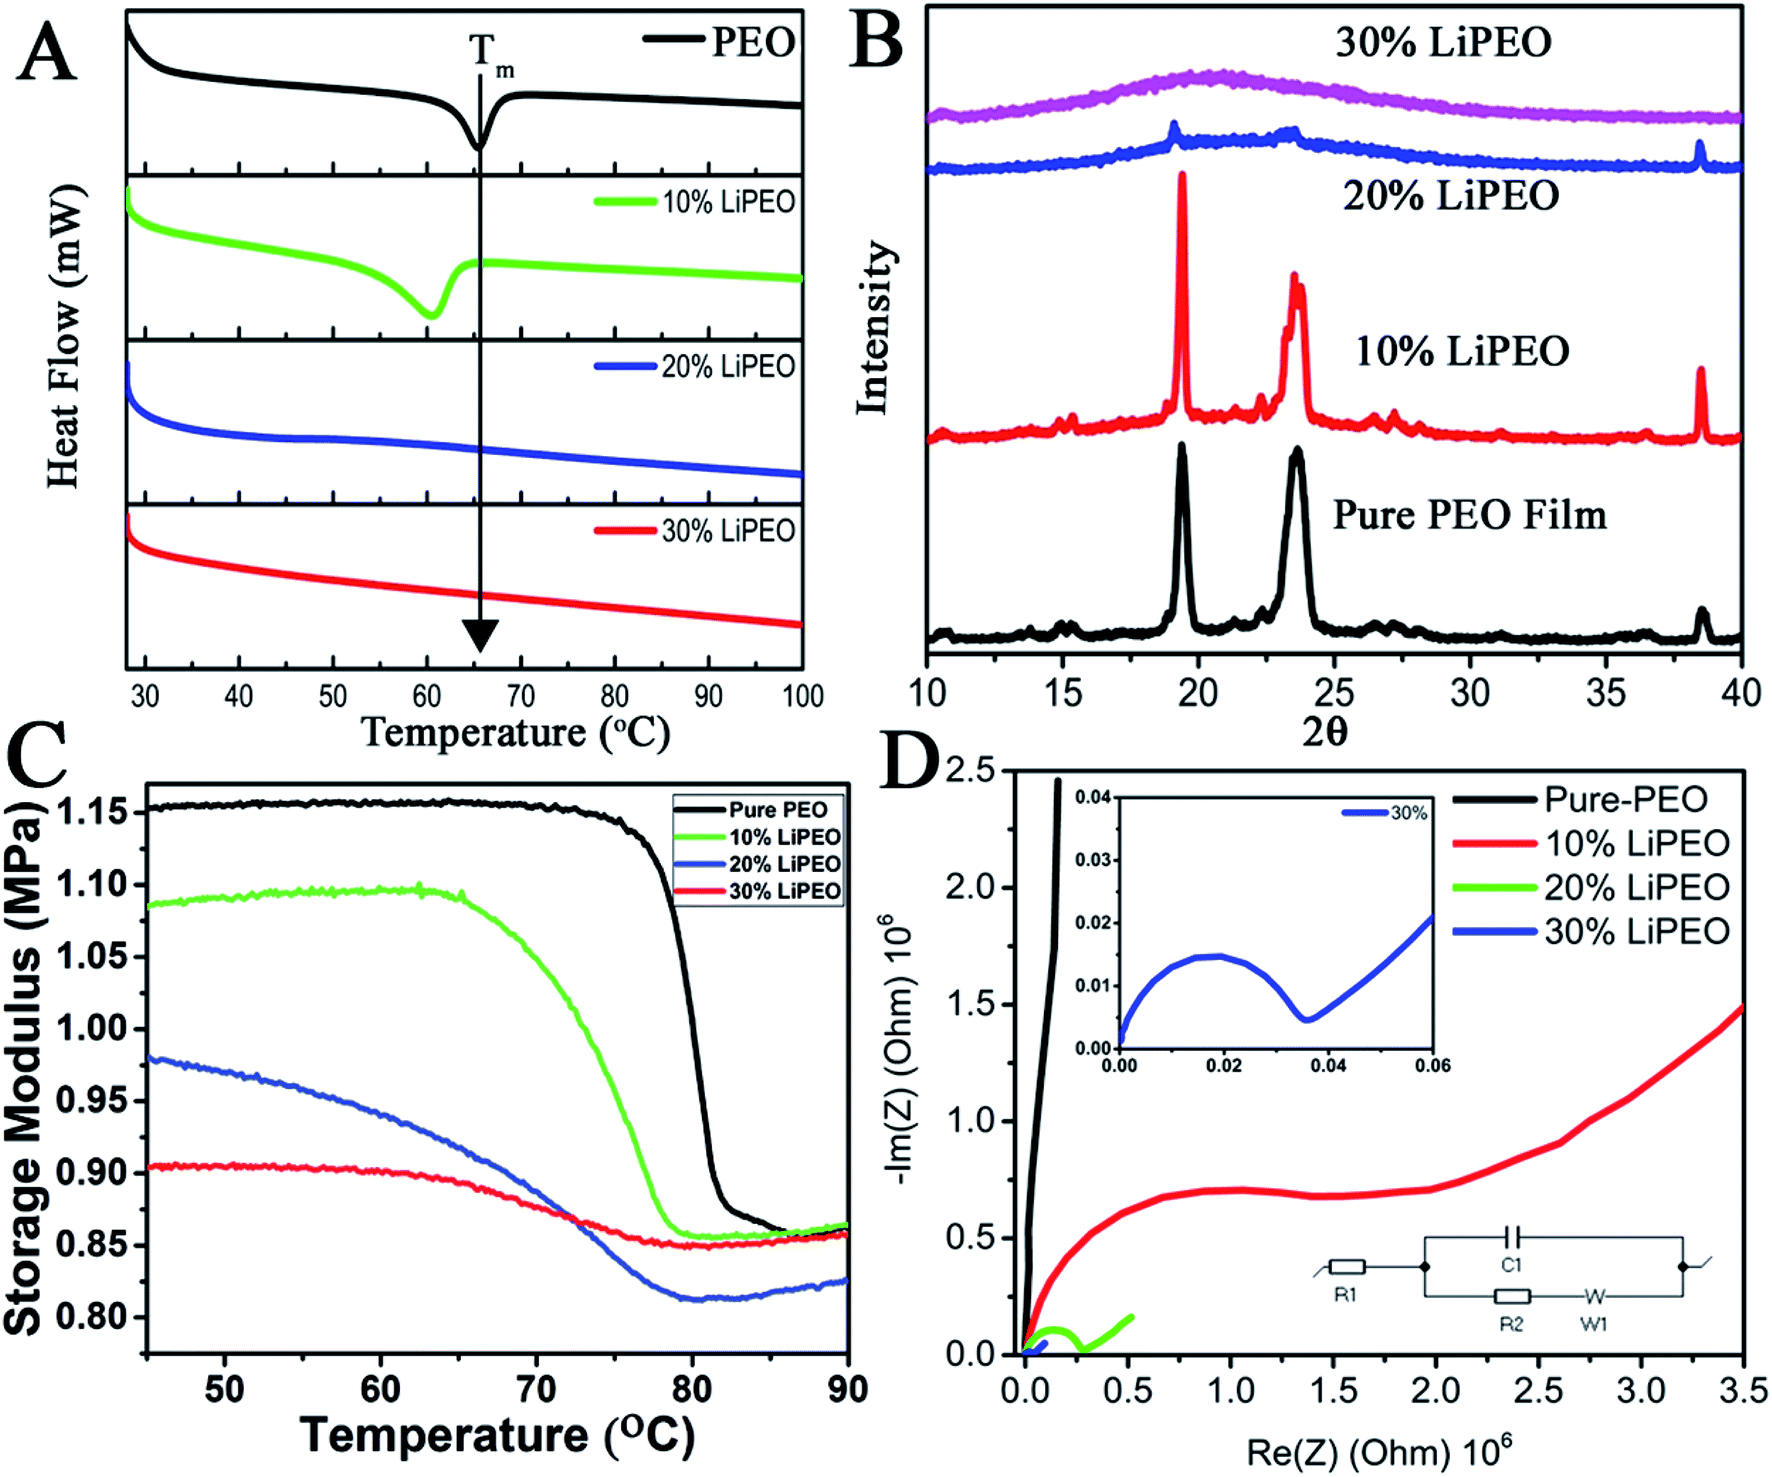 | ||
| Fig. 1 (A) DSC plots and (B) XRD patterns of different SEs. (C) Storage modulus (MPa) vs. temperature (°C) curves at a frequency of 1 Hz. *Tm is assigned to the minima of derivative of the sigmoid curves. (D) The EIS (Nyquist plots) of different samples. The simulated Randles circuit which fit the spectra is also shown in the inset. | ||
To further understand the effect of LiClO4 in the long range ordering of PEO, XRD studies were conducted. The XRD patterns of pure PEO film (Fig. 1B) reveal the characteristic well defined crystalline peaks of PEO at 19° and 23° corresponding to (032) and (112) lattice planes. It can be seen that with increase of LiClO4 concentration from 10% to 30%, the long range ordering in PEO has disappeared where it is reflected in substantial decrease in peak intensity (20 to 30 wt%) and increased broadening (heterogeneity of 2θ and d-spacing, mostly due to the interpenetration of salt within the PEO lattice. 10 to 30 wt%). Further, DMA (discussed later) shows the evidence of physical interpenetration of salt with PEO with reduction in unrelaxed storage modulus values.
The modification in the Tm and amorphization of the polymer matrix can also be studied using thermo-mechanical studies. It is known that the change in thermal properties on Tg (such as heat capacity in DSC) or Tm are much less than the change of the mechanical behaviour in the DMA at these transitions. Here, the variation of storage modulus as a function of temperature for pure PEO and other LiClO4–PEO SEs are given in Fig. 1C. It is interesting to note that the room temperature unrelaxed storage modulus value for the LiClO4 loaded sample is lower than that of the pure PEO matrix. This outcome is directly corroborating the fact that semi-crystalline PEO film is more stiffer than the LiClO4 containing films (SEs), where the PEO is losing its long-range crystalline order due to the intercalated salt and becoming more amorphous at room temperature. There are three regions in the storage modulus curves, namely (i) crystalline region, with the storage modulus being a high value plateau, except for 20 wt% wherein a slight increase is observed, (ii) a sigmoid modulus drop region, corresponding to the respective chain slippages/relaxation in the polymer matrix due to melting of the PEO crystals, and (iii) the high temperature flow region, a low value storage modulus wherein a slight increase with respect to temperature is observed. As the salt concentration is increased, three prominent changes can be observed in the curves. (i) A monotonic depression in the melting temperature (reported in Table 1) of the PEO crystal is observed, in corroboration with DSC data (though the exact values slightly vary, the trend keeps the same in both the measurements), (ii) broadening of the sigmoid region, and (iii) change in the difference (DE) of un-relaxed modulus (EU) and the relaxed modulus (ER) (Table 2).
| Tm | EU | ER | EU − ER | |
|---|---|---|---|---|
| Pure-PEO | 80.12 °C | 1.15 MPa | 0.87 MPa | 0.28 |
| 10% LiPEO | 76.69 °C | 1.08 MPa | 0.87 MPa | 0.21 |
| 20% LiPEO | 70.11 °C | 0.98 MPa | 0.81 MPa | 0.17 |
| 30% LiPEO | 68.04 °C | 0.90 MPa | 0.85 MPa | 0.05 |
Though the DSC and DMA provide similar information (trend, Fig. 1A and C) on the melting transition, the transition temperatures are different. This can be due to the fact that the relaxation time associated with melting in DSC measurements (where all the modes are getting activated (affected)) will be different from that of DMA, where only one particular mode is being activated (uniaxial vibrational and intermolecular mode (uniaxial stress/strain – here tensile mode)). DMA is more able to detect the short-range motion and the onset of chain motion at temperature transition. Because of these reasons, we have chosen the DMA to study the melting point of different LiPEO samples. It is seen that the difference between the unrelaxed and relaxed modulus is decreasing with increasing salt loading and is lowest for the 30% LiPEO. This can be attributed to the mechanical restrain introduced by interpenetration of salt into PEO lattices resulting, (i) salt hosting PEOs and (ii) breakdown of long range order of both PEO and the salt (possibly both orientational and interfacial order) and the resulting increase in configurational entropy at the interfaces of PEO and salt due to intermixing. Further, the depression in melting point can be attributed to configurational modes present in surrounding amorphous phases of PEO and salt, and these modes can trigger additional configurational dynamics at the interfaces of PEO crystalline domains.64
Hence it is concluded that the salt (LiClO4) is aiding for a salting in process leading to the amorphization of the semi-crystalline pure PEO matrix. If this is the case, based on the proposed ion transport mechanisms in SEs, this will be reflected in the ionic (Li+) conductivity of the films. To probe the ion transport mechanism and conductivity, EIS studies (Nyquist plots, Fig. 1D) were conducted by sandwiching the films in two-electrode (stainless steel electrodes of 12 mm diameter) parallel plate capacitor geometry. The ionic conductivity values (σ) from bulk Rb is calculated using the following equation:65
| σ = l/A×Rb | (1) |
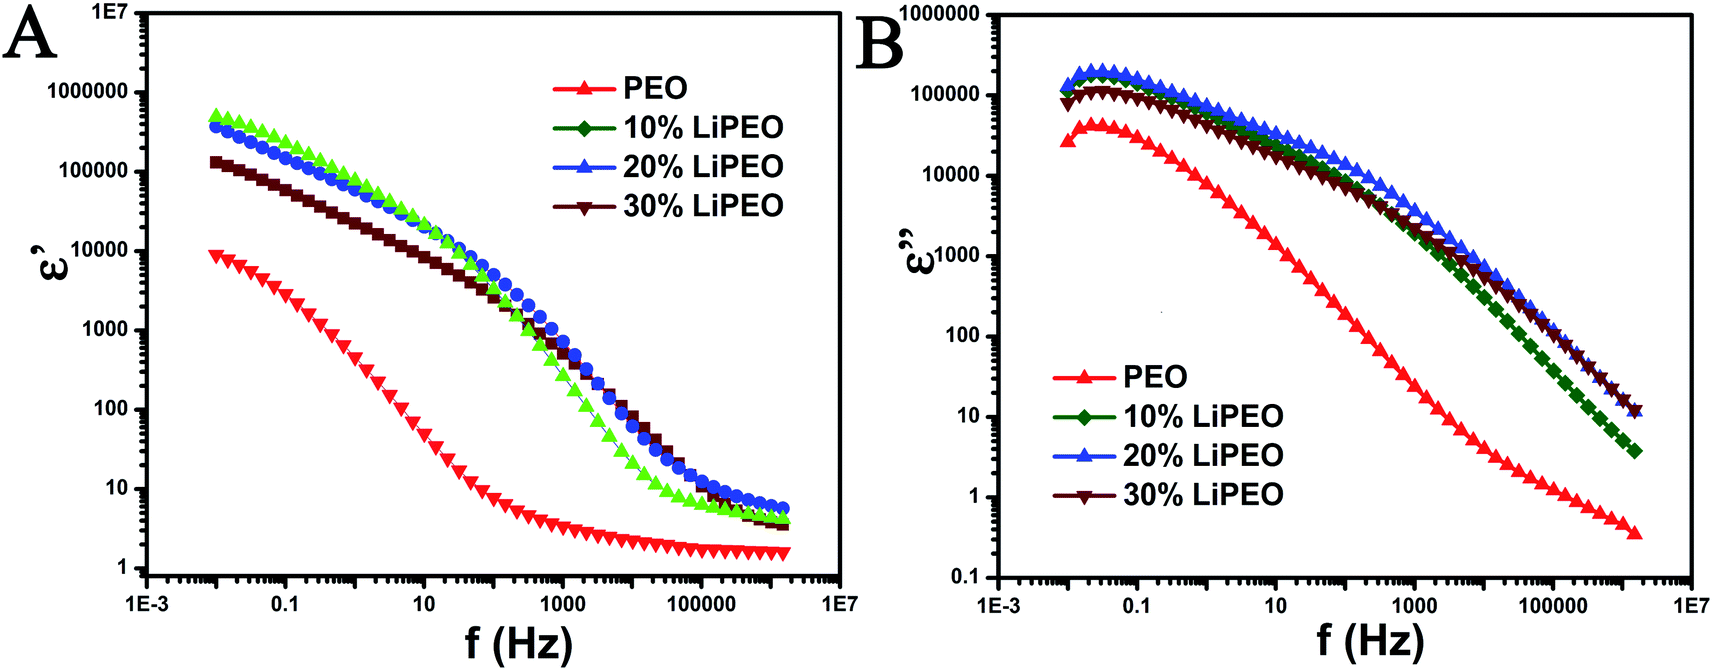 | ||
| Fig. 2 (A) ε′ vs. frequency (f in Hz) and (B) ε′′ vs. frequency plot for different samples. The scales are in log. | ||
The following relaxation processes are observed from both dielectric permittivity (ε′, Fig. 2A) and dielectric loss (ε′′, Fig. 2B) of pure PEO samples:66
1. A low frequency relaxation between 0.01 Hz to 1 Hz corresponding to electrode/interfacial polarization (the determination is due to the high dielectric permittivity values observed at low frequencies and values are in the range of 104 to 106). The electrode polarization arises from an electrical double layer formed on the electrode due to ionic impurities present in the PEO and corresponding solvents.67–69
A relaxation processes in the range of 1 to 0.1 MHz corresponding to normal mode (type-A) relaxation due to the presence of ether groups (type-A dipoles) in the backbone and the corresponding motion of entire PEO chains.70,71
2. A relatively higher frequency relaxation process in the range of 0.1 MHz to 1.5 MHz corresponding to dipolar reorientation of hydroxyl end groups. This reorientation is referred to as segmental motion of the polymer chain and does not involve the motion of the entire macromolecule.70,71
With the salt (10, 20, and 30 wt%), the three relaxation processes mentioned above are also observed. Further, the following differences are also noted:
1. Increase in the low frequency ε′ value (in comparison to PEO) corresponding to electrode/interfacial polarization and corresponding increase in the ΔE for the low frequency relaxation process. The increase in the ε′ is due to the presence of higher amounts of ionic moieties arising from the addition of salt. Further, the increase in dc conductivity and ε′ corresponding to electrode polarization with salting clearly indicates that the charge transfer is less hindered due to the intermixing of salt and PEO and the creation of defects and reduction in percentage of crystallinity. The electrode polarization relaxation frequency does not change significantly with increase in salt wt%.
2. Monotonously with increase in salt wt%, the plateau equilibrium ε' (at around 30 Hz) increases and the type-A relaxation process is more prominent and clearly evident with increased ΔE. The increase in the relaxation intensity is an evidence of increase in polarization (binding of charges) associated with ether group in the PEO backbone due to the formation of ion pairs between lithium ions and ether dipoles. The polarization associated with the formation of ion pairs would involve locking and hopping mechanism of the salt ions with the corresponding counter dipoles present in PEO and its associated relaxation times and dynamic heterogeneity (between 10 Hz and 10 kHz).
3. The type-A relaxation process for salted samples are shifted to higher frequencies in comparison with unsalted sample. This is a clear indication of the increase in ease of chain mobility of PEO backbone for salted samples and is possibly due to the interstitial defects caused by the salt ions in penetrating into PEO lattices and intermixing with the formation of short-lived ion pairs. The creation of defects and reduction in percentage of crystallinity is evidenced from melting point depression and decrease in enthalpy of melting of PEO from DSC results. Further, the DMA results also support the evidence of depression of relaxation point corresponding to PEO melting. The shift to higher frequencies between 10 to 20 wt% salt is clearly evident but for the 30 wt% salt, a slight shift towards lower frequencies is observed. This indicates that 20 wt% salt is an optimal amount for the degree of defects and increase in ease of chain motions and the degree of locking due to formation of ion pairs.
4. The high frequency dipolar relaxation corresponding to hydroxyl end groups shift to higher frequencies monotonously with increase in salt wt%.
Further, the ionic conductivities are calculated from ε′′ too (Table 3) and those values are compared with that obtained from the EIS studies (low frequency part).
| Ionic conductivity (from EIS) | Ionic conductivity (from ε′′) | |
|---|---|---|
| PEO | — | 5.7 × 10⁻¹⁰ S cm−1 |
| 10% LiPEO | 3.7 × 10⁻¹⁰ S cm−1 | 1.9 × 10⁻⁹ S cm−1 |
| 20% LiPEO | 9 × 10⁻⁸ S cm−1 | 2.5 × 10⁻⁹ S cm−1 |
| 30% LiPEO | 3.2 × 10⁻⁷ S cm−1 | 1.4 × 10⁻⁹ S cm−1 |
The DC conductivity, that is obtained from ε′′ after subtraction of its contribution arises from ionic impurities present in the PEO polymer and corresponding residual salts in solvents. Further, contribution from additional ionic moieties arising from increase in salt wt% is also possible. The loss corresponding to DC conductivity is observed at very low frequencies (0.01 to 30 Hz) and involves long range translational motion of the ionic moieties and the dissipation of the same at the electrode.
The conductivity obtained from EIS arises from hopping and lock mechanism of ions (Li+) with the counter ion on the PEO backbone. This is a type of interfacial polarization wherein salt charge hopping occurs with counter ions of PEO chains in certain domains or phases and which are surrounded by insulating PEO chains matrix. Hence the interface is between the charge hopping PEO chains and insulating PEO chains. The loss corresponding to interfacial polarization is observed at moderate frequencies (10 Hz to 10 kHz) and involves alternating mid-range translational motion of the ionic moieties and its trapping at the interface prior to reversing direction. The evidence of the formation of the above-mentioned interface formation is observed with substantial increase in the dielectric permittivity (the real part) for salted samples at the frequency range of 10 Hz to 10 kHz.72
In order to ensure the proper functioning of the coin cells, a proper electrode–electrolyte interface formation is needed to be ensured. Formation of this solid electrolyte and electrode interface (SEI) is an important step for the functioning of a cell. The SEI formation mechanism is still not very clear but certain studies have been carried out to disclose the role of SEI in performance of Li ion battery.73,74 Common SEI components are Li2CO3, ROLi, Li2O, LiOH, (CH2OCO2Li)2, polycarbonates etc. These organic and inorganic decomposition products comprise the SEI.75 Among these (CH2OCO2Li)2 and Li2CO3 are least soluble in the solvents hence better passivating agents than ROLi and ROCO2Li.76 It has been found that at high concentrations of ethylene carbonate (EC) or propylene carbonate (PC) in the electrolyte, (CH2OCO2Li)2 is the major component of SEI.77 These additives helps to improve SEI formation and cell performance effectively.78 This is the reason we chose to put few drops of EC–PC solution at the interfaces to promote the SEI growth. Moreover PEO is the most common solid electrolyte polymer used in batteries. But the behaviour of PEO below the crystalline melting point is different from above the crystalline melting point where PEO loses its crystallinity which in turn favours the long range ionic conductivity.63 At room temperature PEO is not suitable as solid electrolyte due to low ionic conductivity.79 That is why we chose to run the coin cells at 60 °C, near the crystalline melting temperature of PEO.
Here the coin cells were discharged at low rates (C/50) in Neware Battery Testing System because higher discharge rates cause the capacity fading in lithium ion batteries.80 Moreover our interest is to see how the salt concentration in the PEO solid electrolyte affects the overall battery performance. The open circuit voltage (OCV) was found to be around 2.6 V in all three cases. Fig. 3 represents charge discharge curves for the second cycle of the coin cells assembled using SEs, with varying salt concentration 10%, 20% and 30% LiClO4 in PEO named 10% LiPEO, 20% LiPEO, and 30% LiPEO, respectively. One can clearly see from the plots that specific capacity of the cells has increased with the salt concentration. This is due to greater degree of amorphization of LiPEO3 than others which further leads to better Li+ diffusion through the solid SE matrix, in tune with ionic conductivity measurements. The theoretical specific capacity of LiFePO4 is 170 mA h g−1.81 The specific capacity obtained by LiPEO3 cell is nearly 75% of this value, while that of LiPEO2 is 67% and LiPEO1 is 55% of the total theoretical specific capacity.
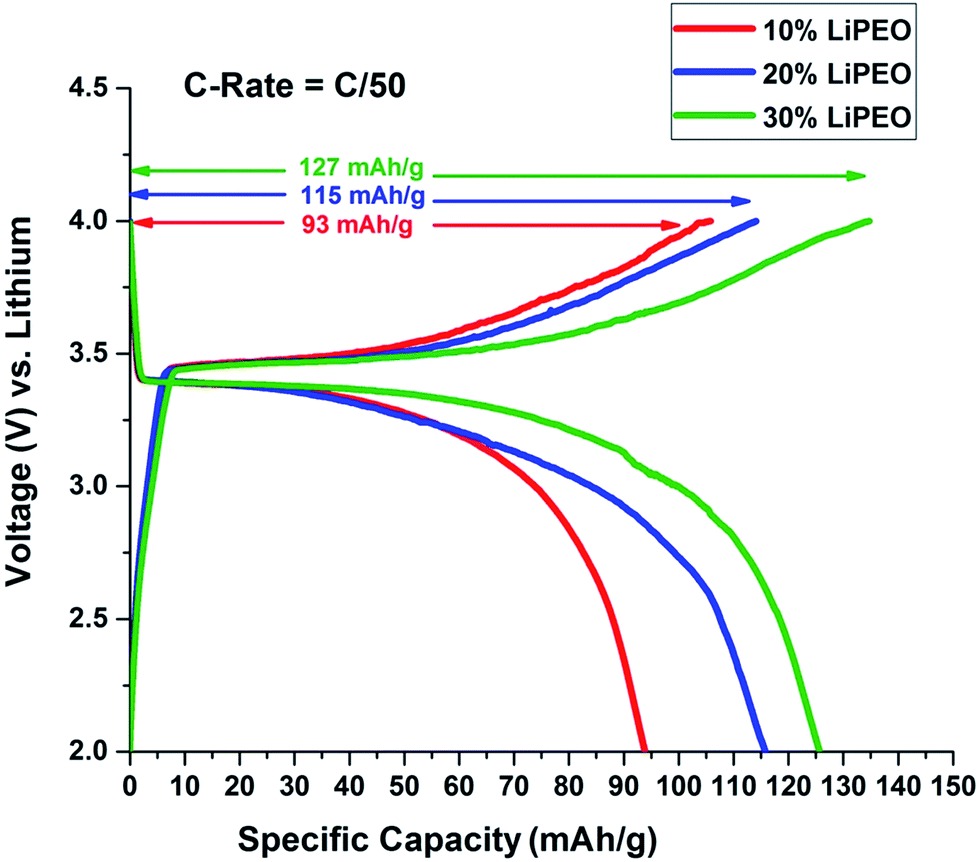 | ||
| Fig. 3 Effect of salt concentration in PEO electrolyte on 2nd cycle of charge discharge of LiFePO4 half cells at 60 °C. | ||
Role of PDMS in PEO–LiClO4 based SEs
Further, the role of PDMS – another polymer, in PEO based SEs is studied. Siloxane alone is an established SE,82 while cross-linking the monomers to form polymer PDMS, the matrix is found to be not conducting Li+ (ESI Fig. S5†). But in our previous study it was proposed that PDMS can act as a plasticiser, which along with structural stability helps PEO for Li+ conduction.49 A mechanistic insight in to this hypothesis was lacking, and we undertook examining the above in this study with the help of MD based calculations. Two different SEs were studied namely, PEO–LiClO4 (LiPEO) and PEO–LiClO4–PDMS (LiPEOP).Theoretical study on ion transport
The long-time diffusive behaviour of ions in PEO–LiClO4 and the effect of PDMS were characterized by computing the mean squared displacement of ions, MSD = 〈(R(t) − R (0))2〉, where R(t) is the position vector of the ions at time t [see Fig. S3†]. Consistent with previous reports,83,84 we observed higher MSD for anions than Li ions due to spatially delocalized charge distribution on anions. Further, it is observed that the diffusion of ions increases with the loading of PDMS in the electrolyte.Mechanisms underlying ion transport – segmental motion
It is reported in the literature that the transport of ions in PEO based polymer electrolytes is influenced strongly by the polymer segmental motion.60,85 To understand the factors governing ion transport, and in particular the effect of segmental motion, we calculated the dihedral angle autocorrelation function (DACF(t) = 〈ϕ(t + t′)ϕ(t′)〉/〈ϕ(t′)ϕ(t′)〉, where ϕ is the dihedral angle) and examined its relaxation behaviour. As shown in Fig. 4C, it is observed that the DACF decays rapidly with time for both the PDMS free and PDMS incorporated electrolytes. In comparing the LiPEO and LiPEOP electrolytes, we observe that DACF decays more rapidly for LiPEOP electrolyte indicating that the addition of PDMS accelerates the polymer segmental motion. As a result, the Li ions coordinated to ether oxygen (EO) atoms of polymer backbone diffuse faster in the matrix. The enhanced segmental motion quantified through DACF thus explains the increased ion diffusivities in the presence of PDMS polymers.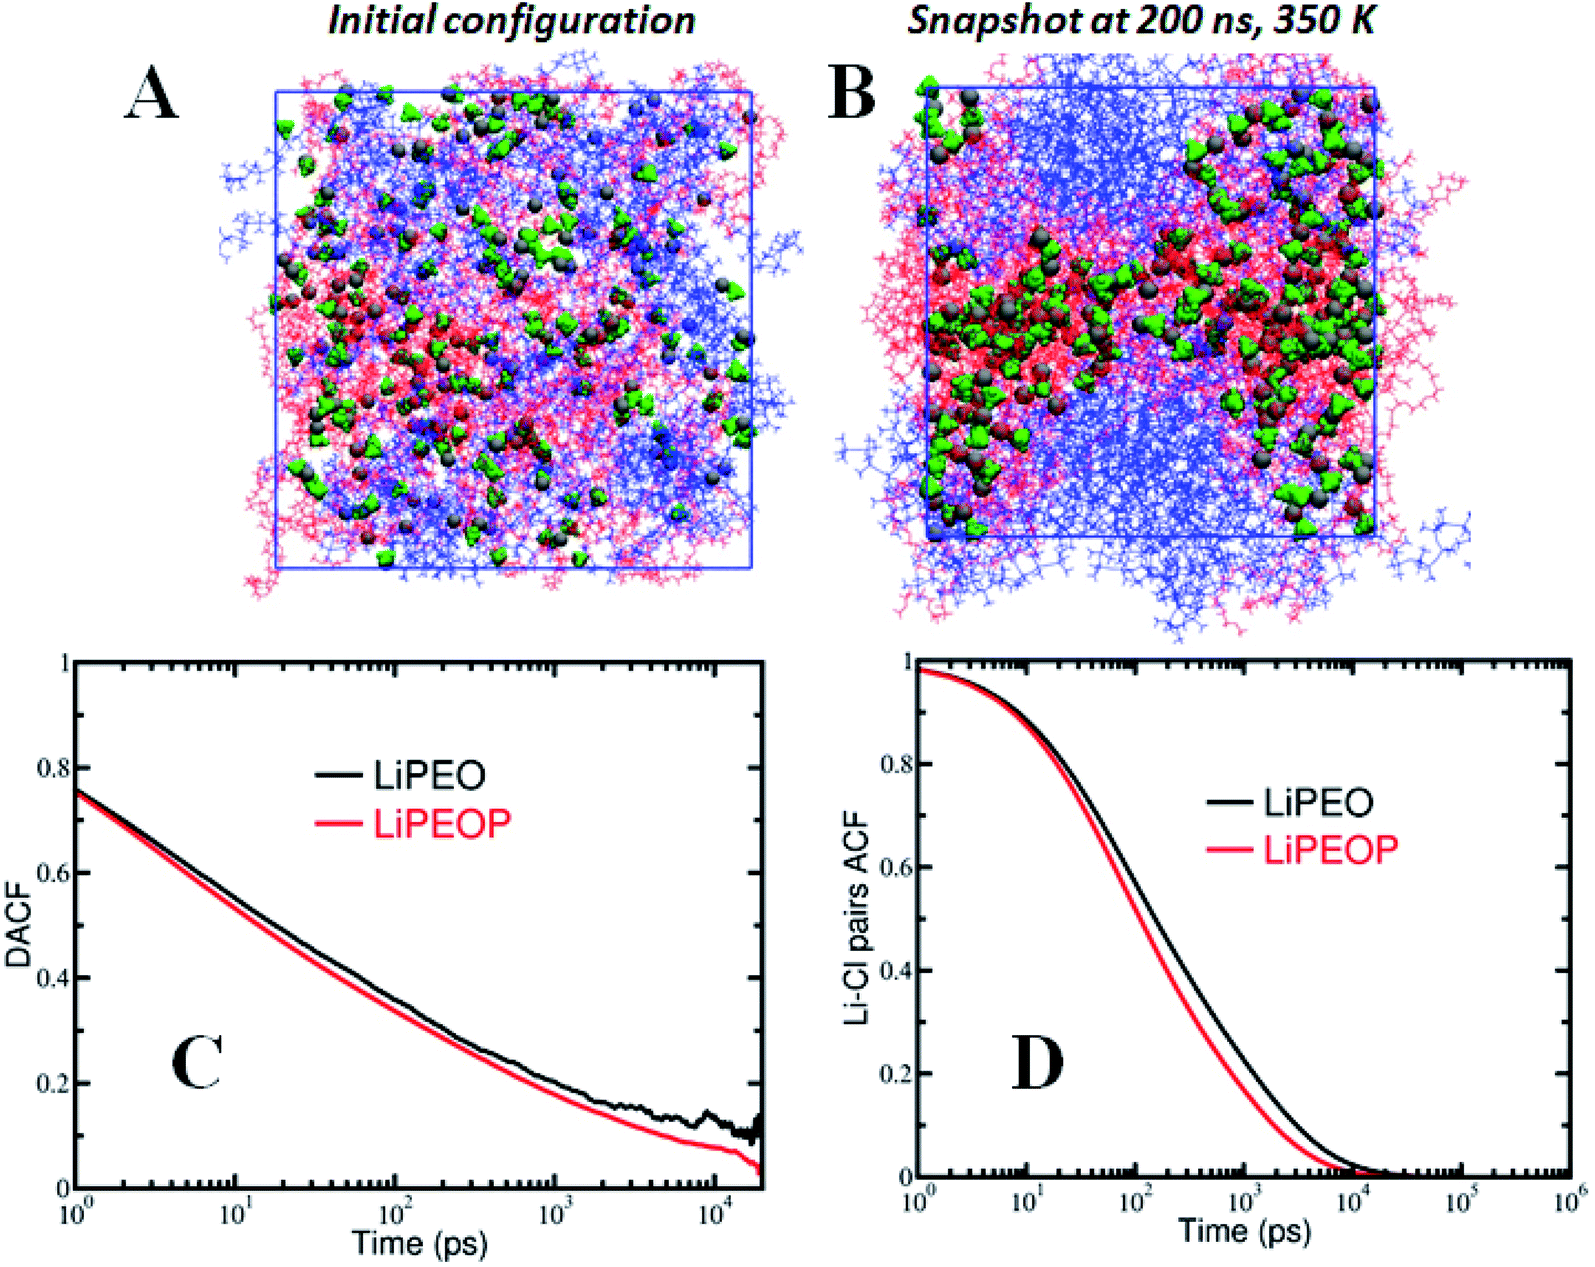 | ||
| Fig. 4 (A) Initial configuration and (B) equilibrated snapshot at 200 ns of the PEO–PDMS–LiClO4 electrolyte at 350 K. (C) Dihedral angle autocorrelation function (DACF) of the PEO polymer backbone to understand the effect of PDMS on polymer dynamics, and (D) Li–Cl ion pairs autocorrelation function (ACF). | ||
Mechanisms underlying ion transport – ion pair relaxations
To gain deeper insights into the ion transport, we computed the ion-pair time autocorrelation function (ACF). Since ion pairs directly influence the ionic conductivity, studying the degree of uncorrelated motion of ion pairs is very important. To probe the relaxation of anion association with cations through explicit ion pairs, we computed the corresponding intermittent autocorrelation functions, S(t) which is defined as S(t) = 〈H(t + t′)h(t′)〉/〈h(t′)h(t′)〉,86 where the population variable h(t′) is given a value 1 if ions are paired at some time t′ and 0 otherwise and H(t) is 1 if ions are continuously paired from time t to time t + t′ and the angular brackets represent an ensemble average over all pairs and time origins. This function provides a more accurate, dynamic definition of ion pairing that can be measured even in highly ionic electrolytes. The cut-off distance defining the ion pair was identified from the first coordination shell of the radial distribution function (see Fig. S4(C)†). The results of ion pair autocorrelation function are presented in Fig. 4D for both the LiPEO and LiPEOP electrolytes. Similar to the trends observed for the relaxation of DACF, the ion pair ACF also decays more rapidly for the LiPEOP electrolytes. Thus the positively and negatively charged ionic species exhibit higher degree of uncorrelated motion with the addition of PDMS polymers to the LiPEO electrolyte. Therefore the ionic conductivity is relatively higher for the LiPEOP electrolyte. Together, the decays of DACF and ion pair ACF unequivocally explain the increased ion transport properties (both the diffusion and conductivity) of PDMS loaded LiPEOP electrolyte.We further calculated the glass transition temperature (Tg) from MD simulations by slowly cooling down the electrolytes (Fig. 5A). The variations in the overall density with temperature were used to extract the glass transition temperature. Consistent with the changes in the ion diffusion, the Tg of the PDMS loaded electrolyte is observed to decrease.
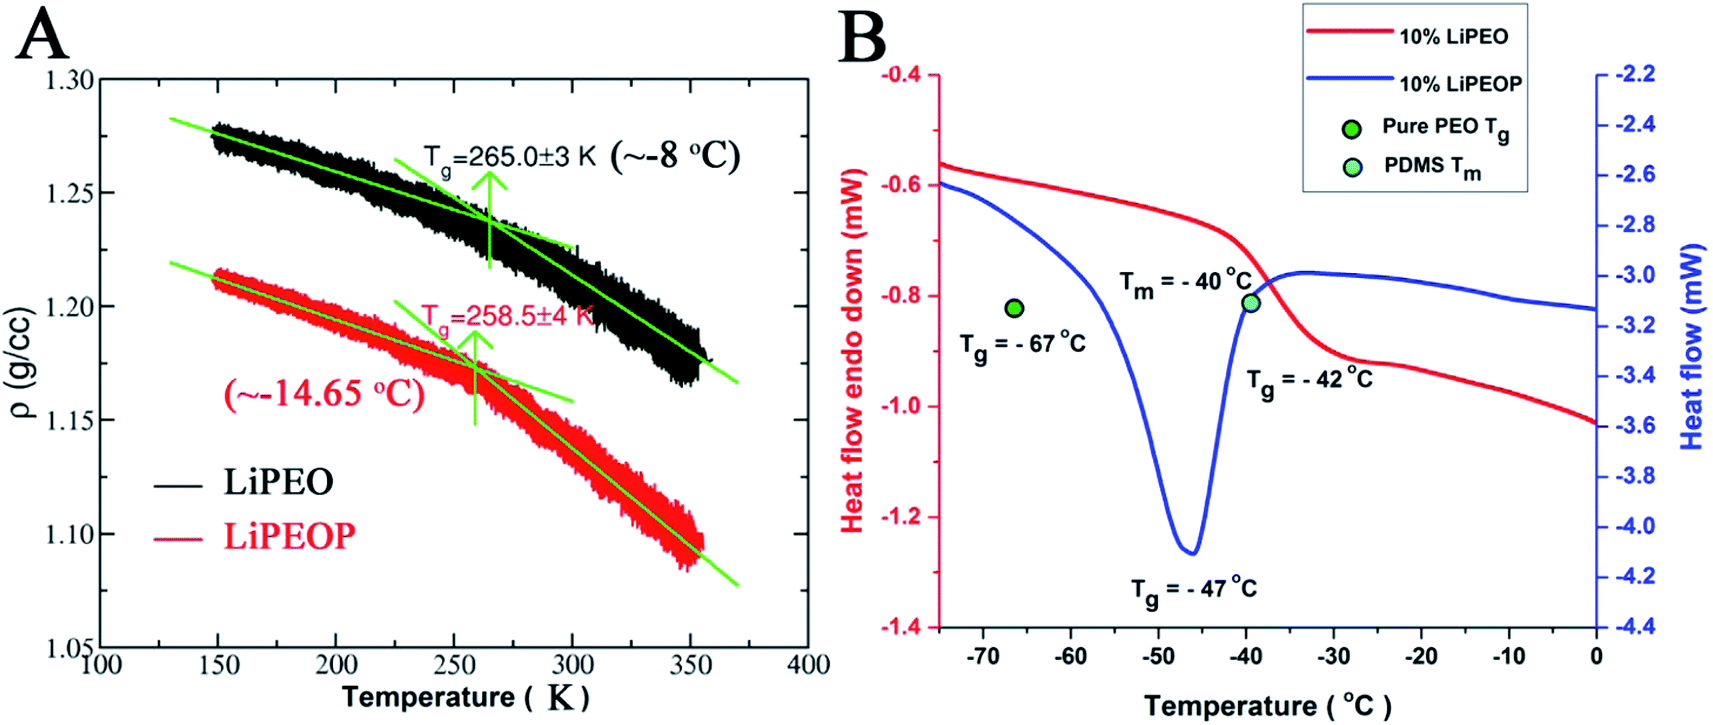 | ||
| Fig. 5 The theoretical (A) and experimental (B) DSC curves of LiPEO and LiPEOP. The Tg of the pure PEO (the reported value) is denoted by the green dot in the (B). The sky blue dot in the figure is the Tm of the PDMS. | ||
The Tg of LiPEO is found to be ∼−8 °C while that of LiPEOP is calculated as −14.65 °C. The decrease in the Tg is in tune with the above discussion of enhancing the relaxation of PEO chains. The change in the Tg of PEO–LiClO4 SE with the inclusion of PDMS is experimentally verified using DSC studies (Fig. 5B). It can be seen that 10% LiPEO (PEO containing 10% LiClO4) has the Tg (of PEO) around −42 °C. The Tg of pure PEO (green dot in the figure) is at −67 °C, which is in corroboration with the theory that the PEO dynamics delays with the inclusion of salt. The inclusion of PDMS (10% LiPEOP) in to the LiPEO has made a peak in the DSC thermogram. It is to be noted that the Tg does not include any latent heat,87 and hence the peak is not due to the glass transition. But it is known that PDMS has the Tm at −40 °C (sky blue dot in the figure),88 and hence the peak is arising due to the Tm of PDMS. But it can be seen that along with that there is a Tg transition too (change in the baseline) and which is found to be shifted to lower temperature (−47 °C), which is due to that of PEO. Hence it can be concluded that the theoretically predicted lowering of Tg of PEO with the inclusion of PDMS is experimentally verified and hence the PEO dynamics can be influenced by the otherwise inactive (towards ionic conductivity) PDMS polymer.
To further ensure the enhanced PEO based SE performance while getting modified with PDMS, a half cell with lithium chip is constructed using LiPEO and LiPEOP, as mentioned before. For this study, 20% LiPEO was used to ensure stability of the SE. As discussed before, adding more salt will affect the mechanical stability of the films too. Further enhancement in the LiClO4 can lead to the ion pair formation and re-crystallization of the salt, as we observed in our previous study using micro-Raman spectroscopy based studies.49 Hence, for the repeatable cell performance, a 20% LiPEO and LiPEOP SEs were optimised (thickness). Since the Tm of the 20% SE is ∼60 °C (as shown by DSC), the operation temperature of the cell is kept at 60 °C throughout the cell measurements in both the cases (LiPEO and LiPEOP based cells). Since the temperature only affects the Tm of PEO, the results can be used for studying the role of PDMS in PEO. It can be seen from charge discharge plots of second cycle (Fig. 6) of PEO–PDMS membranes half cells that specific capacity has further improved from 67% (of the theoretical capacity) to 71% (of the theoretical capacity) at lower discharge rates of C/50 keeping the cells at a temperature of 60 °C. The theoretical capacity of 20% LiPEOP obtained is close to that of 30% LiPEO indicating that the performance of the PEO based SEs containing batteries can be enhanced by tuning the dynamics of PEO with other inert polymers such as PDMS.
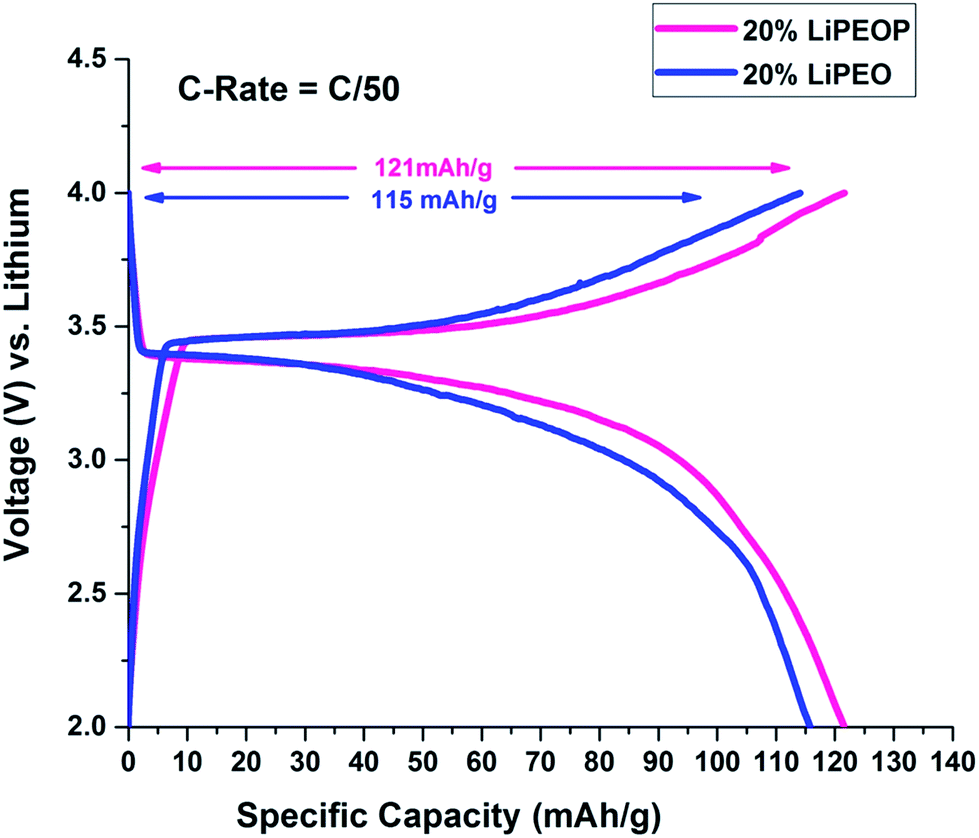 | ||
| Fig. 6 Charge–discharge cycles showing the effect of addition of PDMS in 20% PEO electrolyte on the 2nd cycle of charge–discharge of LiFePO4 half cells at 60 °C. | ||
It is well known that capacity fading will happen with higher C rate. This has been shown in the ESI Fig. S6,† where the charge and discharge cycles were conducted at C/5 rate (0.2C). It is found that with the increase in C rate, the specific capacity has been decreased for both 20% LiPEO (from 115 mA h g−1 to 76 mA h g−1) and 20% LiPEOP also (from 121 mA h g−1 to 98 mA h g−1) while the specific capacity of LiPEOP is still higher than LiPEO, indicating the augmented performance of LiPEOP. Further, it is found that the coin cells developed using these SEs did not show any considerable decrease in their specific capacitance even after large cycles (100th, Fig. S7†).
The temperature dependent ionic conductivity of 20% LiPEOP is conducted and the results (the Nyquist plots) are shown in Fig. S8.† The ionic conductivity is found to be following the Vogel–Tammann–Fulcher (VTF) model and the activation energy for the ionic motion is found to be 0.05 eV per molecule, which is in tune with the earlier report.49
Conclusion
The roles of LiClO4 concentration and PDMS in PEO based transparent solid electrolytes (SEs) are studied and established that both can influence the segmental dynamics of PEO, which further affects the ion transport. The LiClO4 is found to be creating interfacial defects and also amorphizing the PEO matrix as indicated by depression of melting point and substantial decrease in the enthalpy of melting. The normal modes (type A) and dipolar relaxation modes in the PEO were found to be shifted to higher frequencies with the salting and lead to faster dynamics of PEO segments. This fast dynamics is reflected in the ionic conductivity of PEO–LiClO4 based SEs and hence the Li ions based coin cell performance. The SE based coin cell is found to reach 75% of its theoretical capacitance (for 30% LiClO4–PEO) with the addition of LiClO4. The hopping of Li+ ions within the backbone of PEO in certain regions is evident from the dielectric studies too where a substantial increase in the ε′ for salted samples in the frequency range of 30 Hz to 10 kHz is observed as a result of interfacial polarization.The role of PDMS, which is otherwise inactive towards Li ion transport, in PEO towards augmented Li ion transport is also studied using MD simulations and it is found that the diffusion of ions increases with the loading of PDMS in the electrolyte. Further, it is shown that the polymer segmental motion and ion-pair breaking rate increases which conclusively explains the increased ion transport properties (both the diffusion and conductivity) of PDMS loaded LiPEOP electrolyte. The inclusion of PDMS also improved the Li ion based coin cell performance where it is found to be reaching 71% theoretical capacity even with low leading of LiClO4 (20%). In sum, this study for the first time gives a complete description of the synergistic roles of different polymers and Li salt in the augmented ion transport of polymer blends based SEs, where those can be considered as vital segments in the next generation solid state devices.
Conflicts of interest
There is no conflicts to declare.Acknowledgements
Authors thank Tata Institute of Fundamental Research, India for the financial support. S. M. acknowledges US Army Research Laboratory under contract number W911NF-16-2-0189 for the support of the theoretical part of this study. S. M. also acknowledges partial support from the National Science Foundation instrumentation grant number 1625061. A. B. P. thank the Science & Engineering Research Board (SERB) and Indo-US Science and Technology Forum (IUSSTF) for financial support in the form of postdoctoral fellowship. We acknowledge support of the Department of Atomic Energy, Government of India, under project no. 13/3(13)/2012/TIFR/R&D-II/VoI.IV/6768.References
- R. Chen, W. Qu, X. Guo, L. Li and F. Wu, Mater. Horiz., 2016, 3, 487–516 RSC
.
- K. Liu, Y. Liu, D. Lin, A. Pei and Y. Cui, Sci. Adv., 2018, 4, 1–11 Search PubMed
- L. Long, S. Wang, M. Xiao and Y. Meng, J. Mater. Chem. A, 2016, 4, 10038–10069 RSC
- Z. Xue, D. He and X. Xie, J. Mater. Chem. A, 2015, 3, 19218–19253 RSC
- K. E. Aifantis, S. A. Hackney and R. V. Kumar, High Energy Density Lithium Batteries: Materials, Engineering, Applications, WILEY-VCH, 2010 Search PubMed
- L. Lu, X. Han, J. Li, J. Hua and M. A. Ouyang, J. Power Sources, 2013, 226, 272–288 CrossRef CAS
- G. P Gholam and A. Nazri, Lithium Batteries, Science and Technology, Springer, 2009 Search PubMed
- J. B. Goodenough and K. S. Park, J. Am. Chem. Soc., 2013, 135, 1167–1176 CrossRef CAS
- B. Scrosati, J. Hassoun and Y. K. Sun, Energy Environ. Sci., 2011, 4, 3287–3295 RSC
- J. G. Kim, B. Son, S. Mukherjee, N. Schuppert, A. Bates, O. Kwon, M. J. Choi, H. Y. Chung and S. Park, J. Power Sources, 2015, 282, 299–322 CrossRef CAS
- J. M. Tarascon and M. Armand, Nature, 2001, 414, 359–367 CrossRef CAS
- J. B. Goodenough and Y. Kim, Chem. Mater., 2010, 22, 587–603 CrossRef CAS
- M. E. Karp, Flammability Limits of Lithium Ion Battery Thermal Runaway Vent Gas in Air and the Inerting Effects of Halon 1301, Technical thesis, 2017
- A. Tron, A. Nosenko, Y. D. Park and J. Mun, J. Solid State Chem., 2018, 258, 467–470 CrossRef CAS
- G. Zhou, F. Li and H. M. Cheng, Energy Environ. Sci., 2014, 7, 1307–1338 Search PubMed
- P. R. Chinnam and S. L. Wunder, J. Mater. Chem. A, 2013, 1, 1731–1739 RSC
- F. Zhenga, M. Kotobukia, S. Song, O. M. Lai and L. Lua, J. Power Sources, 2018, 389, 198–213 CrossRef
- J. C. Bachman, S. Muy, A. Grimaud, H. H. Chang, N. Pour, S. F. Lux, O. Paschos, F. Maglia, S. Lupart, P. Lamp, L. Giordano and Y. S. Horn, Chem. Rev., 2016, 116, 140–162 CrossRef CAS PubMed
- E. Peled and S. Menkin, J. Electrochem. Soc., 2017, 164, 1703–1719 CrossRef
- H. P. Hong, Mater. Res. Bull., 1978, 13, 117–124 CrossRef CAS
- J. Goodenough, H. Y.-P. Hong and J. A. Kafalas, Mater. Res. Bull., 1976, 11, 203–220 CrossRef CAS
- M. Liu, B. Jin, Q. Zhang, X. Zhan and F. Chen, J. Alloys Compd., 2018, 742, 619–628 CrossRef CAS
- P. A. R. D. Jayathilaka, M. A. K. L. Dissanayake, I. Albinsson and B. E. Mellander, Electrochim. Acta, 2002, 47, 3257–3268 CrossRef CAS
- F. Capuano, F. Croce and B. Scrosati, J. Electrochem. Soc., 1991, 138, 1918–1922 CrossRef CAS
- A. M. Stephan and K. S. Nahm, Polymer, 2006, 47, 5952–5964 CrossRef CAS
- K. Terabe, T. Hasegawa, T. Nakayama and M. Aono, Nature, 2005, 433, 47–50 CrossRef CAS
- W. H. Meyer, Adv. Mater., 1998, 10, 439–448 CrossRef CAS
- D. Baril, C. Michot and M. Armand, Solid State Ionics, 1997, 94, 35–47 CrossRef CAS
- W. S. Young, W. F. Kuan and T. H. Epps, J. Polym. Sci., Part B: Polym. Phys., 2014, 52, 1–16 CrossRef CAS
- D. E. Fenton, J. M. Parker and P. V. Wright, Polymer, 1973, 14, 589 CrossRef CAS
- P. V. Wright, Br. Polym. J., 1975, 7, 319–327 CrossRef CAS
- M. S. Michael, M. M. E. Jacob, S. R. S. Prabaharan and S. Radhakrishna, Solid State Ionics, 1997, 98, 167–174 CrossRef CAS
- R. C. Agrawal and G. P. Pandey, J. Phys. D: Appl. Phys., 2008, 41, 1–18 CrossRef
- F. B. Dias, L. Plomp and J. B. J. Veldhuis, J. Power Sources, 2000, 88, 169–191 CrossRef CAS
- B. Liang, S. Tang, Q. Jiang, C. Chen, X. Chen, S. Li and X. Yan, Electrochim. Acta, 2015, 169, 334–341 CrossRef CAS
- A. Arya and A. L. Sharma, J. Phys. D: Appl. Phys., 2017, 50, 1–52 Search PubMed
- D. Diddens and A. Heuer, J. Phys. Chem. B, 2014, 118, 1113–1125 CrossRef CAS
- A. Magistris and K. Singh, Polym. Int., 1992, 28, 277–280 CrossRef CAS
- E. Quartarone, P. Mustarelli and A. Magistris, Solid State Ionics, 1998, 110, 1–14 CrossRef CAS
- C. Sequeira and D. Santos, Polymer Electrolytes: Fundamentals and Applications, Woodhead Publishing, 2010 Search PubMed
- K. Xu, Chem. Rev., 2014, 114, 11503–11618 CrossRef CAS
- I. Kelly, J. R. Owen and B. C. H. Steele, J. Electroanal. Chem. Interfacial Electrochem., 1984, 168, 467–478 CrossRef CAS
- D. Bresser, B. Oschmann, M. N. Tahir, F. Mueller, I. Lieberwirth, W. Tremel, R. Zentel and S. Passerini, J. Electrochem. Soc., 2015, 162, 3013–3020 CrossRef
- D. Brandell, H. Kasemägi, T. Tamm and A. Aabloo, Solid State Ionics, 2014, 262, 769–773 CrossRef CAS
- Z. Wen, T. Itoh, Y. Ichikawa, M. Kubo and O. Yamamoto, Solid State Ionics, 2000, 134, 281–289 CrossRef CAS
- C. H. Park, Y. K. Sun and D. W. Kim, Electrochim. Acta, 2004, 50, 375–378 CrossRef CAS
- P. V. Wright, Electrochim. Acta, 1998, 43, 1137–1143 CrossRef CAS
- C. P. Fonseca and S. Neves, J. Power Sources, 2002, 104, 85–89 CrossRef CAS
- A. B. Puthirath, S. Patra, S. Pal, M. Manoj, A. P. Balan, J. Sankaran and T. N. Narayanan, J. Mater. Chem. A, 2017, 5, 11152–11162 RSC
- C. Do, P. Lunkenheimer, D. Diddens, M. Gotz, M. Weiss, A. Loidl, X. G. Sun, J. Allgaier and M. Ohl, Phys. Rev. Lett., 2013, 111, 018301 CrossRef
- A. M. Stephan, Eur. Polym. J., 2006, 42, 21–42 CrossRef
- A. Das, A. K. Thakur and K. Kumar, Ionics, 2013, 19, 1811–1823 CrossRef CAS
- S. K. F. Shirey and J. K. Maranas, Macromolecules, 2009, 42, 2142–2156 CrossRef
- J. Sun, D. R. Macfarlane and M. Forsyth, Electrochim. Acta, 1995, 40, 2301–2304 CrossRef CAS
- L. Z. Fan, X. L. Wang and F. Long, J. Power Sources, 2009, 189, 775–778 CrossRef CAS
- D. Fragiadakisa, P. Pissisa and L. Bokobza, Polymer, 2005, 46, 6001–6008 CrossRef
- W. Jorgensen, D. S. Maxwell and J. Tirado-Rives, J. Am. Chem. Soc., 1996, 118, 11225–11236 CrossRef CAS
- J. S. Smith, O. Borodin and G. D. Smith, J. Phys. Chem. B, 2004, 108, 20340–20350 CrossRef CAS
- R. W. Hockney and J. W. Eastwood, Computer Simulation Using Particles, Taylor & Francis, 1989 Search PubMed
- S. Mogurampelly and V. Ganesan, Macromolecules, 2015, 48, 2773–2786 CrossRef CAS
- S. Mogurampelly, V. Sethuraman, V. Pryamitsyn and V. Ganesan, J. Chem. Phys., 2016, 144, 154905 CrossRef
- S. Plimpton, J. Comput. Phys., 1995, 117, 1–19 CrossRef CAS
- B. K. Money and J. Swenson, Macromolecules, 2013, 46, 6949–6954 CrossRef CAS
- L. Gunawan and G. P. Johari, J. Phys. Chem. C, 2008, 112, 20159–20166 CrossRef CAS
- K. R. Cooper, ECS Trans., 2011, 41, 1371–1380 CAS
- K. Venkateshan and G. P. Johari, J. Chem. Phys., 2006, 125, 014907 CrossRef CAS
- J. F. Johnson and R. H. Cole, J. Am. Chem. Soc., 1951, 73, 4536–4540 CrossRef CAS
- R. H. Cole, J. Non-Cryst. Solids, 1991, 131–133, 1125–1130 CrossRef CAS
- R. H. Cole and E. Tombari, J. Non-Cryst. Solids, 1991, 131–133, 969–972 CrossRef CAS
- J. Mijovic, M. Sun and Y. Han, Macromolecules, 2002, 35, 6417–6425 CrossRef CAS
- C. M. Roland, T. Psurek, S. Pawlus and M. Paluch, J. Polym. Sci., Part B: Polym. Phys., 2003, 41, 3047–3052 CrossRef CAS
- M. Samet, V. Levchenko, G. Boiteux, G. Seytre, A. Kallel and A. Serghei, J. Chem. Phys., 2015, 142, 194703 CrossRef CAS
- A. Wang, S. Kadam, H. Li, S. Shi and Y. Qi, npj Comput. Mater., 2018, 15, 1–26 CAS
- S. J. An, J. Li, C. Daniel, D. Mohanty, S. Nagpure and D. L. Wood III, Carbon, 2016, 105, 52–76 CrossRef CAS
- P. Verma, P. Maire and P. Novak, Electrochim. Acta, 2010, 55, 6332–6341 CrossRef CAS
- D. Aurbach, B. Markovsky, A. Shechter, Y. E. Eli and H. Cohen, J. Electrochem. Soc., 1996, 143, 3809–3820 CrossRef CAS
- D. Aurbach, M. D. Levi, E. Levi and A. Schechter, J. Phys. Chem. B, 1997, 101, 2195–2206 CrossRef CAS
- L. Schafzahl, H. Ehmann, M. Kriechbaum, J. Sattelkow, T. Ganner, H. Plank, M. Wilkening and S. A. Freunberger, Chem. Mater., 2018, 30, 3338–3345 CrossRef CAS
- Z. Xue, D. He and X. Xie, J. Mater. Chem. A, 2015, 3, 19218–19253 RSC
- G. M. Ning, B. Haran and B. N. Popov, J. Power Sources, 2003, 117, 160–169 CrossRef CAS
- J. Xu, S. Dou, H. Liu and L. Dai, Nano energy, 2013, 2, 239–242 Search PubMed
- J. Y. Lee, B. Bhattacharya, D. W. Kim and J. K. Park, J. Phys. Chem. C, 2008, 112, 12576–12582 CrossRef CAS
- H. Tokuda, S. Tsuzuki, M. A. B. H. Susan, K. Hayamizu and M. Watanabe, J. Phys. Chem. B, 2006, 110, 19593–19600 CrossRef CAS
- S. Mogurampelly and V. Ganesan, J. Chem. Phys., 2017, 146, 074902 CrossRef PubMed
- P. Johansson, M. A. Ratner and D. F. Shriver, J. Phys. Chem. B, 2001, 105, 9016–9021 CrossRef CAS
- A. Luzar and D. Chandler, Phys. Rev. Lett., 1996, 76, 928–931 CrossRef CAS
- N. R. Jadhav, V. L. Gaikwad, K. J. Nair and H. M. Kadam, Asian J. Pharm., 2009, 3, 82–89 CrossRef
- N. Bosq, N. Guigo, J. Persello and N. Sbirrazzuoli, Phys. Chem. Chem. Phys., 2014, 16, 7830–7840 RSC
Footnotes |
| † Electronic supplementary information (ESI) available: Photographs of SEs, details of SE preparation, MD details such as LJ and FF parameters, and EIS of PEO–PDMS, and Li+–PDMS. See DOI: 10.1039/c9ra08003a |
| ‡ Equally contributing authors. |
| § Present address: Department of Physics, Indian Institute of Technology Jodhpur, Rajasthan 342037, India. |
| This journal is © The Royal Society of Chemistry 2019 |