The influence of phosphonic acid protonation state on the efficiency of bis(diimine)copper(I) dye-sensitized solar cells†
Alexander J.
Stephens
,
Frederik J.
Malzner
 ,
Edwin C.
Constable
 and
Catherine E.
Housecroft
 *
*
Department of Chemistry, University Basel, BPR 1096, Mattenstrasse 24a, CH-4058 Basel, Switzerland. E-mail: catherine.housecroft@unibas.ch
First published on 24th January 2018
Abstract
We present an investigation of the effects of a change in the protonation state of the phosphonic acid anchoring ligand in the dye [Cu(H41)(2)][PF6] (H41 = ((6,6′-dimethyl-[2,2′-bipyridine]-4,4′-diyl)bis(4,1-phenylene))bis(phosphonic acid), 2 = 4,4′-bis(4-bromophenyl)-6,6′-dimethyl-2,2′-bipyridine) on the performance of n-type dye-sensitized solar cells (DSCs). FTO/TiO2 electrodes were immersed in solutions of H41 in the presence of base (0–4 equivalents). TiO2-anchored heteroleptic copper(I) sensitizers were subsequently formed by ligand exchange between the homoleptic complex [Cu(2)2][PF6] and the anchored ligand [H4−n1]n−. The results demonstrate that the addition of one equivalent of base during the initial surface functionalization can afford up to a 26% increase in DSC efficiency, while the addition of ≥3 equivalents of base significantly hinders DSC performance. Deprotonation of H41 has been investigated using 1H and 31P NMR spectroscopic titrations. Further insight into DSC performance has been gained by using electrochemical impedance spectroscopy, and a comparison is made between DSCs in which the working electrodes are either pre-treated with a base, or exposed to a base post heteroleptic copper(I) dye-assembly.
Introduction
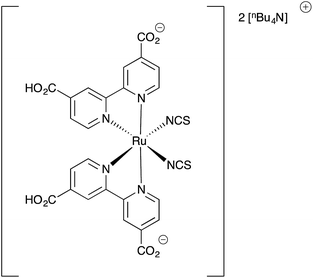
The photoactive component of a typical n-type dye-sensitized solar cell (DSC) consists of a dye molecule bound to mesoporous TiO2.1,2 Efficient dye immobilization on the semiconductor surface facilitates electron injection from the photoexcited dye into the conduction band of the semiconductor (TiO2),3 and prevents the dye from desorbing and diffusing into the electrolyte, thus ensuring the long-term stability of the device.4 Carboxylic and phosphonic acids are commonly incorporated into dye molecules as anchoring domains and show efficient adhesion to TiO2 surfaces.3–7 Using vibrational spectroscopy, Woollfrey and co-workers have demonstrated that cis-di(thiocyanato)-N,N-bis(2,2′-bipyridyl-4,4′-dicarboxylic acid)ruthenium(II) and two of its carboxylate salts bind to nanocrystalline TiO2 through bidentate or bridging carboxylates.8 It is likely that phosphonic acids form similar multi-dentate interactions with TiO2.9While the strength of the surface-dye interactions and the degree of surface coverage achieved by a particular anchoring group are clearly influential in determining the properties and overall efficiency of a DSC, other factors must also be considered. For instance, the adsorption of acidic anchoring groups is thought to proceed with the concomitant transfer of the acidic protons from the dye to the TiO2 surface. The dependence of the conduction band potential on pH is well known for many semiconductors,10–13 and the positive shift in energy associated with proton adsorbed on the TiO2 surface is expected to decrease the open circuit voltage (VOC) of the DSC. This is detrimental to the DSC efficiency although the positive electrostatic field can improve the short-circuit current density (JSC) through the enhanced adsorption of anionic dyes and so assist electron injection.14–17 The adsorption of cations on the TiO2 surface has been shown to reduce back electron-transfer.14,18 Fine-tuning the degree of proton transfer from the anchoring groups to the surface is therefore necessary to achieve an optimal balance between VOC and JSC. Grätzel and co-workers have demonstrated this concept through the use of bis(4,4′-dicarboxy-2,2′-bipyridine)ruthenium(II) complexes in which the carboxylic acid groups of the dye are replaced by tetra-n-butylammonium carboxylates to varying degrees.19,20 DSCs incorporating these different dyes displayed decreased JSC and increased VOC with sequential deprotonation of the dye; the doubly deprotonated form (commonly known as N719) afforded the best overall efficiency (Scheme 1).
Our current interests lie in developing efficient copper-based DSCs as economically viable alternatives to those utilizing ruthenium(II) dyes.21 We have shown that the phosphonic acid anchoring ligand H41 (Scheme 2) reliably affords DSCs which perform well when combined with a suitable ancillary ligand.22 Comparisons of analogous copper(I) heteroleptic sensitizers in which the anchoring domain is either phosphonic or carboxylic acid reveal that dyes with the former typically outperform those with the latter.23,24 Dyes anchored to TiO2 through phosphonic acids are known to be more resistant to changes in pH,25 and this is attributed to differences in the pKa of the CO2H and PO(OH)2 anchoring groups.19,26 We now report how the protonation state of H41 can be modified to optimize the efficiency of the performance of a model heteroleptic copper(I) dye in n-type DSCs.
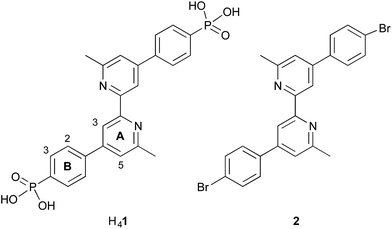 | ||
| Scheme 2 Structures of anchoring ligand H41 and ancillary ligand 2. The labelling of the aromatic rings refers to the NMR spectroscopic assignments. | ||
Experimental
General
1H, 13C and 31P NMR spectra were recorded at 295 K on a Bruker Avance III-500 NMR spectrometer. 1H and 13C NMR chemical shifts were referenced to the residual solvent peaks with respect to δ (TMS) = 0 ppm and 31P NMR chemical shifts with respect to δ (85% aqueous H3PO4) = 0 ppm. Solid-state absorption spectra were recorded on a Cary 5000 spectrophotometer. The syntheses of ligand H41,222,27 and homoleptic metal complex [Cu(2)2][PF6]22 have been previously described. Working electrodes were screen-printed according to our reported procedure.28 Working electrodes were pre-treated with 40 mM aqueous TiCl4 at 70 °C for 30 min.28Preparation of dye-functionalized electrodes
The working electrodes were washed with EtOH (HPLC grade), sintered at 450 °C (30 min), then cooled to ca. 80 °C before being immersed in a premixed solution of H41 (DMSO, 1.0 mM) and a base (0.1 M in EtOH, 0 to 4 equivalents with respect to H41) for 24 h (ambient temperature); see text for the base used. After removal from the solution, the functionalized electrodes were washed with DMSO and EtOH, then dried under a steam of N2. Each electrode was immersed in a solution of [Cu(2)2][PF6] (CH2Cl2, 0.1 mM) for 72 h, washed with CH2Cl2 and dried in air.Preparation of dye-functionalized electrodes with pre- or post-base-treated electrodes
The working electrodes were washed and sintered as described in the previous section. After cooling to ca. 80 °C, base pre-treated electrodes were first dipped in a solution of base (see text, 0.1 M in EtOH diluted in DMSO to achieve an overall concentration of 1 mM). After 24 h, the electrodes were removed, washed with DMSO and EtOH, and dried under a stream of N2. The electrodes were then immersed in a solution of H41 (DMSO, 1.0 mM) for 24 h, before washing again with DMSO and EtOH, followed by drying under N2. Finally, the electrodes were dipped in a solution of [Cu(2)2][PF6] (CH2Cl2, 0.1 mM) for 72 h. For base post-treated electrodes, the order of the dipping procedures was changed as described in the Results and discussion section.Reference electrodes
An N719 reference electrode was made by dipping a TiO2 coated working electrode cooled to ca. 80 °C in a solution (EtOH, 0.3 mM) of N719 (Solaronix) for 3 days. The electrode was removed from the dye-bath, washed with EtOH and dried under a stream of N2.Electrodes for solid-state absorption spectroscopy
Dye-functionalized electrodes were assembled as detailed above but using Solaronix Test Cell Titania Electrodes Transparent.DSC fabrication and measurement
Solaronix Test Cell Platinum Electrodes were used for the counter electrodes. The working and counter electrodes were joined using thermoplast hot-melt sealing foil (Solaronix Test Cell Gaskets) by heating while pressing them together. Electrolyte composition: LiI (0.1 M), I2 (0.05 M), 1-methylbenzimidazole (0.5 M), 1-butyl-3-methylimidazolinium iodide (0.6 M) in 3-methoxypropionitrile. The electrolyte was introduced into the DSC by vacuum backfilling and then the hole in the counter electrode was sealed (Solaronix Test Cell Sealing) and covered (Solaronix Test Cell Caps).DSC measurements were made by irradiating from the anode side of the cell using a light source LOT Quantum Design LS0811 (100 mW cm−2 = 1 sun). The power of the simulated light was calibrated using a reference Si cell. All DSCs were made in duplicate and were completely masked before measurements were made.29,30
External quantum efficiency (EQE) measurements were made using a Spe-Quest quantum efficiency instrument from Rera Systems (Netherlands) with a 100 W halogen lamp (QTH) and a lambda 300 grating monochromator (Lot Oriel). The monochromatic light was modulated to 3 Hz using a chopper wheel (ThorLabs). The cell response was amplified with a large dynamic range IV converter (CVI Melles Griot) and measured with a SR830 DSP Lock-In amplifier (Stanford Research).
Electrochemical impedance spectroscopy (EIS) measurements were carried out on a ModuLab® XM PhotoEchem photoelectrochemical measurement system from Solartron Analytical. The impedance was measured at the open-circuit potential of the cell at different light intensities (590 nm) in the frequency range 0.05 Hz to 400 kHz using an amplitude of 10 mV. The impedance data were analysed using ZView® software from Scribner Associates Inc.
NMR titrations
Solutions of nBu4NOH (500 mM) and H41 (5 mM) were prepared in DMSO-d6. The nBu4NOH solution was added to the H41 solution in 10 μL aliquots, with thorough mixing followed by 15 minutes intervals of rest between additions. The 1H NMR and 31P NMR spectra of the sample were measured after each equilibration period, and the entire process was repeated until no further changes were detected in the chemical shifts of the NMR spectroscopic resonances.Results and discussion
DSC performances with [Cu(Hn1)(2)]n−3 sensitizers
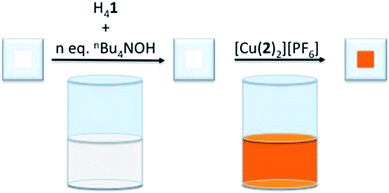
To determine the influence of the phosphonic acid protonation state on the photoconversion efficiency, η, of a DSC containing [Cu(Hn1)(2)]n−3 as the sensitizer, TiO2 electrodes were functionalized with [Cu(Hn1)(2)]n−3 (where n = 0 to 4,31 see Scheme 2 for the structure of 2) using our established ‘surfaces-as-ligands’ strategy.21 [X]4−n[Hn1] salts were generated by the addition of an ethanol solution of base to a DMSO solution of H41. The choice of base determines the nature of the cation, X+. The heteroleptic dye was generated on the TiO2 surface by the sequential exposure of FTO/TiO2 electrodes to the [X]4−n[Hn1] solution, followed by a CH2Cl2 solution of the homoleptic complex [Cu(2)2][PF6] (Fig. 1).Initial studies investigated the use of nBu4NOH as a base since [nBu4N]4−n[Hn1] salts were readily soluble in DMSO. Following the assembly of the heteroleptic copper(I) dye on the surface of the electrode, visible differences in the colour of the electrodes were observed. Those with <3 equivalents of nBu4NOH added to the H41 solution were intense orange, while those with 3 or 4 equivalents were appreciably paler. The solid-state absorption spectra of the dye-functionalized electrodes (Fig. S1†) showed a reduction in the intensity of the MLCT band on addition of base. Assuming that the extinction coefficient for the MLCT band of the surface adsorbed dye does not change significantly upon addition of base (see below), these data imply that fewer dye molecules were present on the TiO2 at higher pH. Previous studies have demonstrated that dyes adsorbed onto TiO2 through acidic anchors may be sensitive to high pH,25,32 and are prone to desorb from the substrate under such conditions. Therefore, it is likely that an increase in pH which accompanies the presence of excess base militates against efficient anchoring of [Hn1]n−4. With respect to the assumption made above, it is, unfortunately, not possible to measure the extinction coefficients for the heteroleptic dyes since their desorption from the electrodes followed by dissolution results in an equilibrium mixture of heteroleptic and homoleptic species. As a control experiment, we recorded the absorption spectra of DMSO solutions containing [Cu(MeCN)4][PF6] and H41 in the presence of different equivalents of nBu4NOH (Fig. S2†). The MLCT band shows a blue-shift from 494 to 488 nm after the addition of ≥1 equivalent of base, and a decrease in εmax from 10![[thin space (1/6-em)]](https://www.rsc.org/images/entities/char_2009.gif) 600 to 7900 dm3 mol−1 cm−1.
600 to 7900 dm3 mol−1 cm−1.
The addition of one equivalent of nBu4NOH with respect to H41 to the anchoring ligand solution resulted in an ≈15% increase in DSC efficiency (a rise from η = 1.72 to 1.97% versus 6.25% for an N719 reference DSC, Table 1) demonstrating that deprotonation can have a beneficial effect. However, as further equivalents of nBu4NOH were added, the cell efficiency significantly decreased until a final value of η = 0.21% was obtained (Table 1). Despite a gradual decrease in efficiency observed over the 7 days period following DSC fabrication, the trend in photoconversion efficiency with respect to equivalents of added base was retained (Table S1†). The increased cell efficiency on going from 0 to 1 equivalent of nBu4NOH arises from increases in both JSC and VOC, while decreased cell efficiency upon addition of further base is, conversely, a result of decreases in JSC and VOC (Fig. 2).
| Dye | Equiv. of nBu4NOH with respect to H41 | J SC [ mA cm−2] | V OC [mV] | FF [%] | η [%] | Rel. η [%] |
|---|---|---|---|---|---|---|
| [Cu(Hn1)(2)]n−3 | 0 | 4.61 | 521 | 72 | 1.72 | 27.5 |
| [Cu(Hn1)(2)]n−3 | 1 | 5.11 | 535 | 72 | 1.97 | 31.5 |
| [Cu(Hn1)(2)]n−3 | 2 | 4.59 | 512 | 70 | 1.65 | 26.4 |
| [Cu(Hn1)(2)]n−3 | 3 | 2.11 | 434 | 69 | 0.63 | 10.1 |
| [Cu(Hn1)(2)]n−3 | 4 | 0.75 | 404 | 70 | 0.21 | 3.4 |
| N719 | — | 14.3 | 635 | 70 | 6.25 | 100 |
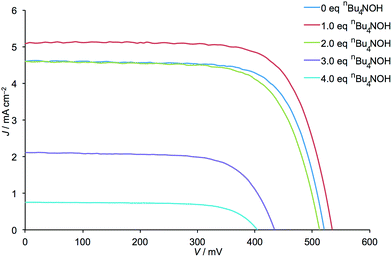 | ||
| Fig. 2 J–V curves for the DSCs listed in Table 1. | ||
External quantum efficiency (EQE) data are presented in Fig. 3 and demonstrate an initial increase in the value of EQEmax after the addition of 1 equivalent of nBu4NOH. This is followed by a decrease in EQEmax when further equivalents of base are added. It should be noted that for all DSCs, the profile of the EQE curves (λmax ≈ 480 nm) and solid state UV-vis spectra (λmax ≈ 480 nm) are unchanged, indicating that the wavelength of the MLCT band and absorption range of the dye are not significantly altered by the deprotonation of the anchoring ligand.
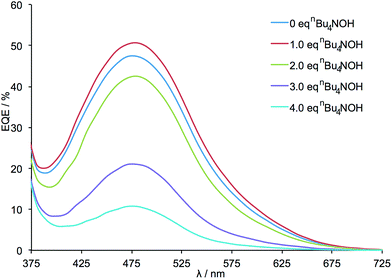 | ||
| Fig. 3 EQE spectra for the DSCs listed in Table 1. All measurements were made on the day of DSC fabrication. | ||
Encouraged by these results, we decided to investigate the effects of other bases. FTO/TiO2 electrodes were sequentially exposed to mixtures of NaOH and H41, followed by a solution of [Cu(2)2][PF6]. As with nBu4NOH, electrodes treated with NaOH became paler in colour the more base that was added to the dye bath. DSCs incorporating these electrodes exhibited the same trends in photoconversion efficiency as described above (Fig. 4, see Table S2 for DSC parameters, Fig. S3 for J–V curves and Fig. S4† for EQE curves). This suggested that the trends in DSC efficiency may be attributed to the hydroxide ion and were not significantly influenced by the counterion. It should be noted that while the formation of a precipitate was observed in solutions with ≥3 equivalents of NaOH, indicating the limited solubility of [Na]4−n[Hn1] salts in DMSO at higher pH, sufficient ligand remains in solution to provide some degree of TiO2 functionalization.
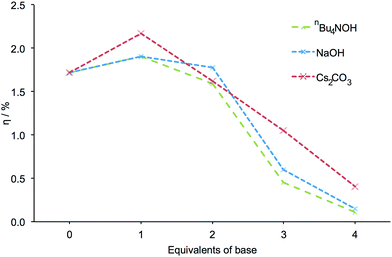 | ||
| Fig. 4 The influence of different bases on the measured efficiency of DSCs. All efficiencies were measured on the day of cell fabrication. Equivalents of base are with respect to H41. | ||
The effects of using Cs2CO3 as base were then investigated. The dye-assembly procedure was as in Fig. 1 with Cs2CO3 replacing nBu4NOH. Analogous trends in DSC efficiencies were observed when the pre-treatment of the electrodes was carried out using Cs2CO3 (Fig. 4). DSC parameters are presented in Table S3, J–V curves in Fig. S5 and EQE curves in Fig. S6.† The addition of 1 equivalent of Cs2CO3 led to a striking 26% increase in cell efficiency (from η = 1.72 to 2.17% versus 6.25% for N719, Table S3†) relative to a cell in which H41 is untreated with a base. As with the sodium salts of H41, a precipitate was observed at high pH in DMSO with the caesium salts.
NMR spectroscopic titration studies of H41 deprotonation
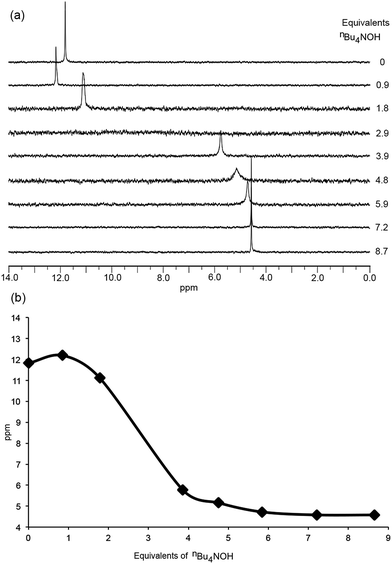
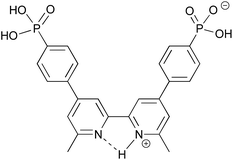
Grätzel and co-workers have investigated the acid dissociation processes of [2,2′:6′,2′′-terpyridin]-4′-ylphosphonic acid (tpyPO(OH)2), and have shown that the neutral compound is present in D2O solution as a zwitterion.26 Both the 1H and 31P NMR spectra of tpyPO(OH)2 were highly sensitive to changes in pH.26 To better understand the protonation state of [Hn1]n−4 (n = 0–4) at a given ratio of H41: base, the addition of nBu4NOH to a solution of H41 in DMSO-d6 was monitored by NMR spectroscopy. Changes in the chemical shifts of signals in both the 1H and 31P NMR spectra as a function of the base added were informative, as were the relative integrals of the resonances of the protons of the [nBu4N]+ ions to the aromatic signals of [Hn1]n−4.The 31P NMR spectra in Fig. 5 illustrate two distinct changes, one accompanied by a shift in the 31P NMR resonance to lower frequency and one by a shift to higher frequency. The neutral H41 (prior to the addition of nBu4NOH) exhibits a 31P NMR signal at δ + 11.8 ppm. The first equivalent of nBu4NOH causes a shift to higher frequency to δ + 12.2 ppm (Fig. 5a) but this is not consistent with deprotonation of the phosphonic acid groups.26,33 Rather, the data suggest that deprotonation occurs from an initially protonated 2,2′-bipyridine (bpy) domain. This in turn implies that H41 is initially present in a zwitterionic form, with a cis-configuration being likely due to hydrogen bond formation as shown in Scheme 3.34 The single crystal structure of the related compound 2,2′-bipyridinyl-5,5′-diphosphonic acid has confirmed a zwitterion with the bpy in a cis-configuration.35 Formation of a zwitterion for H41 is consistent with the relative pKa values of the bpy and phosphonic acid units, estimated from values of pKa = 4.4 for [Hbpy]+,36 and pKa(1) = 1.86 for PhPO(OH)2.37 As further nBu4NOH (up to ca. 5 eq.) is added, a shift to lower frequency in the 31P NMR signal is detected (Fig. 5a) as expected for deprotonation of the phosphonic acid or hydrogenphosphonate units.26,33Fig. 5a shows the broadening of the 31P NMR signal and its disappearance after the addition of 2.9 eq. of nBu4NOH, indicating exchange on the NMR timescale involving the two partially deprotonated phosphonate groups. A gradual shift to lower frequency is observed between 5 and 7 equivalents of nBu4NOH before finally becomes constant (Fig. 5b). This trend parallels that observed by Grätzel and co-workers for the pH dependence of [2,2′:6′,2′′-terpyridin]-4′-ylphosphonic acid.26
In the 1H NMR spectra (Fig. 6), similar trends which can be interpreted in terms of deprotonation of an [Hbpy]+ unit or phosphonic acid were observed. Upon addition of the first equivalent of nBu4NOH, the 1H NMR signals arising from protons HA3, HA5 and HB2 (see Scheme 2 for atom labelling) shift to lower frequency, consistent with deprotonation of zwitterionic H41. The chemical shift of phenyl proton HB3 on the other hand shows little change; this proton is remote from the bpy domain but is close to the phosphonic acid. The addition of further nBu4NOH causes the chemical shifts of all resonances to shift to lower frequencies (Fig. 6). The chemical shift of the methyl group follows an analogous trend to protons HA3, HA5 and HB2 (see Fig. S7† for titration curves).
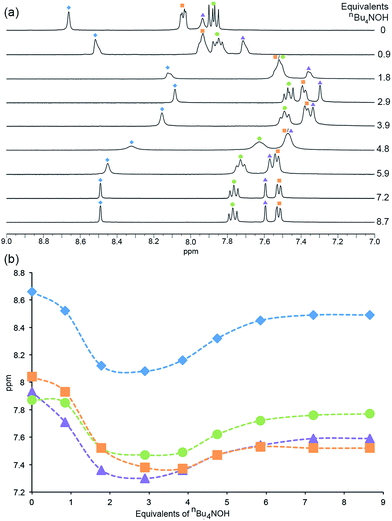 | ||
| Fig. 6 (a) 1H NMR (DMSO-d6, 298 K) spectra recorded during the addition of nBu4NOH to a solution of H41. (b) The chemical shift of the aromatic protons as a function of number of equivalents of nBu4NOH added. Blue diamonds = HA3, orange squares = HB2, purple triangles = HA5, green circles = HB3 (see Scheme 2 for atom labelling). | ||
The data are fully consistent with the parent anchoring ligand in DMSO solution existing as a zwitterion (Scheme 3). Although the solution studies cannot be extrapolated to the surface-bound ligand, the initial presence of the anchoring ligand in a zwitterionic form followed by deprotonation of the [Hbpy]+ upon addition of base may explain the enhanced DSC efficiency on going from 0 to 1 equivalent of base (Table 1). The deprotonation step frees the bpy chelating site for coordination to copper(I), thereby allowing more heteroleptic dye to assemble on the electrode (Fig. S1†, 0 to 1 equivalent of base). The amount of dye on the TiO2 surface is optimal after the addition of 1 equivalent of base. After 2 or more equivalents of base have been added, successive deprotonations of the phosphonic acids lead to an increase in the negative charge of the ligand. The solid-state absorption spectra (Fig. S1,† >3 equivalents of base) suggest that this leads to the desorption of the dye (or of dye components) from the substrate.
Base pre-/post-treatment of H41 functionalised electrodes
We next investigated the effects of pre-treating the TiO2 surface with base, prior to absorption of the anchoring ligand. Table 2 summarizes DSC performance data for cells without treatment with base, cells in which the surface-bound anchoring ligand was treated with base, and DSCs in which the working electrode was pre-treated with base. In comparison to DSCs assembled without exposing the electrode to nBu4NOH (Table 2, entry 1), electrodes pre-treated with a base (Table 2, entry 2) gave a lower efficiency. This primarily results from a lower fill factor, there being little change in either VOC or JSC (see Fig. S8†). Decreases in FF are normally associated with current leakage from the cell, suggesting that exposure of the unfunctionalized TiO2 to nBu4NOH leads to its degradation. The best DSC performance is observed when the FTO/TiO2 electrode is functionalized with H41 followed by treatment with base (Table 2, entry 3). The enhanced DSC efficiency is primarily a result of an increase in JSC. It therefore appears that rather than modification of the TiO2 surface through exposure to a base, it is the first deprotonation step of anchoring ligand H41 that is the main driving force for the increased DSC efficiency.| Dipping step 1 | Dipping step 2 | Dipping step 3 | J SC | V OC | FF | η | Rel. η |
|---|---|---|---|---|---|---|---|
| H41 | [Cu(2)2][PF6] | — | 4.48 | 522 | 70 | 1.64 | 26.2 |
| n Bu4NOH | H41 | [Cu(2)2][PF6] | 4.49 | 534 | 56 | 1.34 | 21.4 |
| H41 | n Bu4NOH | [Cu(2)2][PF6] | 5.35 | 529 | 67 | 1.91 | 30.6 |
Electrochemical impedance spectroscopy (EIS)
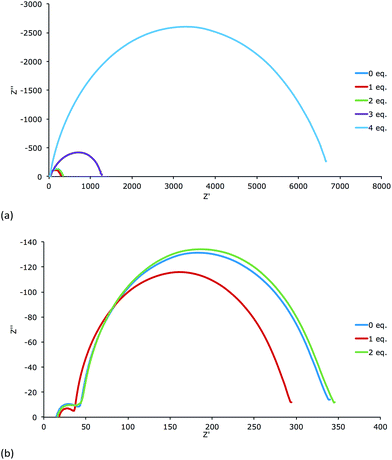
Electrochemical impedance spectroscopy (EIS) has become an important technique to investigate the electrochemical properties of copper(I) DSCs.38–40 By fitting the measured data with an appropriate equivalent circuit model, parameters including the recombination resistance (Rrec), transport resistance (Rtr) and chemical capacitance (Cμ) can be extracted. The EIS data are usually displayed in a Nyquist plot. Ideally, a Nyquist plot consists of three semicircles (Fig. 7), but these may overlap depending upon their relative sizes. The value of the intercept on the abscissa of the first semicircle which arises from the cathode/electrolyte charge transfer resistance (RPt, Fig. 7) corresponds to the series resistance (Rs). The latter mainly arises from the charge transfer resistance of the TiO2/FTO interface. The value of Rrec determines the second semicircle. When an I−/I3− redox couple is used in the electrolyte, the third semicircle at low frequencies corresponding to the diffusion resistance of the charge carrier particles in the electrolyte (Rd) is barely visible. The equivalent circuit model used here to fit the EIS data (Fig. 8) consisted of a series resistance (Rs), an extended distributed element (DX) in order to fit the transport resistance (Rtr) as well as the recombination resistance (Rrec) of the highly porous semiconductor/dye/electrolyte interface. A Warburg diffusion element (Ws) was added to model the diffusion impedance of the charge carrier particles in the electrolyte and a Randles-type circuit that characterizes the electrolyte/Pt/FTO interface.38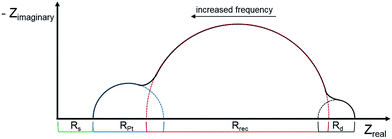 | ||
| Fig. 7 Schematic representation of an ideal Nyquist plot of a DSC with three semicircles representing the different resistances in a DSC. | ||
The following discussion concentrates on the EIS results of DSCs containing of the anchoring ligand H41 treated with different equivalents of nBu4NOH (as previously explained) followed by the homoleptic complex [Cu(2)2][PF6]. EIS parameters were measured for DSCs 3 days after assembling.
EIS measurements
All DSCs were measured with a light intensity of 22 mW cm−2 or 2.2 mW cm−2. The Nyquist plots of the measurements (Fig. 9 and S9†) demonstrate that the electrodes dipped in a solution with 3 or 4 equivalents of base have much higher Rrec than those treated with 0, 1 or 2 equivalents of base. As seen in Table 1, they also perform worse (η = 0.63% or 0.21% for 3 or 4 equivalents) with respect to the cells treated with 0, 1 or 2 equivalents (η = 1.72%, 1.97% or 1.65%). Table 3 displays the EIS parameters of the DSCs measured at a light intensity of 22 mW cm−1.A satisfying fit for the EIS data for the DSCs treated with 3 or 4 equivalents of base could not be obtained. However, values of Rrec and Cμ were estimated with the fitting program ZView®. Nevertheless, it is clear that the low capacitance of these cells demonstrates the low charge density in the semiconductor. Thus, these cells have the lowest JSC values of all the DSCs. The cells containing electrodes treated with 0, 1 or 2 equivalents of base have a comparable Rrec but significantly different values of Cμ. The DSC corresponding to 1 equivalent of base has the highest Cμ and the one with 2 equivalents the lowest Cμ. This is consistent with the trend in JSC values (Table 1). In order to extract Rtr and the length of diffusion of the charge carriers in the semiconductor (Ld), measurements with a light intensity of 2.2 mW cm−2 were performed (Table 4).
| Equivalents of nBu4NOH with respect to H41 | R rec [Ω] | C μ [μF] | R Pt [Ω] | C Ptμ [μF] | R tr [Ω] | τ [ms] | L d [μm] |
|---|---|---|---|---|---|---|---|
| a Not fitted. b Estimated with ZView®. | |||||||
| 0 | 1329.0 | 196.3 | 16.0 | 10.1 | 129.1 | 260.9 | 38.5 |
| 1 | 1259.0 | 243.3 | 14.2 | 18.7 | 42.9 | 306.3 | 65.0 |
| 2 | 1285.0 | 152.8 | 6.8 | 11.6 | 241.5 | 196.3 | 27.7 |
| 3 | 9750b | 10b | ---a | ---a | ---a | ---a | ---a |
| 4 | 43![[thin space (1/6-em)]](https://www.rsc.org/images/entities/char_2009.gif) 500b 500b |
8b | ---a | ---a | ---a | ---a | ---a |
The best performing cell has also the lowest Rtr and the trend also corresponds to the performance of the DSCs (Table 1). The lower the Rtr, the better the transport of the charge carriers in the semiconductor. This can also be observed in the Ld values. The DSC in which the anchoring ligand was treated with 1 equivalent of base has the highest Ld (65.0 μm, see Table 4). That is over 5 times the thickness of the semiconductor (∼12 μm) and evidences good transport of charge carriers in the semiconductor. A higher lifetime of the charge carrier (τ) also implies a lower charge loss in the semiconductor. Hence, treatment of surface-bound H41 with 1 equivalent of base leads to a DSC with the highest lifetime of all fitted DSCs independent on the light intensity. With the highest Cμ, the lowest Rtr, the highest τ, a very good Ld and a moderate Rrec, this DSC shows the best EIS values and also the best performance of all measured DSCs.
Solubility studies
Previous studies have demonstrated that the choice of solvent used during dye assembly on TiO2 surfaces can significantly influence the resultant properties of the DSC.41 However, the limited solubility of H41 in solvents other than DMSO has hindered investigations in this regard. [nBu4N]4−n[Hn1] salts on the other hand are more readily soluble than H41 in a variety of solvents, and hence deprotonation of the anchoring ligand with [nBu4N]OH serves as an effective means to adjust its solubility. To demonstrate this, electrodes were functionalized with either H41 or [nBu4N]4−n[Hn1] (generated by the addition of nBu4NOH to H41) using EtOH, H2O, or CH2Cl2 in place of DMSO, followed by exposure to a solution of [Cu(2)2][PF6] to form the heteroleptic dye [Cu(Hn1)(2)]n−3 as previously described. The DSCs show a significant increase in efficiency when employing the [nBu4N]4−n[Hn1] salts as opposed to H41 (Table 5, see Fig. S10† for J–V curves). This is attributed to the enhanced solubility of the salts affording a higher concentration of the anchoring ligand available to adsorb onto the TiO2 surface. It should be noted that these results (including Table 1, entry 2) indicate that the choice of solvent used for functionalization of TiO2 with [nBu4N]4−n[Hn1] has little influence over the properties of the resultant DSC.| Solvent | Equivalents of nBu4NOH with respect to H41 | J SC [mA cm−2] | V OC [mV] | FF [%] | η [%] | Rel. η [%] |
|---|---|---|---|---|---|---|
| EtOH | 0 | 0.72 | 423 | 71 | 0.21 | 3.4 |
| EtOH | 1 | 5.34 | 556 | 67 | 1.97 | 31.5 |
| H2O | 0 | 0.92 | 437 | 71 | 0.29 | 4.6 |
| H2O | 1 | 5.36 | 560 | 66 | 1.97 | 31.5 |
| CH2Cl2 | 0 | 0.12 | 367 | 68 | 0.03 | 0.5 |
| CH2Cl2 | 1 | 3.91 | 564 | 67 | 1.47 | 24.5 |
Conclusions
The development of more efficient sensitizers with panchromatic light absorption, large absorption coefficients, and longer excited state lifetimes is important for improving DSC efficiency. Dye anchoring must also be optimized. This can include strengthening the binding of the dye to the surface, aiding electron transport to the TiO2 and controlling the surface potential through the transfer of protons from the anchoring group. We have demonstrated that proton transfer within the dye molecule is an additional factor and can be addressed by ligand deprotonation which, in turn, influences metal-ion binding. We have determined through NMR titration studies that anchoring ligand H41 exists as a zwitterion in its parent state and treatment with 1 equivalent of nBu4NOH initially deprotonates an [Hbpy]+ moiety generating a bpy metal-binding domain. Compared to DSCs in which the sensitizer was assembled using the parent anchor H41, those in which 1 equivalent of a base was added to H41 showed up to a 26% increase in photoconversion efficiency. This increase results from both increased JSC and VOC (an increase in EQEmax is also observed) and we propose that the enhanced availability of the bpy metal-binding domain increases the amount of dye assembled on the surface. We have also demonstrated that [nBu4N]4−n[Hn1] is more readily soluble than H41 in a range of solvents, and thus the conversion of neutral anchoring ligands to salts can be an effective method of enhancing their solubility. This may be of interest when optimizing the choice of solvent used in the anchoring step, or when investigating ligands with limited solubility in common solvents.Conflicts of interest
There are no conflicts to declare.Acknowledgements
We acknowledge the Swiss National Science Foundation (Grant numbers 200020_162631 and IZKSZ2_162232), the Swiss Nano Institute (for the purchase of the EIS instrument) and the University of Basel for financial support.References
- B. O'Regan and M. Grätzel, Nature, 1991, 353, 737 CrossRef.
- M. Grätzel, Acc. Chem. Res., 2009, 42, 1788 CrossRef PubMed.
- L. Zhang and J. M. Cole, ACS Appl. Mater. Interfaces, 2015, 7, 3427 CAS.
- Y. Bai, I. Mora-Seró, F. De Angelis, J. Bisquert and P. Wang, Chem. Rev., 2014, 114, 10095 CrossRef CAS PubMed.
- E. Galoppini, Coord. Chem. Rev., 2004, 248, 1283 CrossRef CAS.
- A. Mishra, M. K. R. Fischer and P. Bäuerle, Angew. Chem., Int. Ed., 2009, 48, 2474 CrossRef CAS PubMed.
- A. Hagfeldt, G. Boschloo, L. Sun, L. Kloo and H. Pettersson, Chem. Rev., 2010, 110, 6595 CrossRef CAS PubMed.
- K. S. Finnie, J. R. Bartlett and J. L. Woollfrey, Langmuir, 1998, 14, 2744 CrossRef CAS.
- M. Wagstaffe, A. G. Thomas, M. J. Jackman, M. Torres-Molina, K. L. Syres and K. Handrup, J. Phys. Chem. C, 2016, 120, 1693 CAS.
- S. G. Yan and J. T. Hupp, J. Phys. Chem., 1996, 100, 6867 CrossRef CAS.
- H. Gerischer, Electrochim. Acta, 1989, 34, 1005 CrossRef.
- J. M. Bolts and M. S. Wrighton, J. Phys. Chem., 1976, 80, 2641 CrossRef CAS.
- T. Watanabe, A. Fujishima and K. Honda, Bull. Chem. Soc. Jpn., 1976, 49, 8 CrossRef CAS.
- D. Cahen, G. Hodes, M. Grätzel, J. F. Guillemoles and I. Riess, J. Phys. Chem. B, 2000, 104, 2053 CrossRef CAS.
- K. Wu, K. Shen, Y. Yu and D. Wang, Chin. J. Chem. Phys., 2012, 25, 733 CrossRef.
- Z.-S. Wang and G. Zhou, J. Phys. Chem. C, 2009, 113, 15417 CAS.
- D. F. Watson, A. Marton, A. M. Stux and G. J. Meyer, J. Phys. Chem. B, 2004, 108, 11680 CrossRef CAS.
- S. Pelet, J.-E. Moser and M. Grätzel, J. Phys. Chem. B, 2000, 104, 1791 CrossRef CAS.
- M. K. Nazeeruddin, S. M. Zakeeruddin, R. Humphry-Baker, M. Jirousek, P. Liska, N. Vlachopoulos, V. Shklover, C.-H. Fischer and M. Grätzel, Inorg. Chem., 1999, 38, 6298 CrossRef CAS PubMed.
- M. K. Nazeeruddin, R. Humphry-Baker, P. Liska and M. Grätzel, J. Phys. Chem. B, 2003, 107, 8981 CrossRef CAS.
- C. E. Housecroft and E. C. Constable, Chem. Soc. Rev., 2015, 44, 8386 RSC.
- B. Bozic-Weber, S. Y. Brauchli, E. C. Constable, S. O. Fürer, C. E. Housecroft, F. J. Malzner, I. A. Wright and J. A. Zampese, Dalton Trans., 2013, 42, 12293 RSC.
- B. Bozic-Weber, E. C. Constable, C. E. Housecroft, P. Kopecky, M. Neuburger and J. A. Zampese, Dalton Trans., 2011, 40, 12584 RSC.
- B. Bozic-Weber, V. Chaurin, E. C. Constable, C. E. Housecroft, M. Meuwly, M. Neuburger, J. A. Rudd, E. Schönhofer and L. Siegfried, Dalton Trans., 2012, 41, 14157 RSC.
- P. Péchy, F. P. Rotzinger, M. K. Nazeeruddin, O. Kohle, S. M. Zakeeruddin, R. Humphry-Baker and M. Grätzel, J. Chem. Soc., Chem. Commun., 1995, 65 RSC.
- M. K. Nazeeruddin, S. M. Zakeeruddin, R. Humphry-Baker, T. A. Kaden and M. Grätzel, Inorg. Chem., 2000, 39, 4542 CrossRef CAS.
- B. Bozic-Weber, S. Y. Brauchli, E. C. Constable, S. O. Fürer, C. E. Housecroft and I. A. Wright, Phys. Chem. Chem. Phys., 2013, 15, 4500 RSC.
- B. Bozic-Weber, E. C. Constable, S. O. Fürer, C. E. Housecroft, L. J. Troxler and J. A. Zampese, Chem. Commun., 2013, 49, 7222 RSC.
- H. J. Snaith, Energy Environ. Sci., 2012, 5, 6513 Search PubMed.
- H. J. Snaith, Nat. Photonics, 2012, 6, 337 CrossRef CAS.
- The assigned proton-charge relationship applies to the discrete dye complex. The formation of covalent bonds with the TiO2 surface will alter the charge of the dye accordingly.
- A. Zaban, S. Ferrere and B. A. Gregg, J. Phys. Chem. B, 1998, 102, 452 CrossRef CAS.
- M. Peters, L. Siegfried and T. A. Kaden, J. Chem. Soc., Dalton Trans., 1999, 1603 RSC.
- See for example: W. S. Wu, Acta Crystallogr., Sect. E: Struct. Rep. Online, 2011, 67, o2070 Search PubMed; A. D. Burrows, R. W. Harrington and M. F. Mahon, Acta Crystallogr., Sect. C: Cryst. Struct. Commun., 1999, 55, 1921 Search PubMed; E. C. Constable, C. E. Housecroft, M. Neuburger, P. Rösel, G. E. Schneider, J. A. Zampese, F. Monti, N. Armaroli, R. D. Costa and E. Orti, Inorg. Chem., 2013, 52, 885 CrossRef CAS PubMed.
- C. Köhler and E. Rentschler, Dalton Trans., 2016, 45, 12854 RSC.
- A. Moissette, Y. Batonneau and C. Brémard, J. Am. Chem. Soc., 2001, 123, 12325 CrossRef CAS PubMed.
- Metal Phosphonate Chemistry: From Synthesis to Applications, ed. A. Clearfield and K. Demadis, RSC Publishing, 2011, ch. 5, p. 166 Search PubMed.
- F. J. Malzner, C. E. Housecroft, E. C. Constable and M. Willgert, J. Mater. Chem. A, 2017, 5, 4671 CAS.
- S. O. Fürer, B. Bozic-Weber, T. Schefer, C. Wobill, E. C. Constable, C. E. Housecroft and M. Willgert, J. Mater. Chem. A, 2016, 4, 12995 Search PubMed.
- F. J. Malzner, M. Willgert, E. C. Constable and C. E. Housecroft, J. Mater. Chem. A, 2017, 5, 13717 CAS.
- S. Y. Brauchli, B. Bozic-Weber, E. C. Constable, N. Hostettler, C. E. Housecroft and J. A. Zampese, RSC Adv., 2014, 4, 34801 RSC.
Footnote |
| † Electronic supplementary information (ESI) available: Complete tables of DSC data for duplicate cells; additional J–V curves, EQE spectra and Nyquist plots. See DOI: 10.1039/c7se00586e |
| This journal is © The Royal Society of Chemistry 2018 |

