 Open Access Article
Creative Commons Attribution 3.0 Unported Licence
Synergistic relationship between the three-dimensional nanostructure and electrochemical performance in biocarbon supercapacitor electrode materials†
Dina Ibrahim
Abouelamaiem
 a,
Guanjie
He
 b,
Ivan
Parkin
 b,
Tobias P.
Neville
 ac,
Ana Belen
Jorge
 d,
Shan
Ji
 e,
Rongfang
Wang
 f,
Maria-Magdalena
Titirici
 g,
Paul R.
Shearing
 a and
Daniel J. L.
Brett
 *a
*a
aElectrochemical Innovation Lab, Department of Chemical Engineering, University College London, London, WC1E 7JE, UK. E-mail: d.brett@ucl.ac.uk
bChristopher Ingold Laboratory, Department of Chemistry, University College London, London, WC1H 0AJ, UK
cCentre for Nature Inspired Engineering, Dept. Chemical Engineering, University College London, London, WC1E 7JE, UK
dCentre of Functional Nanomaterials, Queen Mary University of London, London, E1 4NS, UK
eCollege of Biological, Chemical Sciences and Engineering, Jiaxing University, 314001, China
fQingdao University of Science and Technology, Institute of Chemical Engineering, Qingdao, China
gMaterials Research Institute, School of Engineering and Materials Science, Queen Mary University of London, London, E1 4NS, UK
First published on 4th January 2018
Abstract
A novel study presented herein correlates the multidimensional morphology with the electrochemical performance of activated bio-carbon materials, for supercapacitor devices over multiple length scales. The optimization of the potassium hydroxide (KOH)/cellulose ratio for supercapacitor electrode materials is related to morphological characteristics and corresponding electrochemical performance, as described in terms of porosity, specific surface area, specific capacitance and electrochemical impedance. KOH/cellulose samples with ratios 0.5![[thin space (1/6-em)]](https://www.rsc.org/images/entities/char_2009.gif) :
:![[thin space (1/6-em)]](https://www.rsc.org/images/entities/char_2009.gif) 1 and 1
1 and 1![[thin space (1/6-em)]](https://www.rsc.org/images/entities/char_2009.gif) :
:![[thin space (1/6-em)]](https://www.rsc.org/images/entities/char_2009.gif) 1 exhibited the best performance, characterized by a hierarchal porous network structure, high surface area and low cell resistance. Compared with the rest of the manufactured samples and commercial activated carbons, Ketjen Black (KB), Norit activated carbon (NAC) and bead-shaped activated carbon (BAC), the former two samples showed better results in three-electrode systems and coin cells, with specific gravimetric capacitances as high as 187 F g−1 at a current density of 1 A g−1. The high performance is attributed to the morphology of the samples that constituted a combination of micro-, meso- and macroporosity which consequently gave high specific surface area, high porosity, low cell resistance and high specific capacitance. This further corroborates the structure-performance relationship observed in the author's model KOH/cellulose system, highlighting that the work can be extended to other similar systems. It is clear that the three-dimensional nanostructure of a material must be understood in its entirety in order to optimize the electrochemical performance.
1 exhibited the best performance, characterized by a hierarchal porous network structure, high surface area and low cell resistance. Compared with the rest of the manufactured samples and commercial activated carbons, Ketjen Black (KB), Norit activated carbon (NAC) and bead-shaped activated carbon (BAC), the former two samples showed better results in three-electrode systems and coin cells, with specific gravimetric capacitances as high as 187 F g−1 at a current density of 1 A g−1. The high performance is attributed to the morphology of the samples that constituted a combination of micro-, meso- and macroporosity which consequently gave high specific surface area, high porosity, low cell resistance and high specific capacitance. This further corroborates the structure-performance relationship observed in the author's model KOH/cellulose system, highlighting that the work can be extended to other similar systems. It is clear that the three-dimensional nanostructure of a material must be understood in its entirety in order to optimize the electrochemical performance.
1. Introduction
The rapidly developing global economy, depletion of fossil fuels and increasing environmental challenges call for alternative and more sustainable energy sources.1 Electrochemical energy conversion and storage devices, in the form of batteries, fuel cells and supercapacitors, offer the benefits of high efficiency, flexibility and wide applicability, which can be partnered with intermittent renewable energy generation capacity to provide secure, low-carbon electricity supply.2 Electrochemical capacitors (EC), also referred to as ultra-capacitors or supercapacitors, have the advantage of high power density, operation over a wide range of temperatures and long cycle lives.3,4 However, these benefits are off-set by a number of drawbacks that include low energy densities, high self-discharge rates and low working potential window. Different electrode materials consisting of faradaic and non-faradaic capacitance as well as different electrolyte systems have been proposed to overcome these shortcomings.3–6One of the biggest challenges in developing ECs is the compromise between the use of low-cost and readily-available materials and the prominent requirements for delivering high performance and durability.7 Activated carbons have been extensively used as supercapacitor electrode materials and can be complemented with pseudocapacitive materials (ruthenium oxide and manganese oxide being the most popular) to achieve high specific power and energy. The majority of available carbon materials are chemically and/or physically activated, starting with carbonaceous organic precursors and ‘engineered’ to exhibit different attributes.8–13 The physical activation constitutes the pre-treatment of raw carbon materials at high temperatures ranging between 700 °C and 1200 °C under oxidizing conditions like air, steam or CO2. As for chemical activation, the process is generally carried put at lower temperatures (400–700 °C) using an activating agent (potassium hydroxide, phosphoric acid, and sodium hydroxide), that tunes the morphology of the carbonized samples. For supercapacitors, desirable properties include high surface area and electrical conductivity as well as an optimised pore network structure that can enhance access of ions to the electrode surface and boost the charge storage capacity at the electrode/electrolyte interface. Certain biocarbon-based materials have shown promise for supercapacitor applications in aqueous electrolytes and have the advantage of low cost and abundance. For example, wood-based raw material were activated in an N2 atmosphere at 1000 °C, followed by a CO2 activation step at 900 °C yielded a maximum specific capacitance value of 72.4 F g−1 at a scan rate of 20 mV s−1.14 In another study, coconut shells were treated in a one-step thermal process, combining pyrolysis at 400 °C and steam activation at different temperatures. It was found that an increase in the activation time and temperature increased the mesoporous contribution in the total pore volume and hence an increase in the specific capacitance values (228 F g−1 at scan rate of 5 mV s−1).15 Bamboo-based carbons activated with KOH were reported to achieve a specific capacitance of 258 F g−1 at a current density of 0.1 A g−1 with 36% retention rate as the current density increased to 5 A g−1.10 As another example, highly porous carbon materials originating from waste coffee beans and treated with ZnCl2 have been reported to achieve a specific capacitance of 368 F g−1 and energy density of 20 W h kg−1 at a current density of 0.05 A g−1.16 Wei et al. used cellulose, potato starch and eucalyptus wood as raw materials to produce microporous carbons that achieved a capacitance of 236 F g−1 at a sweep rate of 1 mV s−1 in symmetric supercapacitor configurations.17 Many activated carbons from biomass have been used in supercapacitor applications yielding different capacitance values in different electrolytes and system configurations,18–26 but a clear understanding between their multiscale porosity-electrochemical performance is still missing. In this study we address this gap in the XYZ dimensional analysis.
Pore sizes can be classified into: (i) micropores (<2 nm), (ii) mesopores (2–50 nm) and (iii) macropores (>50 nm).27 Different studies have proven that surface areas along with the pore size distribution, porosity and presence of certain surface functional groups all affect the final performance of supercapacitors. Different pore sizes influence capacitance in different ways; micropores play a major role under slower kinetic regimes and formation of electrochemical double-layer at low current densities, whereas macropores ensure the wetting of the electrode and fast ion diffusion at higher current densities, which ensures high rate performance. In addition, micropores of pore width less than 0.5 nm are too narrow for electrolyte access, whereas macropores of pore width greater than 50 nm do not contribute to the electrolyte adsorption, but can facilitate its diffusion and therefore electrode wettability during charge and discharge.27,28 The surface morphology and carbon pore structure should be tailored for optimum access to the available surface area, whilst allowing rapid ion transport throughout the pore network. Micropores are of great importance as they boost the charge storage capacity within the adsorption mechanism and hence improve the capacitance, while the meso- and macro-pores are regarded as the ‘accommodators’ for the ions' kinetics.29 Herein, the morphology was studied using different multiscale characterization techniques to investigate the effect of all structural parameters on the electrochemistry in supercapacitor devices.
Activation of carbon, including biocarbon-based materials, with KOH in the temperature range of 700–1200 °C is one of the methods that allow the formation of porous carbons with high electrical conductivities and specific capacitances and the ratio of activating agent to precursor material is known to affect the electrochemical performance and specific capacitance of carbon materials.7,30–35 Here, the manufacture of porous carbons from softwood Kraft pulp for supercapacitor electrodes is considered in the context of the effect of KOH/cellulose ratio on the porous structure and consequently the electrochemical behaviour. An approach is taken that relates form and function, using techniques such as transmission electron microscopy (TEM), nitrogen adsorption–desorption isotherms and X-ray tomography to capture the pore network characteristics at different length scales and establish a correlation to the electrochemical performance.
2. Experimental methods
Softwood Kraft pulp cellulose precursor samples were treated with different ratios of KOH, carbonized and characterized with a suite of techniques to study the sample morphology, porosity and electrochemical performance. They were then compared against a baseline of commercial benchmarks (KB, BAC and NAC).2.1. Materials
Softwood Kraft pulp (α-cellulose > 85%, with raw material from Pinus Silvestris and Picea Abies) was provided by UPM-Kymmene Corporation (Helsinki, Finland). NAC and BAC were provided by CABOT Corporation (Georgia, USA) and KB 600, super C65 and polyvinylidene fluoride (PVDF) were supplied by PIKEM Ltd (Staffordshire, UK) and were used as supplied. Quantitative filter papers of diameters 9 cm and 15 cm and 5–13 μm particle retention and blotting papers were used for the filtration process (VWR, UK). Coin cell ECs were assembled in a CR2032 geometry: activation of the cellulose was achieved using KOH (Fisher Scientific, UK). All electrode materials were deposited on nickel foam current collector (Suzhou JSD Co. Ltd., China) and Whatman glass microfiber filter papers were used as electrical separator materials (Sigma-Aldrich Ltd, UK). The coin cell parts (electrodes, spring, gasket and coin cell testing box) were supplied by Hohsen corporation (Osaka, Japan) and used for two-electrode testing of all activated carbons.2.2 Preparation and carbonization of cellulosic raw materials
The raw pulp material (native cellulose) was cut into one cm2 pieces and dispersed in water to produce 1 wt% cellulose solution at 500 g m−2. The mixture was kept under ambient conditions for 24 hours to ensure the softening of the cellulose material and was then stirred for 2 minutes in a 400 W plug blender (Lloytron, UK). Once homogenised, the mixture was vacuum filtrated through a 9 cm diameter Buchner funnel (Appleton Woods Ltd, UK) using filtration and blotting papers. A two-stage press (Carver Inc., USA) process involved: (i) wet-pressing at room temperature for 5 min and (ii) hot-pressing for 25 min at a pressure of 5000 lbs and 120 °C to guarantee a flat and homogeneous sample throughout. For activation, 10 g of raw paper was impregnated in 50 mL solution of KOH with KOH/cellulose ratios of 0.005, 0.01, 0.1, 0.5, 1, 2 and 3 wt% and soaked for 4 h at 60 °C in air. It was then dried overnight in a vacuum oven at 110 °C and carbonized at 850 °C with a heating ramp of 20 °C min−1 for 2 h under a dry nitrogen atmosphere in a tubular furnace (Vecstar, UK). Similar procedures have been described elsewhere.7,9–11,13,28The ‘chalky’ carbonized samples were washed and filtrated several times to remove any potassium carbonate residues and dried overnight at 80 °C. Hereafter, the obtained carbonized samples with KOH activation will be denoted as KOH-n, where n refers to the KOH/cellulose weight ratio. The yield was calculated according to eqn (1):
 | (1) |
It should be noted that the carbonization temperature was chosen to be 850 °C as lower temperatures proved to yield amorphous structures, while higher temperatures resulted in products containing graphitic fringes with interlayer spacing approaching that of graphite which lead to a decrease in the specific surface area.27Fig. 1 describes the synthesis steps from raw materials to the final carbonized samples used in electrode preparation.
 | ||
| Fig. 1 Schematic illustration of the synthetic procedure of activation and carbonization of precursor cellulose materials. | ||
2.3 Characterization
Elemental analysis of all prepared samples were obtained using Total Carbon and Nitrogen Analyzer with Sulphur Module (TruSpec CN, LECO, USA) to identify the carbon and hydrogen content of the carbon materials. X-ray photoelectron spectroscopy (XPS) was used to determine the oxygen and carbon content of the carbon materials using K-ALPHA Surface Analysis spectrometer (Thermo SCIENTIFIC) with monochromatic Al Kα radiation of 1486.6 eV as an excitation source. The curve fitting and background correction were done using Casa XPS software. Nitrogen adsorption–desorption isotherms were carried out in a 3 Flex Surface and Catalyst Characterization System (Micromeritics, USA) after degassing the samples for 24 hours at 300 °C in a sample degas system (VacPrep 061 Sample Degas System, Micrometrics, USA). The total volumes of the pores of the prepared and benchmark samples were calculated at a relative pressure of P/P0 of 0.99. Specific surface areas (SSA) and micropore volumes were obtained by applying the Brunauer–Emmet–Teller (BET) method and the Non Local Density Functional Theory Method (NLDFT), respectively. The BET SSA was calculated at relative pressure range between 0.001 and 0.2. The mesopore volume was obtained by subtracting the micropore volume from the total pore volume. To study the effect of adding booster carbon (super C65) and binder (PVDF) in the preparation of the electrode materials on the nano-porosity of the activated carbons, nitrogen sorption isotherms were also performed on KOH-0.005 and KOH-0.5 sample.The activated samples were also characterized by CO2 isotherms at 273 K (Autosorb-6, Quantrachrome). The narrow micropore volume with pore diameter <0.7 nm were calculated using the DFT method at relative pressures below 0.025 from the CO2 adsorption isotherms.
Mercury intrusion porosimetry (MIP) (Poremaster, Quantachrome Instruments, USA) was used to detect the pore size distribution and the total pore volume of the carbonized samples in the macropore region. The surface morphology was assessed using scanning electron microscopy (SEM) operating at 10 kV in the secondary electron imaging mode to achieve high-resolution capture of surface morphology (EVO MA10, ZEISS, Germany) and transmission electron microscopy (TEM) at an accelerating voltage of 200 kV (JEOL, JEM-2100, Welwyn, UK). X-ray nano computed tomography (CT) (Xradia 810 Ultra, ZEISS, USA) with Zernike phase contrast was used to image various carbonized samples to calculate the porosity and volume specific interfacial area (VSIA) between the cellulosic fibres and porous media.36,37 The tomographic scan details of the imaged samples are shown in Table 1.
| Scan parameter | KOH-0.1 | KOH-0.5 | KOH-2 |
|---|---|---|---|
| Contrast mode | Phase | Phase | Phase |
| X-ray energy (keV) | 5.4 | 5.4 | 5.4 |
| Field of view (FOV) | Large FOV | Large FOV | Large FOV |
| Number of projections | 1901 | 1801 | 1401 |
| Radiograph exposure time (s) | 28 | 40 | 70 |
| Camera binning | 1 | 1 | 1 |
Transmission images of the three scans were reconstructed using Zeiss XMReconstructor software, which uses a proprietary parallel beam filtered back projection algorithm. Avizo software package (version 9.2. FEI, VSG) was used for segmentation of the solid and pore phases, volume visualisation and image processing. The carbon phase was segmented based on its higher grey-scale value and saved as a binary TIFF file, and the pore phase was separated from the solid phase using non-local means filtration and threshold segmentation. 3D reconstructed images and corresponding grey-scale and binary ortho-slices of each sample were created and segmented 3D TIFF image files were processed for quantification and characterisation. The TauFactor software plug-in for MATLAB38 was applied directly on the resulting voxel grid to calculate the tortuosity factors of the activated samples based on a uniform shrink representative volume analysis.
2.4 Electrochemical measurements
Electrochemical measurements were carried out in three-electrode systems and coin cells connected to a potentiostat (Interface 1000, Gamry Instruments, USA). The three-electrode measurements were performed in 6 M KOH electrolyte solution using a platinum mesh counter electrode and silver/silver chloride (Ag/AgCl) reference electrode (Tianjin AiDaHengSheng Technology Development co. Ltd., China). The working electrodes were prepared with 85% activated carbon, 5% Super C65 and 10% PVDF. The mixture was then mixed and drop-casted on nickel foam to give a final mass between 2 and 3 mg of activated carbon across a physical surface area of 1 cm2. Cyclic voltammetry (CV) at scan rates between 1 and 200 mV s−1 were performed along with galvanostatic charge discharge (GCD) at current densities of 0.5–20 A g−1. Cyclic voltammetry in the three-electrode configurations was used to infer the positive and negative potential limits to determine the stability (S-value) as follows: | (2) |
 | (3) |
The Q-value corresponds to the charge and discharge from negative and positive current incurred by one separate polarization, respectively.39,40
The cycling test was complimented with a float test in which the potential of the electrode in the three-electrode configuration was held at a nominal voltage value and the capacitance was determined by occasional charge/discharge cycles. This test confirms the duty cycles for feasibility of these materials in real-life applications, whereby the capacitor might be needed as backup device.41,42 The capacitance was evaluated from the three cycles applied at a current density of 0.5 A g−1 every 10 h of voltage hold.
Potentiostatic electrochemical impedance spectroscopy (EIS) was performed in a frequency range between 0.1 Hz and 1 MHz at open circuit voltage (OCV) with sinusoidal signal of 5 mV amplitude. The specific capacitances were calculated from the GCD curves and the resistances were inferred from the impedance curves. iR drop, product of current (i) and resistance (R), is defined as the potential difference between two conducting phases during a current flow and can be also inferred from GCD curves. Electrode materials in coin cells were prepared in a similar manner to that of the three-electrode system and glassy fibres were used as separators between the electrodes/current collectors. CV, GCD and EIS tests were performed in the two-electrode configuration in 6 M KOH solution. A voltage hold test of the best performing carbon material was conducted in the two-electrode cell at which a critical voltage was applied to the full cell. The capacitance evaluated every 10 h by the occasion cycling at a constant current of 0.5 A g−1.
3. Results and discussion
3.1. Pore texture and surface morphology characterization of electrode materials
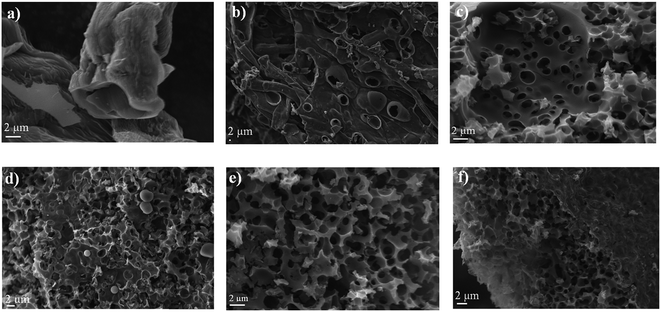
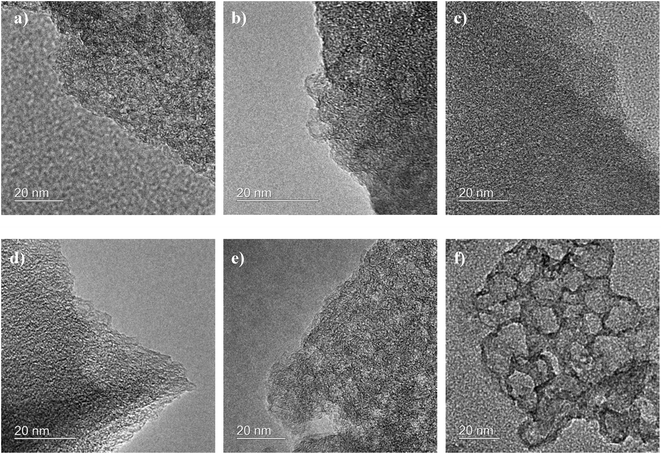
To investigate the pore morphology and size distribution among the different commercial activated carbons and prepared samples, SEM, TEM, nitrogen adsorption/desorption isotherms, BET specific area and MIP were performed. Fig. 2, 3 and S2† show the SEM and TEM images of the carbonized samples with different KOH/cellulose ratios and commercial carbons. Compared to commercial activated carbons, the KOH/cellulose materials showed a ‘spongy’ morphology that increased with increasing KOH content. BAC shows a high mesoporosity while the morphology of NAC displays high microporosity (Fig. S2†) which yield high specific surface area in both commercial materials (Table 2). However, Ketjen Black is a mesoporous activated carbon with low microporosity and the sponge-like structure is also shown in Fig. S2.†| Sample | Bulk density (g cm−3) | BET (m2 g−1) | Total pore volume (N2) (cm3 g−1) | Micropore volume (cm3 g−1) | Mesopore volume (cm3 g−1) |
|---|---|---|---|---|---|
| BAC | 0.33 | 1140 | 0.44 | 0.2 | 0.24 |
| NAC | 0.19 | 1466 | 0.74 | 0.2 | 0.54 |
| KB | 0.12 | 1396 | 1.39 | 0.09 | 1.3 |
| CC | 0.38 | 11 | 0.008 | 0 | 0.008 |
| KOH-0.005 | 0.32 | 252 | 0.16 | 0.05 | 0.11 |
| KOH-0.01 | 0.21 | 598 | 0.28 | 0.17 | 0.11 |
| KOH-0.1 | 0.25 | 717 | 0.34 | 0.18 | 0.16 |
| KOH-0.5 | 0.13 | 1351 | 0.55 | 0.34 | 0.21 |
| KOH-1 | 0.06 | 1063 | 0.47 | 0.3 | 0.17 |
| KOH-2 | 0.05 | 1579 | 0.59 | 0.39 | 0.2 |
| KOH-3 | 0.03 | 785 | 0.43 | 0.07 | 0.36 |
At the KOH/cellulose ratios of 0.5 and 1, the KOH etching process resulted in a hierarchal porous network structure. The fibrous structure of unactivated carbonized cellulose (CC) gradually transforms into microporous etched fibres upon increasing the KOH loading to 0.01 and 0.1 (Fig. 2a and b). As the KOH proportion is further increased, the fibrous texture converts into a more porous form. A wide pore size distribution across the micro-, meso- and macropore size ranges was attained once the KOH/cellulose ratio was set at 0.5 and 1. The combination of the SEM (Fig. 2c and d) and TEM images (Fig. 3d and e) show that the different ranges of pore sizes has been achieved at the 0.5![[thin space (1/6-em)]](https://www.rsc.org/images/entities/char_2009.gif) :
:![[thin space (1/6-em)]](https://www.rsc.org/images/entities/char_2009.gif) 1 and 1
1 and 1![[thin space (1/6-em)]](https://www.rsc.org/images/entities/char_2009.gif) :
:![[thin space (1/6-em)]](https://www.rsc.org/images/entities/char_2009.gif) 1 KOH/cellulose samples. The hierarchical porous network structure gave rise to a substantial increase in the BET specific surface area but decrease in the micropore volume fraction as more mesopores have been formed. At higher KOH/cellulose ratios, the macropores dominated and the ‘spongy’ nature of the material evolved (Fig. 2e and f and 3f). There was a decrease in the specific surface area at high KOH loadings (2
1 KOH/cellulose samples. The hierarchical porous network structure gave rise to a substantial increase in the BET specific surface area but decrease in the micropore volume fraction as more mesopores have been formed. At higher KOH/cellulose ratios, the macropores dominated and the ‘spongy’ nature of the material evolved (Fig. 2e and f and 3f). There was a decrease in the specific surface area at high KOH loadings (2![[thin space (1/6-em)]](https://www.rsc.org/images/entities/char_2009.gif) :
:![[thin space (1/6-em)]](https://www.rsc.org/images/entities/char_2009.gif) 1 and 3
1 and 3![[thin space (1/6-em)]](https://www.rsc.org/images/entities/char_2009.gif) :
:![[thin space (1/6-em)]](https://www.rsc.org/images/entities/char_2009.gif) 1 KOH/cellulose ratios).
1 KOH/cellulose ratios).
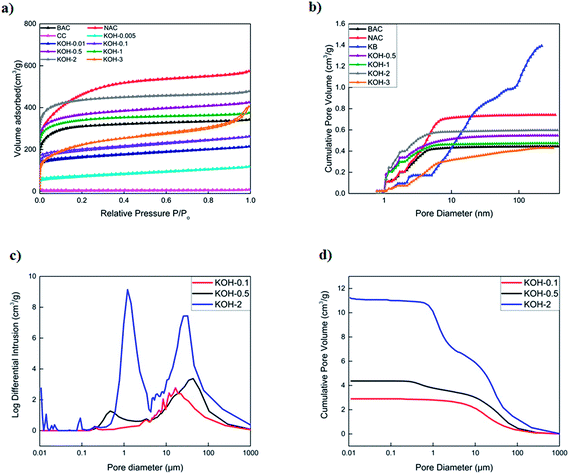
The N2 adsorption–desorption isotherms of activated carbons are shown in Fig. 4a and b in which all samples (excluding KB) display a type I isotherm characteristic of a microporous solid. It is clear that increasing the KOH ratio increases the total pore volume until the optimum is reached, after which it decreases due to the formation of macropores. Both KOH-0.5 and KOH-1 samples display the highest total pore volume composed of very similar micro- and mesopore volume fractions (Fig. S4†). All carbons contain a mesoporous structure (pore diameter > 2 nm) which is clearly shown in Fig. 4b. The total pore volume decreased upon increasing the KOH/cellulose ratio beyond 1![[thin space (1/6-em)]](https://www.rsc.org/images/entities/char_2009.gif) :
:![[thin space (1/6-em)]](https://www.rsc.org/images/entities/char_2009.gif) 1. This is due to the fact of the domination of macroporous structures in KOH-2 and KOH-3 samples and decrease in micropores. KB sample displays a type IV isotherm with a hysteresis loop which is a characteristic feature of capillary condensation on the mesopores (Fig. S4†). BET surface area and total pore volume were obtained using the isotherm data and those of pore size, pore size distribution and micropore volume were calculated using the DFT data evaluation method.
1. This is due to the fact of the domination of macroporous structures in KOH-2 and KOH-3 samples and decrease in micropores. KB sample displays a type IV isotherm with a hysteresis loop which is a characteristic feature of capillary condensation on the mesopores (Fig. S4†). BET surface area and total pore volume were obtained using the isotherm data and those of pore size, pore size distribution and micropore volume were calculated using the DFT data evaluation method.
In addition, different KOH/cellulose mixtures exhibited different mercury cumulative intrusion profiles and interparticle macroporosity. As shown in Fig. 4c and d, the higher KOH/cellulose ratios displayed sharper peaks at different pore sizes in the macropore region and attained higher cumulative intrusion volumes. KOH-0.1 and KOH-0.5 samples had similar profiles whereby both samples exhibited a porous network structure encompassing the different pore size ranges while KOH-2 sample had a wide macropore size distribution with little micro- and mesopore contribution. Total macropore volumes of all activated samples are reported in Table S1.† It should be noted that the calculation of the total mercury intrusion volume requires the deconvolution of the plots obtained as not all peaks refer to the volume intruded in the pores, but might be due to the interparticle porosity.43
It has now become accepted that specific surface areas are not the only factor that govern a good electrochemical performance but also the surface morphology and pore size distribution also play an important role. The samples were also analysed with CO2 physical adsorption to further target the narrow micropore volume with pore sizes smaller than 0.7 nm. However, in-depth studies proved that micropores that accommodate nitrogen adsorption at 77 K can also be available for electro-sorption of hydrated ions such as K+ or OH− at low concentrations due to the similar sizes of the individual atoms and therefore pores with sizes larger than 0.5 nm can be easily accessed by electrolytic solutions.44,45 The volume of CO2 adsorbed in all activated samples is reported in Table S1† and the CO2 adsorption isotherms are shown in Fig. S5.† It is clear that an increase in the micropore volume occurs with an increase in KOH activation. However, since the macroporous volumes also increase with further activation, the total contribution of the micropores decreases as the KOH loading is increased. It is worth noting that the total adsorbed CO2 has drastically dropped in KOH-3 sample which might be attributed to extreme activation conditions of the precursor materials.
In order to study the effect of the additives (binder and booster carbon) in the preparation of the electrode materials, the BET specific surface area and PSD of the activated samples KOH-0.005 and KOH-0.5 with the same PVDF binder and super C65 compositions for EDLC testing have been also measured. Fig. S6† shows that the effect of adding 10 wt% binder and 5 wt% super C65 has different effects on the nano-porosity of each of the activated carbons. A significant difference in the total pore volume and the PSD of KOH-0.005 sample upon the addition of binder is detected. This shows that the micropores in the low-activated samples might have been blocked whereby the total pore volume drops from 0.16 cm3 g−1 to 0.03 cm3 g−1 upon the addition of the booster carbon and binder. However, a smaller contribution in blocking the micro- and meso-pores is illustrated in the PSD of the KOH-0.5 sample when mixed with PVDF and super C65. The incremental pore volume of both samples show the same PSD profiles with insignificant change in the pore volume of different micro- and mesopore diameters. These results could be attributed to the introduction of macropores in the higher activated samples that prevent the additives of blocking most microporous structures. In addition, the total micropore volume detected by N2 isotherms has drastically increased with increasing the KOH loading whereby the pores blocked by the additives might have constituted a smaller percentage of the total number of pores in higher activated samples. This proves that the specific surface area values and PSD recorded for the prepared activated samples are not the only factor to be considered when studying the electrochemistry of these materials. However, the correlation of the surface pore structure and porosity to the electrochemical behaviour of the carbons also depends on the additives to the electrode materials for supercapacitor applications and hence should always be taken into consideration prior to electrochemical testing.
Elemental analysis was conducted to further study the surface chemistry and impurity of all carbonized samples and chemical compositions are reported in Table S2.† The oxygen content in all activated samples was detected using XPS technique and shows C 1s, O 1s, oxygen Auger (O KLL) and carbon Auger (C KLL) peaks at binding energies of 284 eV, 532 eV and 983.68 eV, 1223.68 eV respectively in all spectra (Fig. S7†). The carbon content decreased with increasing the KOH activation loading, while the hydrogen content slightly increased and that of oxygen was increased which was expected when further chemical activation is applied. It is worth noting that the bulk density of the carbonized samples decreased with increasing the chemical activation conditions in which the KOH etching effect and porosity are expected to increase with macropore domination at high activation conditions.
3.2. Porosity and tortuosity factor evaluation by X-ray tomography
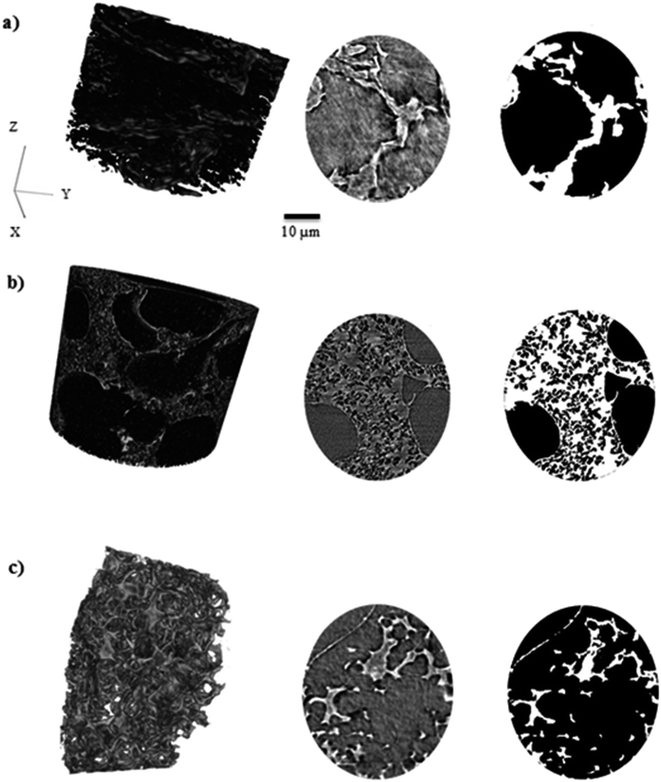
Pore size distribution, porosity and tortuosity factor are three major characteristics of electrode materials in supercapacitor devices. A wide average pore size, high porosity and low tortuosity enhance capacitance retention, cyclability with low impedance at low frequencies and enhance electrolyte diffusion in different pore sizes. 3D images of KOH-0.1, KOH-0.5 and KOH-2 samples and associated grey-scale and binary ortho-slices have been reconstructed and are shown in Fig. 5. These samples are a representation of low, intermediate and high levels of KOH-activation and show the macroporosity distribution along with porosity and tortuosity factor changes in different morphologies of representative activated samples. The porosity (ε) and volume specific interfacial area (VSIA) between carbon and pores of the binary images of the segmented volumes were obtained. To assess the directional uniformity of the pore, the porosity was calculated in the three principal planes on a slice-by-slice basis from the 3D volume, whereby each slice thickness is a single voxel thick (63.1 nm). The same representative volume element was also used for determining the tortuosity factors in the three planes and the corresponding calculated characteristic tortuosity τc.38 Fig. S8† shows that the porosity and tortuosity factor values determined by the representative volume element analysis used for each of the samples did not significantly change with sample size and is therefore representative of each of the bulk materials.As reported in Table 3, the parameters are independent of the KOH loading and do not correlate with the specific surface area values reported in the previous section. It should be noted that these values hugely depend on the measurement technique used whereby all herein are carried out on segmented volumes of the microstructures and hence would not capture the nanostructured details below the scan resolution.46
| Sample | ε (%) | VSIA (μm−1) | τ c |
|---|---|---|---|
| KOH-0.1 | 77 | 0.60 | 1.67 |
| KOH-0.5 | 49 | 0.56 | 4.62 |
| KOH-2 | 79 | 0.91 | 1.48![[thin space (1/6-em)]](https://www.rsc.org/images/entities/char_2009.gif) |
According to the data above, the porosity and VSIA of the KOH-0.5 sample is the lowest, while the tortuosity factor is the highest amongst the three samples. This can be explained by the fact that KOH-0.5 sample has a wide pore size distribution between micro-, meso- and macropores in which not all pores can be detected in the X-ray CT as the micro- and mesopores might be overshadowed/integrated within the macropores. This is not the case for KOH-0.1 sample as most pores are in the micro- and mesopore range while the macropores dominate in the KOH-2 sample. Hence, the higher porosity and VSIA values and lower tortuosity factors values for KOH-0.1 and KOH-2 samples. However, the porosity and VSIA values are considered relatively high for all samples, whereas those of tortuosity to be low which enhanced the electrolyte movement within the porous structure. The interconnection with smaller pores if detected is suggested to increase the porosity and VSIA values and decrease the tortuosity factor values. The carbon atoms were etched at higher levels with increasing the KOH/cellulose ratio, placing them in an “intermediate” state in KOH-0.5 sample that consists of a porous network structure covering different pore size distributions. Further increase of the activating agent amount transfers the carbon state towards wider pores which results in a decrease in surface area as larger pores form on the expense of the smaller micropores.
The pore size distribution (PSD) was determined using the Munch and Holzer continuous PSD method.47 Fig. S9† shows that the majority of the pore volume consists of the detected pore radii within 5–6 μm range for KOH-0.1, 0.5–1 μm for KOH-0.5 and 1–4 μm for KOH-2. The X-ray CT resolution provides larger volume analysis compared to that of BET technique whereby macropores are suggested to overshadow micro- and mesopores in all samples imaged.
3.3. Electrochemical characterization
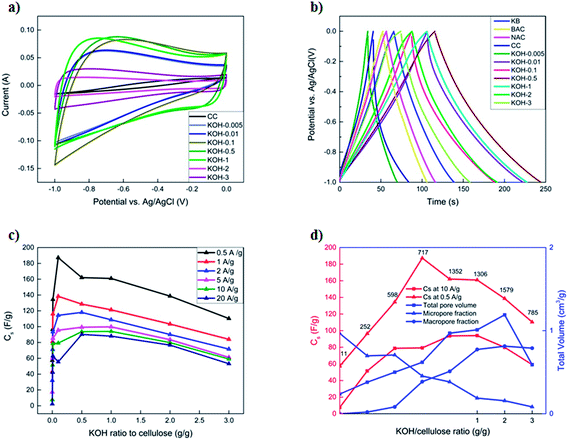
GCD curves at 1 A g−1 are presented in Fig. 6b. Commercial activated carbons (BAC, NAC and KB) display symmetrical and triangular GCD curves with low iR drop, as inferred from the discharge half-cycles, which is a characteristic of an EDLC. In contrast, the unactivated CC samples exhibited an asymmetrical GCD profile with high iR drop, lower specific capacitances at higher current loads and a poor retention capability of 18% at a current density of 20 A g−1. This is attributed to the morphology of the sample that is constituted of a limited number of micropores within the fibrous structure of the carbonized cellulose. All KOH-activated carbons display symmetrical charge–discharge profiles with low iR drops, even at very low KOH/cellulose ratios. The KOH-0.5 and KOH-1 samples show the best performance, having specific capacitances of 162 F g−1 and 161 F g−1 at a current density of 0.5 A g−1, respectively. The latter samples possess a charge retention capability of 73% and 78%, respectively upon increasing the current density to 20 A g−1 (Fig. 6c). This is comparable to commercial activated carbons but with much higher specific capacities at different current loads. This might be attributed to the morphology of the KOH-0.5 and KOH-1 samples which consist of a porous network structure among the different pore size ranges.
The improved supercapacitor performance detected in 1-, 2- and 3-dimensional analyses for the first time yields insight into the importance of the hierarchy of micro-, meso-, and macropores for obtaining high specific capacitance and maintaining a stable behaviour at high current rates. As the amount of KOH activating agent was increased, the specific capacitance increased until reaching an optimum value, beyond which it drastically decreased again. It is evident from different pore size distributions (Fig. 4b) that the average pore sizes of both samples KOH-0.5 and KOH-1 are much smaller (∼1.7 nm) than the samples with high KOH loading (in the macroporous range); yet much higher than those with low KOH/cellulose ratios in which the micropores are not accessible by the electrolyte. The non-accessible pores do not contribute to the total capacitance of the electrode material. This behaviour has been reported as the ion-sieving effect.28,48,49 Furthermore, BET and PSD analyses, as previously shown, demonstrate that the micro-pores are blocked by the PVDF and super C65 addition to the active carbon materials in the low-activated sample KOH-0.005. However, a small decrease in the specific surface area and negligible changes in the PSD are depicted for the KOH-0.5 sample upon adding the same loadings of the binder and booster carbon materials. These results confirm the importance of the accessibility of the micropores by the electrolyte solution and the selectivity of a suitable precursor material depending on the electrolytic solution.
Fig. 6c shows the change in the specific capacitances with increased KOH amount at different current densities. At low current densities, the specific capacitance reaches a maximum with KOH-0.1 sample due to the major role that micropores play at slow kinetics. The KOH-0.5 and KOH-1 samples have similar specific capacitance in the chosen range of current densities. The microporous properties of the structure accommodate the charges and meso- and macroporous features determine transport of ions within the structure as previously mentioned.29 At higher current densities, the performance of the KOH/cellulose samples with low KOH loading drastically decays as the micropores cannot accommodate the fast ion transport kinetics, whereas the macroporous networks can still play the role of adsorption and transportation. This shows that absence of a microporous surface area leads to a decrease in the gravimetric capacitance in KOH electrolyte, which corroborates the results of previous works.27,50Fig. 6d confirms that a ‘balanced’ micro- and macropore distribution of total pore volume maintains high specific surface area values along with highest capacitance especially at rapid charge–discharge cycling.
Single cell potential window opening experiments were conducted to study the stability criterion of the different carbon samples in three-electrode arrangements.39,40Fig. 7 shows the S-values at different vertex potentials in the potential range −1.5 to 1.5 V vs. Eref.
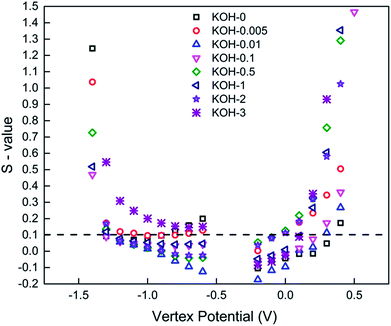 | ||
| Fig. 7 S-value vs. vertex potential plot for all carbonized samples. Pos./neg. polarization was conducted in separate cells. Dashed black line represents the stability criterion introduced by Xu. et al.39 | ||
The S-values and hence the electrochemical stability for the different carbon samples show a clear dependence on the morphology in both anodic and cathodic conditions. CC sample, in particular demonstrates good stability in a wide potential window of −1.3 to 0.4 V, beyond which the magnitude of the S-value drastically increased above the stability limit. The most activated sample (KOH-3) shows instability at cathodic conditions, while the rest of the samples, have an S-value <0.1 in the normal potential window −1 to 0 V at which they are usually tested. This can be again attributed to the morphology of the carbons, whereby a hierarchical porous network structure is vital for not only good performance, but also stability at extreme potentials.
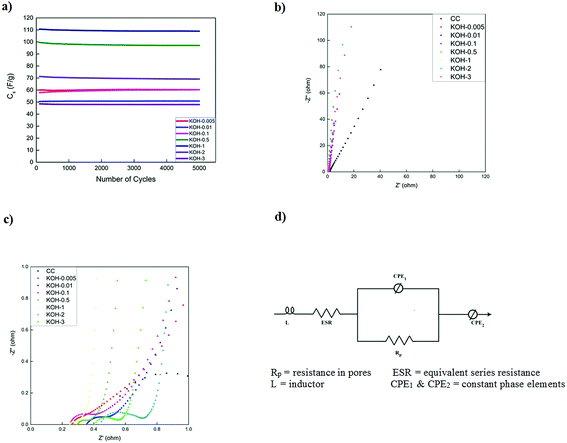
The cycling stability of activated carbons at 10 A g−1 is shown in Fig. 8a. KOH-0.5 sample exhibits the best stability with 94% capacitance retention after 5000 cycles. The cycling stability is better than or comparable to those of biomass carbon electrodes reported in the literature7,16,35,36 but this study presents the performance at much higher current loading of 10 A g−1.
Fig. 8b presents the electrochemical impedance spectra of the different samples at 0 V vs. the open circuit voltage in the frequency range of 0.1 Hz to 100 kHz. All impedance curves show a semicircle in the high frequency region (Fig. 8c) with different starting points and diameters corresponding to different electrolyte/electrode contact resistances, electronic resistances of the electrode materials and the ionic resistance of the electrolyte ions.51
As the KOH loading is increased, a more ideal capacitive behaviour is reached with a more vertical line in the low frequency region with KOH-0.5 and KOH-1 samples. The vertical asymptote was not observed in the impedance curves of the samples with low and high KOH loadings (n = 0.005, 0.01, 0.1, 2 and 3). The porous structure was limited to micropores and micro/mesopores in the low activated samples and dictated by macropores in the highly activated samples which gave rise to non-ideal capacitive behaviour. The equivalent series circuit consists of an inductor (L), the equivalent series resistance (ESR) which dictates the bulk resistance of the electrolyte solution, a constant phase element (CPE1), governing the capacitive non-ideality at the surface of the electrode materials, in parallel with the resistance of the electrolyte inside the pores of the electrodes (Rp). All these components are in series with another constant phase element (CPE2) that governs the non-ideal capacitive behaviour of the different pores throughout the electrode material. It should be noted that the ESR decreases with increasing KOH loading until a minimum (with n = 0.5 and 1) after which the ESR increases again and hence the diameter of the semicircle increases as well. This is attributed in addition to the macropore domination of the porous structure, to the high oxygen content and therefore functional groups at the electrode surface. The values of the different parameters of the constant phase elements vary with the KOH loading and the discrepancy from capacitive ideality is observed at very low and high KOH loadings.
![[thin space (1/6-em)]](https://www.rsc.org/images/entities/char_2009.gif) :
:![[thin space (1/6-em)]](https://www.rsc.org/images/entities/char_2009.gif) 1 and 1
1 and 1![[thin space (1/6-em)]](https://www.rsc.org/images/entities/char_2009.gif) :
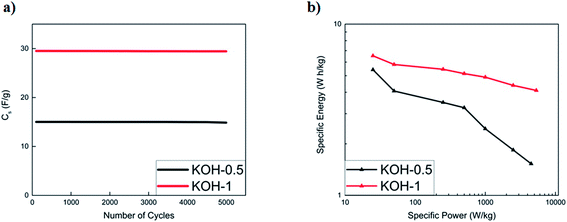
:![[thin space (1/6-em)]](https://www.rsc.org/images/entities/char_2009.gif) 1 displayed the best performances and are comparable to commercially available activated carbons. The capacitance retention of both activated samples was recorded to be 99.8% upon 5000 cycles for both KOH-0.5 and KOH-1 full cells (Fig. 9a).
1 displayed the best performances and are comparable to commercially available activated carbons. The capacitance retention of both activated samples was recorded to be 99.8% upon 5000 cycles for both KOH-0.5 and KOH-1 full cells (Fig. 9a).
To further evaluate the supercapacitor performance, the energy and power densities were represented in a Ragone plot (Fig. 9b). The KOH-1 device exhibits an energy density of 6.6 W h kg−1 and power density of 25 W kg−1 at a current density of 0.05 A g−1. At a higher current density of 10 A g−1, the power density increases to 5332 W kg−1, with corresponding energy density of 4.1 W h kg−1. These results show that a simple two-step procedure yields good preliminary results and may be improved further by incorporating pseudocapacitive materials into the porous structure.
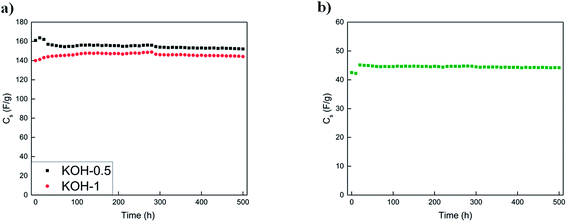
The voltage hold test was performed to study the ageing of the electrochemical performance of the porous carbon materials for commercial applications. The conditions at which the voltage hold was done are as follows: (i) −1 V for KOH-0.5 and KOH-1 samples in the three electrode configuration with occasional cycling between −1 and 0 V and (ii) 1 V for the KOH-1 full cell for the three-electrode system and cycling between 0 V and the respective upper cell voltage. Both tests were conducted at a current density of 0.5 A g−1.41,42 Three cycles were performed every 10 h during the voltage hold procedure. Fig. 10 shows the respective voltage hold experiments.
The initial capacitance values for the KOH-1 three-electrode system and KOH-1 full cell was 140 F g−1 at −1 V and 42 F g−1 at 1 V, respectively with no capacitance loss over 500 h. In addition to the almost constant capacitance value observed over the 500 h test, insignificant capacitance fluctuations were observed during the voltage hold in both configurations whereby the capacitance value decreases by less than 1% after 500 h for the full cell test. Thus, the cycling test time for the voltage hold experiment for 10 h is equivalent to more than 5000 charge/discharge cycles. For the voltage limits indicated in the cycling experiment, the capacitance retention was above 99% for KOH-1 sample as illustrated previously. The voltage hold test after 10 h and cycling test therefore both suggest a stable full cell system and no significant loss in the capacitance values. The capacitance loss for the voltage hold test was almost identical to that obtained by cycling (∼1%).
4. Conclusion
Interconnected porous carbons with high surface areas and total pore volumes were prepared via activation of cellulose with different potassium hydroxide loadings followed by a direct carbonization process. This forms a model system with which to explore how different morphological factors directly influence the electrochemical system of the electrodes in supercapacitor application. It was found that optimum KOH/cellulose ratios of 0.5![[thin space (1/6-em)]](https://www.rsc.org/images/entities/char_2009.gif) :
:![[thin space (1/6-em)]](https://www.rsc.org/images/entities/char_2009.gif) 1 and 1
1 and 1![[thin space (1/6-em)]](https://www.rsc.org/images/entities/char_2009.gif) :
:![[thin space (1/6-em)]](https://www.rsc.org/images/entities/char_2009.gif) 1 yielded high surface areas, crucially with a hierarchical pore size distribution that gives rise to the best electrochemical performance in supercapacitor devices. This study reveals that the electrochemical performance does not solely depend on high surface areas but also on an optimum pore size distribution, specifically at low current densities. For the first time, X-ray CT was coupled with different characterization techniques to study the effect of three-dimensional structure on electrochemical performance in supercapacitor applications. Further study on the interconnectivity of the pores via TEM tomography is needed to provide a complete determination of these parameter groups and provide significantly smaller analysis volumes compared to X-ray CT used herein. The KOH-0.1 sample displayed best electrochemical performance at very low current densities due to the domination of microporous networks. However, KOH-0.5 and KOH-1 carbons exhibited good electrochemical performances with superior stability at different current densities with specific capacitances of 162 F g−1 in 6 M KOH. These findings demonstrate the contribution of interplaying morphological factors to double-layer capacitance and high performance rates over a variety of length scales, and open new pathways for the optimization of supercapacitor materials starting with activated carbons.
1 yielded high surface areas, crucially with a hierarchical pore size distribution that gives rise to the best electrochemical performance in supercapacitor devices. This study reveals that the electrochemical performance does not solely depend on high surface areas but also on an optimum pore size distribution, specifically at low current densities. For the first time, X-ray CT was coupled with different characterization techniques to study the effect of three-dimensional structure on electrochemical performance in supercapacitor applications. Further study on the interconnectivity of the pores via TEM tomography is needed to provide a complete determination of these parameter groups and provide significantly smaller analysis volumes compared to X-ray CT used herein. The KOH-0.1 sample displayed best electrochemical performance at very low current densities due to the domination of microporous networks. However, KOH-0.5 and KOH-1 carbons exhibited good electrochemical performances with superior stability at different current densities with specific capacitances of 162 F g−1 in 6 M KOH. These findings demonstrate the contribution of interplaying morphological factors to double-layer capacitance and high performance rates over a variety of length scales, and open new pathways for the optimization of supercapacitor materials starting with activated carbons.
Conflicts of interest
There are no conflicts of interest to declare.Acknowledgements
D. J. L. B. and P. S. R acknowledge support from the Engineering and Physical Sciences Research Council (EP/M014371/1, EP/M023508/1 and EP/M009394/1), the Royal Academy of Engineering and access to Zeiss Xradia Ultra 810 instrument at UCL that is supported by UCL and EPSRC. T. P. N. acknowledges funding from EPSRC Frontier Engineering (EP/K038656/1). M. M. T and D. I. A. are grateful to UPM-Kymmene Corporation that provided the cellulose materials used throughout the experiments.References
- G. Wang, L. Zhang and J. Zhang, Chem. Soc. Rev., 2012, 41, 797–828 RSC.
- Y. Zhang, H. Feng, X. Wu, L. Wang, A. Zhang and T. Xia, Int. J. Hydrogen Energy, 2009, 34, 4889–4899 CrossRef CAS.
- B. E. Conway, Electrochemical Supercapacitors: Scientific Fundamentals and Technological Applications, Springer Science & Business Media, New York, 1999 Search PubMed.
- F. Beguin and E. Frackowiak, Carbons for Electrochemical Energy Storage Conversion Systems, CRC Press, New York, 2010 Search PubMed.
- A. Burke, J. Power Sources, 2000, 91, 37–50 CrossRef CAS.
- A. G. Pandolfo and A. F. Hollenkamp, J. Power Sources, 2006, 157, 11–27 CrossRef CAS.
- L. Zhao, L. Z. Fan, M. Q. Zhou, H. Guan, S. Qiao and M. Antonietti, Adv. Mater., 2010, 22, 5202–5206 CrossRef CAS PubMed.
- G. G. Park, Y.-J. Sohn, T.-H. Yang, Y.-G. Yoon, W.-Y. Lee and C.-S. Kim, J. Power Sources, 2004, 131, 182–187 CrossRef CAS.
- P. Cheng, S. Gao, P. Zang, X. Yang, Y. Bai and H. Xu, Carbon, 2015, 93, 315–324 CrossRef CAS.
- C.-S. Yang, Y. S. Jang and H. K. Jeong, Curr. Appl. Phys., 2014, 14, 1616–1620 CrossRef.
- L. Jiang, J. Yan, L. Hao, R. Xue, G. Sun and B. Yi, Carbon, 2013, 56, 146–154 CrossRef CAS.
- K. E. Shopsowitz, W. Y. Hamad and M. J. MacLachlan, Angew. Chem., Int. Ed., 2011, 50, 10991–10995 CrossRef CAS PubMed.
- J. Díaz-Terán, D. M. Nevskaia, J. L. G. Fierro, A. J. López-Peinado and A. Jerez, Microporous Mesoporous Mater., 2003, 60, 173–181 CrossRef.
- O. Barbieri, M. Hahn, A. Herzog and R. Kotz, Carbon, 2005, 43, 1303–1310 CrossRef CAS.
- J. Mi, X.-R. Wang, R.-J. Fan, W.-H. Qu and W. C. Li, Energy Fuels, 2012, 26, 5321–5329 CrossRef CAS.
- T. E. Rufford, D. Hulicova-Jurcakova, Z. Zhu and G. Q. Lu, Electrochem. Commun., 2008, 10, 594–1597 CrossRef.
- L. Wei, M. Sevilla, A. B. Fuertes, R. Mokaya and G. Yushin, Adv. Energy Mater., 2011, 1, 356–36115 CrossRef CAS.
- L. Wei, M. Sevilla, A. B. Fuertes, R. Mokaya and G. Yushin, Adv. Energy Mater., 2011, 1, 356–361 CrossRef CAS.
- L. Wei, M. Sevilla, A. B. Fuertes, R. Mokaya and G. Yushin, Adv. Energy Mater., 2012, 22, 827–834 CrossRef CAS.
- A. B. Fuertes and M. Sevilla, ACS Appl. Mater. Interfaces, 2015, 7, 4344–4353 CAS.
- A. B. Fuertes and M. Sevilla, Carbon, 2015, 94, 41–52 CrossRef CAS.
- S. Y. Liew, S. Shariki, A. Vuorema. D. Walsh, F. Marken and W. Thielemans, Cellulose Nanowhiskers in Electrochemical Applications, American Chemical Society, Washington, 2012 Search PubMed.
- M. Seredych, D. Hulicova-Jurcakova, G. Q. Lu and T. Bandosz, Carbon, 2008, 46, 1475–1488 CrossRef CAS.
- M. Seredych, M. Koscinski, M. Sliwinska-Bartkowiak and T. Bandosz, J. Power Sources, 2012, 220, 243–252 CrossRef CAS.
- D. Salinas-Torres, J. M. Sieben, D. Lozano-Castello, D. Cazorla-Amoros and E. Morallon, Electrochim. Acta, 2013, 89, 326–333 CrossRef CAS.
- C. Falco, J. M. Sieben, N. Brun, M. Sevilla, T. van der Mauelen, E. Morallon, D. Cazorla-Amoros and M. M. Titirici, ChemSusChem, 2013, 6, 374–382 CrossRef CAS PubMed.
- J. Chmiola, G. Yushin, R. Dash and Y. Gogotsi, J. Power Sources, 2006, 158, 765–772 CrossRef CAS.
- D. Lozano-Castelló, D. Cazorla-Amorós, A. Linares-Solano, S. Shiraishi, H. Kurihara and A. Oya, Carbon, 2003, 41, 1765–1775 CrossRef.
- D.-W. Wang, F. Li, M. Liu, G. Q. Lu and H.-M. Cheng, Angew. Chem., Int. Ed., 2008, 47, 373–376 CrossRef CAS PubMed.
- D. Lozano-Castelló, M. A. Lillo-Ródenas, D. Cazorla-Amorós and A. Linares-Solano, Carbon, 2001, 39, 741–749 CrossRef.
- M. A. Lillo-Ródenas, D. Cazorla-Amoros and A. Linares-Solano, Carbon, 2003, 41, 267–275 CrossRef.
- A. Linares-Solano, D. Lozano-Castelló, M. Lillo-Ródenas and D. Cazorla-Amorós, Chem. Phys. Carbon, 2007, 30, 1–62 Search PubMed.
- E. Raymundo-Piñero, P. Azaïs, T. Cacciaguerra, D. Cazorla-Amorós, A. Linares-Solano and F. Béguin, Carbon, 2005, 43, 786–795 CrossRef.
- H. Marsh and F. R. Reinoso, Activated Carbon, Elsevier, 2006 Search PubMed.
- T. E. Rufford, D. Hulicova-Jurcakova, K. Khosla, Z. Zhu and G. Q. Lu, J. Power Sources, 2010, 195, 912–918 CrossRef CAS.
- P. R. Shearing, R. Bradley, J. Gelb, S. Lee, A. Atkinson and P. Withers, Electrochem. Solid-State Lett., 2011, 14, B117–B120 CrossRef CAS.
- O. O. Taiwo, D. P. Finegan, J. Gelb, C. Holzner, D. J. L. Brett and P. R. Shearing, Chem. Eng. Sci., 2016, 154, 27–33 CrossRef CAS.
- S. J. Cooper, M. Kishimoto, F. Tariq, R. S. Bradley, A. J. Marquis and N. P. Brandon, ECS Trans., 2013, 57, 2671–2678 CrossRef.
- K. Xu, S. P. Ding and T. R. Jow, J. Electrochem. Soc., 1999, 146, 4172–4178 CrossRef CAS.
- D. Weingarth, H. Noh, A. Foelske-Schmitz, A. Wokaun and R. Kotz, Electrochim. Acta, 2012, 103, 119–124 CrossRef.
- D. Weingarth, A. Foelske-Schmitz and R. Kotz, J. Power Sources, 2013, 225, 84–88 CrossRef CAS.
- P. W. Ruch, D. Cericola, A. Foelske-Schmitz, R. Kotz and A. Wokaun, Electrochim. Acta, 2010, 55, 4412–4420 CrossRef CAS.
- C. A. Leon y Leon, Adv. Colloid Interface Sci., 1998, 76–77, 341–372 CrossRef CAS.
- J. Koresh and A. Soffer, J. Electroanal. Chem. Interfacial Electrochem., 1983, 147, 223–234 CrossRef CAS.
- H. Shi, Electrochim. Acta, 1996, 41, 1633–1639 CrossRef CAS.
- P. R. Shearing, Y. Wu, S. J. Harris and N. P. Brandon, Electrochem. Soc. Interface, 2011, 20, 43–47 CrossRef CAS.
- B. Münch and L. Holzer, J. Am. Ceram. Soc., 2008, 91, 4059–4067 CrossRef.
- D. Qu and H. Shi, J. Power Sources, 1998, 74, 99–107 CrossRef CAS.
- G. Salitra, A. Soffer, L. Eliad, Y. Cohen and D. Aurbach, J. Electrochem. Soc., 2000, 147, 2486–2493 CrossRef CAS.
- C. Vix-Guterl, E. Frackowiak, K. Jurewicz, M. Friebe, J. Parmentier and F. Béguin, Carbon, 2005, 43, 1293–1302 CrossRef CAS.
- G. He, J. Li, W. Li, B. Li, N. Noor, K. Xu, J. Hu and I. Parkin, J. Mater. Chem. A, 2015, 3, 14272–14278 CAS.
Footnote |
| † Electronic supplementary information (ESI) available. See DOI: 10.1039/c7se00519a |
| This journal is © The Royal Society of Chemistry 2018 |

