Hydrogen production from methane at 200 to 500 °C – clean hydrogen production in conjunction with carbon fixation at 200 to 250 °C†
Baowang
Lu
 *,
Mitsuhiro
Inoue
and
Takayuki
Abe
Hydrogen Isotope Research Center, Organization for Promotion of Research, University of Toyama, Gofuku 3190, Toyama 930-8555, Japan. E-mail: baowangl@ctg.u-toyama.ac.jp
First published on 10th January 2018
Abstract
Traditional low-temperature H2 production from methane needs high operating temperatures (above 500 °C), generates CO2 emissions, and shows poor stability. This study focused on more low-temperature stable H2 production from methane using a carbon-supported Ru catalyst (BS-Ru/C). This catalyst could stably generate H2 without COx at 200 °C over 15 days. The temperature for clean H2 production in conjunction with carbon fixation was found to be 200–250 °C, far lower than around 550 °C for the conventional low-temperature methane catalytic decomposition (MCD). The BS-Ru/C catalyst enabled the occurrence of steam reforming of methane (SRM) at 260 °C, which far exceeded other previous low-temperature catalysts reported at around 500 °C. Although CO2 was produced during the SRM process from 260 to 500 °C, no CO was produced. This lower-temperature stable H2 production technology using the BS-Ru/C catalyst with outstanding ability and stability will provide a helping hand to build a H2 society in near future.
1. Introduction
Because the combustion of hydrogen (H2) generates only water without any polluting emissions, especially emission of carbon dioxide (CO2) (the main factor in global warming), it is considered to be the best fuel vector. As the cleanest and an environment-friendly energy carrier, H2 has attracted considerable attention worldwide for solving the problem of global warming in recent years. However, H2 is not a primary energy source, and should be artificially produced from other resources.1–6 Although H2 production from water using electrochemical, thermochemical and photochemical approaches is the most environment-friendly method, because its efficiency is low,5,6 and only 5% of H2 production can be derived from water, it is being developed. In contrast, because methane is an ideal H2 carrier due to its large abundance, high H/C ratio and prevalence in nature, H2 production from methane is possible and represents the most common H2 production system.7–18 Steam reforming of methane (SRM) and methane catalytic decomposition (MCD) are the most feasible and common routes for H2 production from methane.7–18 Unfortunately, both the routes have the following disadvantages: normal operation at high temperature (above 750 °C), CO2 emission generation,13 and poor catalytic stability.17,18MCD:
| CH4 → C + 2H2 ΔH = +74.8 kJ mol−1 |
SRM:
| CH4 + H2O ↔ CO + 3H2 ΔH = +206 kJ mol−1 |
Generally, for preparing dispersed metal nanoparticles on supports, conventional methods often result in liquid waste emission and require a heating process. Therefore, a “dry” technique without any liquid waste emission and heating, a “polygonal barrel-sputtering method,” has been developed as an environment-friendly catalyst preparation method.19–22 Additionally, the metal nanoparticles prepared by the polygonal barrel-sputtering method exhibit higher catalytic performance than those obtained by conventional methods.22 Based on the above considerations, in order to achieve success in lower-temperature stable H2 production from methane via SRM and MCD processes, the polygonal barrel-sputtering method was employed to prepare sputtered Ru nanoparticles on carbon as a catalyst (BS-Ru/C), and lower-temperature stable H2 production without COx emissions (clean H2) or with less COx emissions at 200–500 °C using it was investigated.
2. Experimental
2.1 Catalyst preparation and characterization
A Ru/C catalyst (denoted as BS-Ru/C) with a Ru deposition amount of 0.58 wt% was prepared by the polygonal barrel-sputtering method.19–22 Pure carbon powder with a particle size of approximately 20 μm (Kojundo Chemical Laboratory) was used as the support and a Ru plate (99.9% purity, 50 × 100 mm) was employed as the sputtering target. The preparation procedure has been previously described.19–22 Briefly, a 3.5 g aliquot of carbon powder was loaded into an octagonal barrel and the barrel was introduced in a vacuum chamber. The vacuum chamber was then carefully evacuated to 8.0 × 10⁻⁴ Pa using rotary and oil diffusion pumps. Subsequently, high-purity Ar (purity: 99.995%) was gradually introduced into the chamber. Radio-frequency (13.56 MHz) magnetron sputtering was performed at an Ar pressure of 1.0 Pa for 30 min with an input power of 100 W. During sputtering, the barrel was oscillated at 4.3 rpm and an amplitude of ±75°. After sputtering, N2 (purity: 99.995%) was slowly introduced into the chamber to achieve atmospheric pressure in the barrel, at which point the sample was removed. The amount of the Ru deposited was determined by X-ray fluorescence (XRF, Philips, Spectrometer PW 2300) based on a calibration curve with Ru metal particles (Tanaka Kikinzoku).A reference Ru/C catalyst (referred to as Ref.-Ru/C, with a Ru deposition amount of 0.8 wt%) was also prepared using a conventional wet process for comparison purposes. In this process, 0.060 g of ruthenium(III) chloride n-hydrate (RuCl3·nH2O, Ru: 40 wt%, Kanto Chemical, Japan) was dissolved in 7 ml of water, after which 3 g of carbon powder was added to the solution and the resulting slurry was dried at 80 °C for 24 h. Finally, the sample was reduced by heating to 350 °C at a rate of 100 °C h−1 and keeping it at this temperature for 4 h in an 80% H2/N2 gas stream (flow rate: 50 ml min−1).
The chemical state of the Ru particles was evaluated using X-ray photoelectron spectroscopy (XPS, Thermo Fisher Scientific, ESCALAB 250X, T) at 25 W and 25 °C with monochromatized Al Kα excitation. Samples for XPS were prepared by mixing Au particles purchased from Niraco with the Ru/C, and the resulting spectra were normalized relative to the 84 eV Au 4f7/2 peak. The compositions of the Ru species were estimated from the areas of each peak, using a sensitivity factor associated with the XPS instrumentation.
Catalysts before and after use were assessed by temperature-programmed reduction (TPR) with a BEL-CAT Catalyst Analyzer (BEL Japan Inc.). Each sample (approximately 50 mg) was pretreated for 1 h at 120 °C in an Ar flow (30 ml min−1) followed by cooling to 40 °C in an Ar stream (30 ml min−1). After Ar was replaced by a mixture of 3 vol% H2 in Ar (total flow rate: 30 ml min−1), the temperature was increased from 50 to 950 °C at 10 °C min−1. All TPR data were normalized to the respective sample weight and expressed in arbitrary units.
The deposition state of Ru particles was observed using conventional transmission electron microscopy (TEM, JEOL, JEM2100 and JEM2000EXII) at 200 kV. Catalyst use was also examined by Cs-corrected scanning transmission electron microscopy (Cs-corrected STEM) at 80 kV using a high-resolution TEM instrument (JEOL, JEM-ARM200F).
2.2 Catalyst testing
The catalytic activity of each Ru/C catalyst was evaluated using the fixed-bed flow reaction system shown in Fig. S1.† In this reaction system, a bubbler (operating at a temperature of ≤100 °C), not evaporator, was used to supply steam using a water pump. The reactor was made of quartz (inner diameter: 10 mm) and was heated in a furnace, using two thermocouples (one positioned in the catalyst and the other located outside the reactor) to control the temperature. The reaction was performed at atmospheric pressure. Prior to each reaction, a 1 g sample of the catalyst was introduced into the reactor, giving a 2 cm high catalyst layer and then reduced at a certain temperature (200–400 °C) for 30 min under the same conditions used to prepare the Ref.-Ru/C. After cooling the reactor to room temperature, the reactant gas was supplied as follows. 15 ml min−1 of pure Ar gas was initially introduced into the reactor through a bubbler containing water heated to 40–100 °C (at time t1). Subsequently, 15 ml min−1 of 5% CH4 diluted with Ar (gas hourly space velocity (GHSV) = 1800 ml (h−1 gcatal−1)) was introduced through the same route (at time t2). The steam-to-CH4 molar ratio (S/C ratio) was adjusted by varying the difference between the two times (t1 − t2). The reactor was then heated to a desired temperature for 1 h and the product gases were analyzed using an online-gas chromatograph (Shimadzu, GC-8A) equipped with a thermal conductivity detector and an active carbon column. For the stability tests, the products were characterized immediately after the temperature was increased to the set value.3. Results
3.1 H2 production over catalyst BS-Ru/C
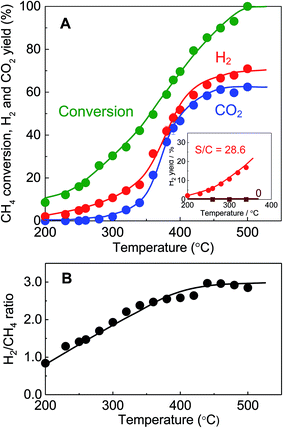
The TEM image of the BS-Ru/C catalyst obtained using the polygonal barrel-sputtering method is provided in Fig. S2(A),† in which the deposited Ru particles appear as black dots on a gray carbon support. The Ru particle sizes with a narrow distribution were less than 4 nm, and the average size was estimated to be 1.8 nm (Fig. S2(B)†), clearly indicating one advantage (deposition of small Ru particles21,22) of the polygonal barrel-sputtering method.Because methane catalytic decomposition could not stably occur below 180 °C using the BS-Ru/C catalyst due to deactivation, its catalytic stable decomposition was carried out from 200 to 500 °C. In the inset in Fig. 1(A), at the S/C ratio of 0, no H2 stable generation occurred from 200 to 340 °C, while at the S/C ratio of 28.6, H2 was stably produced at a surprisingly low temperature of 200 °C, and its yields increased with increasing temperature. This temperature of stable H2 generation with the BS-Ru/C catalyst is far lower than that (around 550 °C) previously reported for the MCD process.7–9 As shown in Fig. 1(A), increasing the temperature from 200 to 250 °C, the CH4 conversion and H2 yield increased from 8.6% and 2.0% to 15.9% and 4.8%, respectively. Unexpectedly, no COx was obtained at this temperature region. It can be considered that water did not supply active oxygen even though it was used, showing that a complete low-temperature MCD process occurred. According to a previous report,23 our H2 product at this temperature region can directly applied for polymer electrolyte membrane fuel cells (PEMFCs) and alkaline fuel cells (AFCs) without COx removal. To the best of our knowledge, this is the first-ever demonstration of clean H2 production in conjunction with carbon fixation, in which neither CO2 nor CO was produced in the low temperature range of 200–250 °C. From 260 °C, CH4 conversion and the H2 yield further increased with increasing temperature, while CO2 was also generated with a gradually increasing yield, indicating that water began to supply active oxygen and the SRM process occurred. Therefore, CO2 production derived from CO through water gas shift reaction (WGSR) was dependent on temperature. The temperature at which this SRM process occurred is far lower than previous reports (around 500 °C).10–16 At 500 °C, CH4 conversion, the H2 and CO2 yields reached 100%, 75%, and 60%, respectively. Although CO2 production could not be avoided from 260 °C, it is worthy to note that the BS-Ru/C catalyst did not generate CO, which reduces the performances of PEFCs, irrespective of temperature. This result suggests that although CO was produced, it was completely converted to CO2 through WGSR.
WGSR:
| CO + H2O ↔ CO2 + H2 ΔH = −41 kJ mol−1 |
As shown in Fig. 1(B), the H2/CH4 ratio increased linearly with increasing temperature, while increased slowly in the temperature range of 420–440 °C, and then decreased slowly with increasing temperature from 440–500 °C. A H2/CH4 ratio of <2 strongly indicates that methane was partially decomposed, and hydrocarbon simultaneously resulted as the main solid product other than the H2 gas product, while a H2/CH4 ratio of ≥2 means that methane was completely decomposed. When the H2/CH4 ratio was ≈2, carbon was the main solid product. From 260 to 420 °C, the H2/CH4 ratio gradually increased from 1.5 to 3, suggesting that a mixed process (MCD + SRM) occurred, but was essentially constant at 3 at 440–500 °C, indicating a complete SRM process. Therefore, the H2/CH4 ratio and the reaction process were dependent on temperature. The activation energies were determined to be 45.4 kJ mol−1 at 200–250 °C (MCD process), 30.4 kJ mol−1 at 260–420 °C (MCD + SRM process) and 11.6 kJ mol−1 at 440–500 °C (SRM process), which are approximately one half to one tenth of those previously reported for MCD (59–92.4 kJ mol−1)24–27 and SRM processes (91–144 kJ mol−1).11–13 These very low activation energies clearly confirm the very high catalytic activity of the BS-Ru/C catalyst.
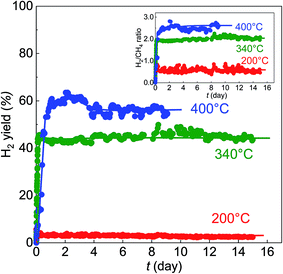
Subsequently, the catalytic stability was tested at 200, 340, and 400 °C. In Fig. 2, H2 generation was stable over 15 days at 200 °C, although its yield was relatively low at 2.5%. At 340 °C, the H2 yield increased to approximately 45% and kept constant over 15 days, while at 400 °C, the highest yield of about 60% was obtained after 9 days. It is well known that the best catalyst reported in the MCD process was maintained for only 70 h,28 therefore, our BS-Ru/C catalyst exhibited excellent catalytic stability, as well as high catalytic activity, which lowers the temperature required for H2 generation. It is also worth noting that the H2/CH4 ratio was 0.5 at 200 °C, 2 at 340 °C, and 2.5 at 400 °C (the inset of Fig. 2), indicating the temperature dependence of the H2/CH4 ratio, further suggesting that the H2 generation pathway may change with temperature.
Thus, as shown in Fig. 3, it is concluded that H2 generation over BS-Ru/C includes three pathways: (I) partial methane direct decomposition (partial MCD process): CH4 → CHx + ((4 − x)/2)H2 in the low temperature range of 200–250 °C, different from the conventional MCD process (complete methane direct decomposition);7–9 (II) simultaneous methane direct decomposition and steam reforming in the moderate temperature region of 260–420 °C, and complete methane direct decomposition occurring only at the H2/CH4 ratio of 2; and (III) low temperature methane steam reforming in the temperature region of 440–500 °C. The H2 yields were recalculated based on the maximum H2/CH4 ratios in each temperature region (200–250 °C: 2, 260–500 °C: 3). As a result, the H2 yield in Fig. 3(A) was determined to be approximately 100% at 500 °C. To our knowledge, there have been no reports of such a high H2 yield at 500 °C. The stability test data in Fig. 4(B) demonstrates that the clean H2 yield at 200 °C corresponds to H2 generation of 10% while the values at 340 and 400 °C were 40% and 75%, respectively.
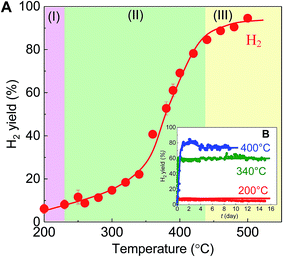 | ||
| Fig. 3 Recalculated data for the reaction over the BS-Ru/C catalyst based on Fig. 1 and 2 ((A): H2 yield versus reaction temperature, (B): H2 yield versus reaction time). Temperature regions (I), (II), and (III) are explained in the text. The data were determined from the following equation: H2 yield = (H2 amount (mol)/CH4 feed amount (mol))/X × 100 (X = 2 (200–250 °C), 3 (>260 °C)). | ||
3.2 H2 production over reference catalyst Ref.-Ru/C
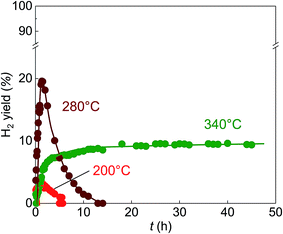
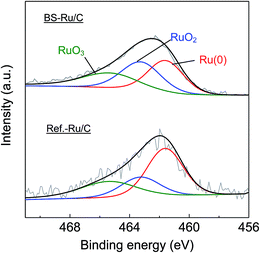
The outstanding activity and stability of BS-Ru/C catalyst were further confirmed using a reference catalyst Ref.-Ru/C obtained using a conventional method. In Fig. S3,† the sizes of Ru particle in Ref.-Ru/C were widely distributed over the range of 0.8–13.8 nm, with an average size of 3.9 nm that was about twice of that in the BS-Ru/C catalyst (1.8 nm). By comparing the TEM observation of BS-Ru/C and Ref.-Ru/C catalysts, it can be found that the polygonal barrel-sputtering method can yield nano Ru particles with smaller size and narrower size distribution than the conventional method, similar to the previous report.21,22 As shown in Fig. 4, although H2 was generated over the Ref.-Ru/C catalyst, its yield rapidly decreased to nil after 6 h at 240 °C and 13 h at 280 °C. The temperature of stable H2 production over Ref.-Ru/C was 300 °C, way higher than that over our catalyst BS-Ru/C. At 340 °C, relatively stable H2 generation occurred, but its yield was approximately 10%, which is significantly lower than that using our BS-Ru/C catalyst due to the large size of Ru particles. Thus, compared with the Ref.-Ru/C catalyst, as well as with conventional catalysts for MCD and SRM processes,7–16 the BS-Ru/C catalyst exhibited excellent activity and stability for H2 generation.To clarify the reason for the enhanced activity and stability of the BS-Ru/C catalyst, we examined the surface physical properties of both catalysts. Fig. 5 presents the Ru 3p2/3 spectra obtained by X-ray photoelectron spectroscopy (XPS). A broad peak observed at approximately 463 eV for both catalysts could be deconvoluted to give peaks attributed to Ru(0) (461.6 eV), RuO2 (463.2 eV), and RuO3 (465.3 eV).29 However, the proportion of Ru(0), serving as the active sites11 in BS-Ru/C (31.5%), is lower than that in Ref.-Ru/C (43.3%). In Fig. 6, the temperature programmed reduction (TPR) profile of Ref.-Ru/C contained a large peak assigned to the reduction of dispersed RuOx at 162.2 °C with a small crystalline RuO2 reduction peak at approximately 260 °C.30 In contrast, the BS-Ru/C catalyst gave two large reduction peaks of well-dispersed RuOx and crystalline RuO2.29–31 Based on the XPS and TPR results, the biggest difference between both catalysts is their surface composition (atomic arrangements). Therefore, the special surface characteristic of the BS-Ru/C catalyst can be considered as the main factor that influences its improved stability and activity.
3.3 Discussion on reaction pathway and mechanisms
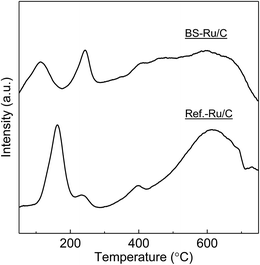
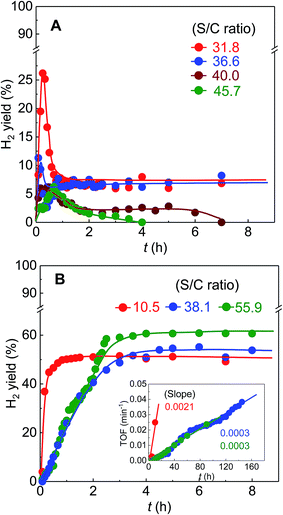
Because the S/C ratios used for the BS-Ru/C catalyst were far higher than those (2.5–4) for conventional catalysts,11,13–15 the high activity of the BS-Ru/C catalyst may be associated with high water concentration. To further study the water effect, the H2 yields in the initial reaction period are shown in Fig. 7. At 200 °C (Fig. 7(A)), the H2 yield was suppressed considerably by increasing the S/C ratio, similar to the previous observation,32 suggesting that water reduces the methane dissociation rate by decreasing its concentration which is caused by adding a large amount of water. Unfortunately, when the S/C ratio increased to 40.0 and 45.7, catalyst deactivation occurred rapidly (only maintained several hours), indicating that excess water was unwanted. However, at 340 °C (Fig. 7(B)), a different trend of the water effect was clearly found. The H2 yield was suppressed considerably after increasing the Si/C ratio from 10.5 to 38.1, and no change in its yield was observed after further increasing the Si/C ratio from 38.1 to 55.9, strongly indicating that water also plays another role except suppressing CH4 dissociation. The calculated TOF (turnover frequency) of H2 production is presented as an inset in Fig. 7(B). There is a good linear relationship between TOF and time. The H2 production rate at the S/C ratio of 10.5 was 7 times of that at the S/C ratio of 38.1 and 55.9. Therefore, the water effect varied with temperature, and only at an appropriate S/C ratio, the catalyst could be stable regardless of temperature.To fully understand the reaction pathway, the physical properties of BS-Ru/C catalysts before and after the stability test were assessed by TPR (Fig. 8). For the fresh catalyst, compared with the carbon support, the first two peaks were attributed to Ru particles, while the later broad peak in the range of 320–720 °C was attributed to the carbon support. After the stability test at 200 °C, a new peak at approximately 350 °C appeared. According to ref. 33 and 34, it was assigned to the Cβ carbon in the hydrocarbon. After the stability test at 340 °C, a peak appeared in the vicinity of 550 °C ascribed to Cγ, indicating graphitic carbon formation.33,34 However, the catalyst used at 400 °C showed two peaks at 350 and 550 °C, indicating that both hydrocarbon and graphitic carbon were generated. The hydrocarbon must have originated from the recombination of the CHx species dissociated from the methane on the catalyst surface.35,36 Although hydrocarbon was formed at both 200 and 400 °C, the hydrocarbon should have different hydrogen proportions due to different H2/CH4 ratios (Fig. 2), i.e., abundant and poor hydrogen-containing hydrocarbons were produced at 200 and 340 °C, respectively.
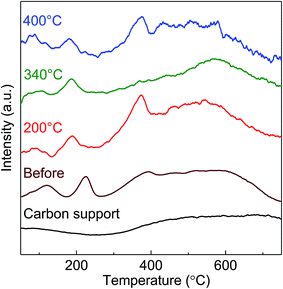 | ||
| Fig. 8 TPR profiles obtained from the carbon support and the BS-Ru/C catalyst before and after stability tests at 200, 340, and 400 °C. | ||
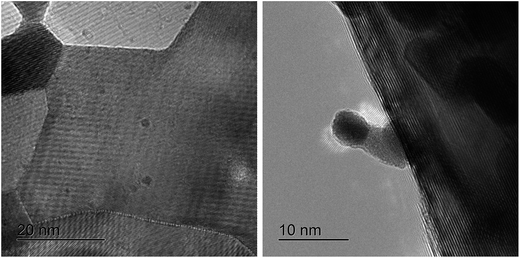
The BS-Ru/C catalyst used at 340 °C was observed by Cs-corrected STEM. In Fig. 9, the two carbons (the deposited carbon and support carbon) can be clearly distinguished. The left image contains a highly dark layer with 100 lattice fringes around the dark Ru particles, which are assigned to the carbon deposited on the support carbon with a gray layer, such as carbon fibers and tubes.37 Fortunately, the deposited carbon growth behaviour was also observed (Fig. 9 (right)). A Ru particle was loaded on the edge of the carbon support by the polygonal barrel-sputtering method. After carbon growth, this Ru particle had left the carbon support, and was obviously seen on the end of the carbon fiber/tube, clearly indicating that these formed carbons did not cover the Ru surfaces, also showing that the catalyst surface kept clear from the beginning to the end of the reaction. The growth behaviour of this deposited carbon was very similar to the previous observation using Ru catalyst37 and Ni catalyst.38 It can be considered that a carbon atom was formed on the Ru catalyst surface through methane dissociation, and then moved to its edge through diffusion caused by concentration gradient, similar to the previous report using Fe, Ni and Ni-containing catalysts.39,40 When the carbon atom at the Ru edge achieved supersaturation, a carbon nucleus formed and resulted in the formation of carbon layers after growth. This observation clearly confirms that after the suppressing methane dissociation rate using a large amount of water, there would be enough time to achieve good carbon diffusion and growth, leading to a lack of cover on the Ru catalyst surfaces. Although the Ru particles in BS-Ru/C were very small (1.8 nm), carbon diffusion and growth occurred, unlike the previous report that carbon fiber/tube can be formed only when Ru critical size is not less than 30 nm.37 Compared with the fresh catalyst (Fig. S2†), no change in the Ru particles size was found, different from our previous observation.22 The dissociated carbon expanded laterally, resulting in Ru particles to be surrounded and encapsulated by the deposited carbon, further suppressing Ru particle growth even above 200 °C. The amount of carbon formed during the stability test period using the BS-Ru/C catalyst at 340 °C (1850 g C per g Ru) was significantly higher than that using the conventional catalyst (<801 g C per g metal);41 however, BS-Ru/C is far from deactivated, so long-term H2 stable production could be expected. The material balance (carbon balance and hydrogen balance) of the reaction at 340 °C was calculated as following: H: 1.02, C: 1.00 (C: 0.88 in the deposited carbon; C: 0.12 in CO2).
In principle, according to the mechanisms of the conventional MCD17 and RSM13 processes, both processes firstly begin from CH4 adsorption and its catalytic decomposition to hydrogen and carbonaceous species. The carbonaceous species further dissociates to carbon and H atoms during the MCD reaction, and while it further dissociates to carbon and H atoms, it also reacts with the surface oxygen derived from steam to form CO during the SRM reaction. Simultaneously, CO is converted to CO2 through WGSR. Of course, hydrocarbon formation via the recombination of carbonaceous species35,36,42,43 also cannot be avoided. In both conventional MCD and SRM processes, the rates of methane dissociation, carbon atom diffusion and growth should be equal at the steady state. Only at this condition, carbon does not accumulate on the active surface, which adsorbs and dissociates methane, and each process can proceed smoothly due to the clean active surface employed. If this balance breaks, carbon forms a covering layer on the active surface and the catalyst deactivates. In this research, we achieved the above balance in the low-temperature range of 200–500 °C using a large amount of water to suppress methane dissociation, which resulted in stable hydrogen production. In addition, CO was completely converted to CO2via WGSR, resulting in no CO production.
The H2 yield was not influenced by the Ru amount, so the CH4 step-wise dissociation was reversible, that is, CH4 step-wise dissociation and hydrogenation of the dissociated intermediate CHx occurred simultaneously and reached equilibrium, unlike the previous report.44 The activation energy of methane dissociation reported at low temperatures is 5.9–8.5 kcal mol−1,42,45,46 which is far lower than that of the H2 yield obtained in this research, indicating that methane dissociation was not a rate determining step (RDS), different from the previous literature,47 while carbon diffusion and growth should be RDS. The maximum YCO2 (CO2 yield)/CCH4 (CH4 conversion) ratio (≈0.22) remained almost unchanged at a certain temperature range. In addition, high CH4 concentration ≈ 10% caused the production of another co-product CO at high temperature; however this did not cause any change to the hydrogen amount and the maximum CO2/H2 ratio (≈0.22). Thus, CO2 formation through WGS should be considered as a RDS. Based on the proposed molecular mechanisms summarized in literature,48 the reaction mechanism was considered, and shown in Fig. 10. Cβ and Cγ in Fig. 10 could be reduced by H2.
 | ||
| Fig. 10 The proposed molecular reaction mechanisms for methane decomposition and steam reforming at low temperature. | ||
4. Conclusions
A carbon-supported Ru catalyst (BS-Ru/C) with outstanding ability and stability was prepared using a polygonal barrel-sputtering method. By keeping a balance between methane dissociation, carbon atom diffusion and carbon growth, we achieved more low-temperature stable H2 production from methane. The clean H2 production in conjunction with carbon fixation over the BS-Ru/C catalyst via methane catalytic decomposition (MCD) was found at 200–250 °C. The steam reforming of methane (SRM) over the BS-Ru/C catalyst could occur at 260 °C. Even the by-product CO2 was generated during the SRM process, whereas another by-product CO was not produced. The industrial waste heat as a heat source is enough to achieve this lower-temperature stable H2 production technology. And, this lower-temperature stable H2 production technology will contribute to the realization of a H2 society.Conflicts of interest
There are no conflicts to declare.Acknowledgements
This work was supported by CREST, Japan Science and Technology Agency (Grant number: JPMJCR1442).References
- L. D. Rogatis, T. Montini, B. Lorenzut and P. Fornasiero, Energy Environ. Sci., 2008, 1, 501–509 Search PubMed
.
- R. D. Cortright, R. R. Davda and J. A. Dumesic, Nature, 2002, 418, 964–967 CrossRef CAS PubMed
.
- X. S. Wu and S. Kawi, Energy Environ. Sci., 2010, 3, 334–342 CAS
.
- L. He, J. M. S. Parra, E. A. Blekkan and D. Chen, Energy Environ. Sci., 2010, 3, 1046–1056 CAS
.
- X. Cheng, Y. H. Li, L. R. Zheng, Y. Yan, Y. F. Zhang, G. Chen, S. R. Sun and J. J. Zhang, Energy Environ. Sci., 2017, 10, 2450–2458 CAS
.
- R. B. Chandran, S. Breen, Y. X. Shao, S. Ardo and A. Z. Weber, Energy Environ. Sci., 2018, 11, 115–135 Search PubMed
.
- T. J. Zhang and M. D. Amiridis, Appl. Catal., A, 1998, 167, 161–172 CrossRef CAS
.
- M. A. Ermakova, D. Y. Ermakova and G. G. Kuvshinov, Appl. Catal., A, 2000, 201, 61–70 CrossRef CAS
.
- S. Takenaka, Y. Shigeta and K. Otsuka, Chem. Lett., 2003, 32, 26–27 CrossRef CAS
.
- J. M. Wei and E. Iglesia, J. Phys. Chem. B, 2004, 108, 7253–7262 CrossRef CAS
.
- J. G. Jakobsen, T. L. Jørgensen, I. Chorkendorff and J. Sehested, Appl. Catal., A, 2010, 377, 158–166 CrossRef CAS
.
- M. A. Soria, C. Mateos-Pedrero, P. Marín, S. Ordóñez, A. Guerrero-Ruiz and I. Rodríguez-Ramos, Appl. Catal., A, 2012, 413–414, 366–374 CrossRef CAS
.
- S. D. Angeli, G. Monteleone, A. Giaconia and A. A. Lemonidou, Int. J. Hydrogen Energy, 2014, 39, 1979–1997 CrossRef CAS
.
- T. L. LeValley, A. R. Richard and M. H. Fan, Int. J. Hydrogen Energy, 2014, 39, 16983–17000 CrossRef CAS
.
- V. Palma, M. Martino, E. Meloni and A. Ricca, Int. J. Hydrogen Energy, 2017, 42, 1629–1638 CrossRef CAS
.
- B. W. Wang, S. Albarracín-Suazzo, Y. Pagán-Torres and E. Nikolla, Catal. Today, 2017, 285, 147–158 CrossRef CAS
.
- Y. D. Li, D. X. Li and G. W. Wang, Catal. Today, 2011, 162, 1–48 CrossRef CAS
.
- J. L. Chen, M. He, G. W. Wang, Y. D. Li and Z. H. J. Zhu, Int. J. Hydrogen Energy, 2009, 34, 9730–9736 CrossRef CAS
.
- T. Abe, S. Akamaru and K. Watanabe, J. Alloys Compd., 2004, 377, 194–201 CrossRef CAS
.
- T. Abe, S. Akamaru, K. Watanabe and Y. Honda, J. Alloys Compd., 2005, 402, 227–232 CrossRef CAS
.
- M. Inoue, H. Shingen, T. Kitami, S. Akamaru, A. Taguchi, Y. Kawamoto, A. Tada, K. Ohtawa, K. Ohba, M. Matsuyama, K. Watanabe, I. Tsubone and T. Abe, J. Phys. Chem. C, 2008, 112, 1479–1492 CAS
.
- T. Abe, M. Tanizawa, K. Watanabe and A. Taguchi, Energy Environ. Sci., 2009, 2, 315–321 CAS
.
- J. H. Wee and K. Y. Lee, J. Power Sources, 2006, 157, 128–135 CrossRef CAS
.
- M. C. Demicheli, E. N. Ponzi, O. A. Ferretti and A. A. Yeramian, Chem. Eng. J., 1991, 46, 129–136 CrossRef CAS
.
- I. Alstrup and M. T. Taveres, J. Catal., 1993, 139, 513–524 CrossRef CAS
.
- J. W. Snoeck, G. F. Froment and M. Fowles, J. Catal., 1997, 169, 240–249 CrossRef CAS
.
- I. Kvande, D. Chen, Z. Yu, M. Rønning and A. Holmen, J. Catal., 2008, 256, 204–214 CrossRef CAS
.
- J. L. Chen, X. M. Li, Y. D. Li and Y. N. Qin, Chem. Lett., 2003, 32, 424–425 CrossRef CAS
.
- A. Ananth, D. H. Gregory and Y. S. Mok, Appl. Sci., 2015, 5, 344–358 CrossRef
.
- L. Ma and D. He, Top. Catal., 2009, 52, 834–844 CrossRef CAS
.
- B. Faroldi, C. Carrara, E. A. Lombardo and L. M. Cornaglia, Appl. Catal., A, 2007, 319, 38–46 CrossRef CAS
.
- A. Berman, R. K. Karm and M. Epstein, Appl. Catal., A, 2005, 282, 73–83 CrossRef CAS
.
- T. M. Duncan, P. Winslow and A. T. Bell, J. Catal., 1985, 93, 1–22 CrossRef CAS
.
- T. M. Duncan, J. A. Reimer, P. Winslow and A. T. Bell, J. Catal., 1985, 95, 305–308 CrossRef CAS
.
- M. Belgued, P. Pareja, A. Amariglio and H. Amariglio, Nature, 1991, 352, 789–790 CrossRef CAS
.
- M. C. Wu and D. W. Goodman, J. Am. Chem. Soc., 1994, 116, 1364–1371 CrossRef CAS
.
- M. L. Mabudafhasi, R. Bodkin, C. P. Nicolaides, X. Y. Liu, M. J. Witcomb and N. J. Coville, Carbon, 2002, 40, 2737–2742 CrossRef CAS
.
- S. Helveg, C. Lopez-Cartes, J. Sehested, P. L. Hansen, B. S. Clausen, J. R. Rostrup-Nielsen, F. Abild-Pedersen and J. K. Norskov, Nature, 2004, 427, 426–429 CrossRef CAS PubMed
.
- J. R. Rostrup-Nielsen and D. L. Trimm, J. Catal., 1977, 48, 155–165 CrossRef CAS
.
- I. Alstrup, J. Catal., 1988, 109, 241–251 CrossRef CAS
.
- J. Ashok, P. S. Reddy, G. Raju, M. Subrahmanyam and A. Venugopal, Energy Fuels, 2009, 23, 5–13 CrossRef CAS
.
- T. Koerts, M. J. A. G. Deelen and R. A. van Santen, J. Catal., 1992, 138, 101–114 CrossRef CAS
.
- F. Solymosi, A. Erdohelyi, J. Cserenyi and A. Felvegi, J. Catal., 1994, 147, 272–278 CrossRef CAS
.
- J. Xu and G. F. Froment, AIChE J., 1989, 35, 88–96 CrossRef CAS
.
- M. C. Wu and D. W. Goodman, Surf. Sci. Lett., 1994, 306, L529–L533 CrossRef CAS
.
- J. N. Carstens and A. T. Bell, J. Catal., 1996, 161, 423–429 CrossRef CAS
.
- T. Koerts and R. A. van Santen, J. Mol. Catal., 1991, 70, 119–127 CrossRef CAS
.
- M. H. Halabi, M. H. J. M. de Croon, J. van der Schaaf, P. D. Cobden and J. C. Schouten, Appl. Catal., A, 2010, 389, 80–91 CrossRef CAS
.
Footnote |
| † Electronic supplementary information (ESI) available. See DOI: 10.1039/c7se00572e |
| This journal is © The Royal Society of Chemistry 2018 |

