Small-scale demonstration of the conversion of renewable energy to synthetic hydrocarbons†
Received
2nd June 2017
, Accepted 20th July 2017
First published on 27th July 2017
Abstract
The design and build of a pilot plant for the conversion of solar energy to synthetic hydrocarbons is presented. In addition to technical realization, valuable economic parameters and information about suppliers are presented. The average power of the installation is set to 2 kW, which corresponds to the world average energy consumption of a single person. The main components of the system are photovoltaic cells, batteries, an electrolyser, a metal hydride storage and compression system, a CO2 capture unit and chemical reactors. The installation allows studying the energy flows and reservoirs and the interaction between different components, comparing the performance of competing technologies and establishing an energetic and economic database from the real world. Further, the operating parameters such as pressure, temperatures and energy flows are recorded at different locations to enable for system modeling and advanced optimization techniques to be applied on real data. Last, the degradation of the various components will be investigated under actual working conditions.
Introduction
The twentieth century has seen a vast growth of global energy consumption. This trend allowed an enormous economic and population growth and is expected to continue through most of the 21st century. The current economy is largely based on fossil fuels: in 2013, over 80% of the consumed energy was produced from coal, oil and natural gas, generating important quantities of CO2 emissions.1,2 It is now widely recognized that climate change is mainly due to man-made CO2 emissions by the combustion of fossil fuels.3 Furthermore, the consumption of oil is approximately a million times faster than oil is naturally reproduced. Thus, the resources of fossil fuels are finite. For these reasons, there is a need for a shift from fossil fuels to renewable energy sources. In fact, this transition has already started in several countries. Wind and solar have seen a tremendous development: in Germany, the contribution of solar electricity to the total electrical consumption increased from less than 0.5% in 2005 to 7.5% in 2015.4 However, the increasing share of renewable electricity sources brings about a challenge in terms of energy management: typical renewable electricity sources such as wind and solar undergo daily and seasonal cycles. In fact, this can lead to negative electricity prices, i.e. consumers are paid to consume electricity – just because the grid cannot absorb the production.5 For instance, it nowadays happens that wind farms are paid to shut down their turbines. In England, wind farms were paid £8.7 millions in a single month in 2014 to switch off their turbines.6 Hence, there is a critical need for the conversion and the storage of renewable energy, an solution for the storage of large quantities of energy from intermittent energy sources is required. The most common energy storage methods include pumped-storage hydroelectricity, compressed air and batteries. Hydraulic storage of potential energy offers a high efficiency and a large capacity, but its potential is limited by geographical constraints. Despite impressive progress in the technology development, batteries are very limited in terms of power and energy densities. In fact, barely any storage method can compete with what nature provided us with – hydrocarbons, more so in their liquid form.
The major challenges for energy storage are foremost in two applications fields: mobility and seasonal energy storage. On the one hand, the range of mobility is limited by the gravimetric energy density, especially for aerial transport: in order to store the amount of energy on board of the Airbus A380 at take-off, 12![[thin space (1/6-em)]](https://www.rsc.org/images/entities/char_2009.gif) 545 tons of lithium-ion batteries would be required – around 22 times the total weight of the aircraft at take-off. The seasonal storage, on the other hand, is limited by the costs and amounts of material required to provide for long-term energy storage. Using state-of-the-art battery technology, building a seasonal energy storage system for an average house in Switzerland costs approximately one order of magnitude more than the house. The technical solution to this problem that is now emerging makes use of CO2 capture technology combined with hydrogen produced from renewable energy to produce synthetic hydrocarbons.7,8 This process is summarized in Fig. 1.
545 tons of lithium-ion batteries would be required – around 22 times the total weight of the aircraft at take-off. The seasonal storage, on the other hand, is limited by the costs and amounts of material required to provide for long-term energy storage. Using state-of-the-art battery technology, building a seasonal energy storage system for an average house in Switzerland costs approximately one order of magnitude more than the house. The technical solution to this problem that is now emerging makes use of CO2 capture technology combined with hydrogen produced from renewable energy to produce synthetic hydrocarbons.7,8 This process is summarized in Fig. 1.
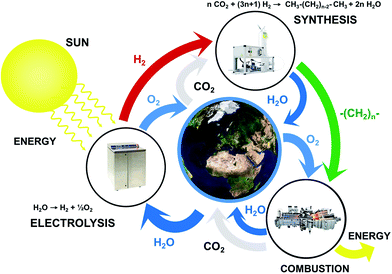 |
| | Fig. 1 Schematic showing the closed cycle integration of renewable energy sources for the production of synthetic hydrocarbons. The elegance of this solution is that there is no net CO2 emissions (adapted from ref. 8). | |
In the first step, hydrogen is produced by the electrolysis of water using excess renewable energy. In parallel, carbon dioxide is captured from the atmosphere. In the second step, hydrogen and carbon dioxide are converted to hydrocarbons. Various hydrocarbons such as methane or methanol can be formed. These synthetic hydrocarbons can then be stored, transported and eventually converted to CO2 and H2O, releasing energy according to the needs. The elegance of this solution is that it provides a closed cycle and does not generate net CO2 emissions: the quantity of carbon dioxide released in the atmosphere during the combustion process is the same as the quantity that was extracted from the air in the first step. Similarly, the amount of water required for electrolysis is rejected in the environment at a later stage. Hence, this process does not generate a net emission of CO2 and does not consume natural resources other than wind and solar. The second huge advantage of this approach is that the technological transformation happens upstream of the consumers, thus ensuring a high popular acceptance. Finally, it allows benefiting from decades of infrastructure building as well as research and development performed in the fields of hydrocarbons energy conversion such as the natural gas distribution grid or the automotive and the power generation industries.
The two main challenges for the realization of the closed cycle are the capture of CO2 from the atmosphere and the controlled reduction of CO2 to a specific product. At the thermodynamic limit, CO2 capture from atmospheric air at a concentration of 400 ppm (0.04%) only requires 19.5 kJ molCO2−1, which corresponds to around 2 to 3% of the energy stored in the final product.9 However, today's state-of-the-art processes are still far from the thermodynamic limit, and much potential for improvement remains. The reduction of CO2 to hydrocarbons can be performed via the Sabatier reaction directly to methane. Alternatively, a two-step process, first with the water–gas shift reaction to CO and subsequently through the Fischer–Tropsch synthesis leads to a wide distribution of products. In the last twenty years, it became possible to synthesize meaningful quantities of monodisperse nanomaterials as highly active and, with the control of the surface structure and coatings, also highly selective catalysts. Therefore, significant progresses are expected in the control of the chemical conversion of hydrogen and CO2 to synthetic fuels in the coming years.
Small-scale demonstrator in Sion
In spite of the fact that most of the individual processes depicted in Fig. 1 have been known for a long time, the integration of the full cycle is an engineering challenge and detailed investigations and analysis of the relevant parameters at a practical scale are missing. The build of the Small-Scale Demonstrator in Sion (SSDS) will exhibit the feasibility of the overall process from solar to synthetic fuels. Furthermore, this unique system will deliver performance data on real conditions and represent an experimental platform where new components can be easily integrated and existing materials can be exchanged by new ones of a later generation. An overview of the installation is shown in Fig. 2.
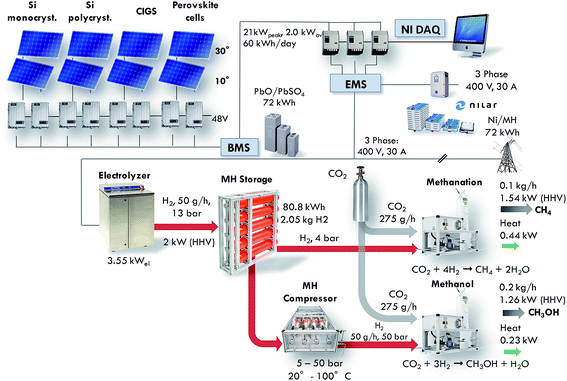 |
| | Fig. 2 Representation of the main components of the Small Scale Demonstrator Sion (SSDS) and key figures of the installation. | |
The main components are the solar cells, batteries for electricity storage, the electrolyser, the metal hydride storage unit, the metal hydride compressor, the CO2 absorber and the chemical reactors. The nominal power of the installation is tailored to provide for the world average power consumption of a person, which amounts to roughly 2000 W.10 The electrical power of the electrolyser amounts to 3.55 kW. This results in the production of 100 g h−1 of synthetic methane or 200 g h−1 of methanol. The power associated with fuels is calculated based on the HHV, and the waste heat from the chemical reactors is deduced from the reaction enthalpy. The build of the SSDS will enable testing the performance and interactions of all the components under real-working conditions. The energy is handled in 4 sectors: (1) solar energy converted by photovoltaics to electricity, (2) electricity converted (DC/DC and DC/AC) and stored in two types of batteries (lead-acid and nickel-metal hydride with a capacity of 72 kW h each), (3) hydrogen produced by mean of water electrolysis and stored in a metal hydride storage with a capacity of 2.05 kg corresponding to 80.8 kW h, and (4) methane and methanol formed from the hydrogen and CO2.
Electricity management
Photovoltaics
The photovoltaic effect was first discovered by the French physicist Edmond Becquerel in 1839.11 However, it took over one century from the discovery of this effect to its first application as a power source for the Vanguard satellite in 1958. Photovoltaic cells first gained interest as a potential power source replacing fossil fuels following the oil crisis in 1973. Gradual development of the technology and the discovery of new types of cells allowed reducing the price from $100/W at the beginning of the 70s to less than $1/W nowadays.12 While silicon based solar cells are by far the prevalent technology in the market, new cell technologies have been developed in an effort to reach even higher conversion efficiencies and lower production costs. Currently, two types of cells are installed at a commercial scale: crystalline silicon cells and thin-film solar cells such as Copper Indium Gallium Selenide (CIGS) cells. In 2015, 93% of the photovoltaic production was generated by Si cells (mono crystal: 23%, poly crystal: 70%) while the remaining 7% was produced by thin film cells.13 In a constant effort to further reduce cost and increase performance, other types of cells have been developed, especially non-silicon based photovoltaic cells including multi-junction cells and perovskite cells.14,15 These technologies are on the way to become mature and penetrate the market. However, the price-performance ratio is still higher than for Si or thin film modules. For the SSDS, four different types of panels have been installed for a total peak power of 21 kW: Si monocrystalline, Si polycrystalline, CIGS and perovskite. Each of the categories is split into two groups of panels, one installed at 30° inclination, the other at 10° inclination. This will enable testing the performance of the different cell types at two different inclinations over an extended period of time under various climatic conditions. The choice of the angles is justified by the fact that an increasing number of flat roofs from industrial buildings are equipped with PV cells. A flat installation is not recommended because snow might accumulate on the panels – thus the 10° inclination for the first group of panels. The second inclination of 30° was chosen as it is commonly used as a standard for PV installations. Further, the degradation of the panels will be investigated under working conditions. A picture of the solar panel installation including the expected sun path is shown in Fig. 3.
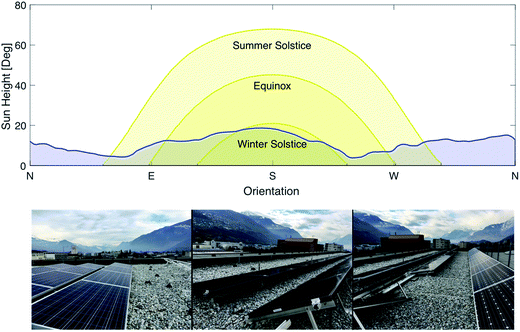 |
| | Fig. 3 Sun path at different times of the year and horizon profile at the location of the photovoltaic plant (top) and pictures of the different panels (bottom). | |
The key parameters of the photovoltaic installation are shown in Table 1. The efficiency reported pertains to the performance at standard conditions (1000 W m−2 irradiation, 25 °C). The peak efficiency was taken from manufacturers' specification sheets. The estimated annual production was calculated using the heuristic rule of 1 kW h produced annually for each watt of photovoltaic power installed. The actual measurement of these values will be one of the important outcomes of the present demonstrator. The costs listed in the second-last column include the cost of the panel and its electrical installation. It does not include the costs of the structural support and the power electronics required. The payback time was calculated using a price of 0.15 CHF per kW per h and a discount rate of 0. It is to be mentioned that the perovskite cells panels are experimental prototypes and are not yet available commercially, which explains the comparatively high price and payback time as compared to the other technologies. The price of the perovskite cells is expected to drop drastically when the technology reaches industrial scale.
Table 1 Key characteristics of the photovoltaic installation
| Type |
Manufacturer |
Inclination |
Orientation |
Area [m2] |
Efficiency [%] |
Peak power [W] |
Est. Ann. production [kW h] |
Cost [CHF] |
Payback time [years] |
| Si mono |
ET Solar |
10° |
South |
21.9 |
16.29 |
3975 |
3975 |
3120 |
5.23 |
| Si mono |
30° |
21.9 |
3975 |
3975 |
3120 |
5.23 |
| Si poly |
ET Solar |
10° |
21.9 |
15.98 |
3900 |
3900 |
3120 |
5.33 |
| Si poly |
30° |
21.9 |
3900 |
3900 |
3120 |
5.33 |
| CIGS |
Solar Frontier |
10° |
14.7 |
13.84 |
2040 |
2040 |
2497 |
8.16 |
| CIGS |
30° |
14.7 |
2040 |
2040 |
2497 |
8.16 |
| Perovskite |
Solaronix SA |
10° |
8 |
5.6 |
490 |
490 |
21![[thin space (1/6-em)]](https://www.rsc.org/images/entities/char_2009.gif) 956 956 |
298.7 |
| Perovskite |
30° |
8 |
490 |
490 |
21![[thin space (1/6-em)]](https://www.rsc.org/images/entities/char_2009.gif) 956 956 |
298.7 |
Power electronics
The power produced by the photovoltaic installation is handled using eight DC/DC converters of the type Studer XTS-1200-24. Each group of panels corresponding to one line in Table 1 is controlled by a separate converter. This allows collecting individual data for the different groups of panels. The Studer devices also control the current of the panel such that the power production is maximized. Depending on the energy levels in the different components of the system, the electricity flows either directly in the lead batteries or to the reference point of the electrical system. The reference point is set to three-phase power at 400 V, which is compatible with the electric grid. This is achieved using three DC/AC inverters of the type Studer XT-8000-48. From there, the current is dispatched either to the metal hydride batteries or to the different consumers. The metal hydride batteries are connected via a separate inverter of the type ABB ESI-M50-IP-30. The products reference, manufacturers and key specifications are shown in Table 2.
Table 2 Key characteristics of the inverters and transformers
| Component |
Model |
Manufacturer |
Voltage [V] |
Rating [kW] |
Efficiency [%] |
Cost [CHF] |
|
Peak rating is 21 kW for 5 seconds.
|
| DC/DC converter |
VT-80 |
Studer Innotec SA |
120 V DC–48 V DC |
5 |
>99% |
4436 |
| DC/AC inverter |
XT-8000-48 |
Studer Innotec SA |
48 V DC–400 V AC |
7a |
96% |
13![[thin space (1/6-em)]](https://www.rsc.org/images/entities/char_2009.gif) 268 268 |
| AC/DC inverter |
ESI-S-M50-IP30 |
ABB |
400 V AC–120 V DC |
50 |
N/A |
9850 |
| DC/DC converter |
TPK19177 |
Transformator-Teknik AB |
120 V DC–120 V DC |
30 |
98.3% |
N/A |
Batteries
Batteries are key elements for short-term electricity buffer. They offer high round-trip efficiencies and are therefore complementary to hydrogen storage systems that can be used for long-term storage. Lead acid batteries is the most developed technology and dominates the market.16 Nickel metal hydrides batteries are interesting as they offer an alternative to lead batteries that requires minimal maintenance and does not contain any hazardous materials. Lithium ion batteries have seen a tremendous development in the past decade, mostly driven by the advent of ever more powerful consumer electronics. Lithium ion batteries reach high gravimetric energy densities of up to 150 W h kg−1.17 However, their relatively high price and advanced thermal management required for safety concerns do not justify their use in stationary applications, where weight is generally not a main criterion. Therefore, it was decided to install two types of commercially available batteries in the demonstrator: lead acid batteries and nickel metal hydrides batteries. Both battery systems have a capacity of 72 kW h. The total battery storage capacity should enable storing up to three days of photovoltaic production. The key specifications of both battery installations are listed in Table 3. It is noted that the costs listed only represent the cost of the batteries and do not include the power electronics neither the installation and commissioning of the batteries.
Table 3 Key characteristics of the two battery installations
| Component |
Model |
Supplier |
Capacity per unit [W h] |
Weight per unit [kg] |
Units |
Capacity total [kW h] |
Lifetime [cycles] |
Cost [CHF] |
|
The lifetime is given considering a discharge rate of 80%.
|
| Pb batteries |
12OPZYV SP1500 |
Hoppecke GmbH |
3000 |
94.6 |
24 |
72 |
1600a |
15![[thin space (1/6-em)]](https://www.rsc.org/images/entities/char_2009.gif) 707 707 |
| MH batteries |
10E-120-10-PTAIL |
Nilar AB |
1200 |
29 |
60 |
72 |
2000 |
42![[thin space (1/6-em)]](https://www.rsc.org/images/entities/char_2009.gif) 770 770 |
Hydrogen production, storage and compression
Electrolysis
The hydrogen is produced by mean of water electrolysis. There exist three types of electrolysers: alkaline, solid oxide (SOEC) and Polymer Electrolyte Membrane (PEM). Alkaline devices are only available for the large scale production of hydrogen. SOEC operate at elevated temperatures and are not available commercially yet. Therefore, a PEM electrolyser was chosen for the SSDS. The electrolyser installed is of the type Hogen S20 with a production capacity of 0.53 N m3 h−1. The nominal efficiency amounts to 53%. The produced hydrogen is delivered at a pressure of 13.8 bar and a purity over 99.9995%, two important criteria for the storage in metal hydrides. The key parameters of the electrolyser are summarized in Table 4.
Table 4 Key characteristics of the electrolyser
| Electrolyser |
Producer |
Supplier |
Power [kW] |
Hydrogen production [g h−1] (N m3 h−1) |
Efficiency |
Cost [CHF] |
| Hogen S20 |
Proton onsite |
Diamondlite SA |
3.55 |
47.3 (0.53) |
53% |
93![[thin space (1/6-em)]](https://www.rsc.org/images/entities/char_2009.gif) 000 000 |
Hydrogen storage
Despite the fact that hydrogen has the highest gravimetric energy density (142 MJ kg−1 HHV) of all combustibles, the low volumetric density in the gas (89 g m−3) is a challenge in terms of storage. A detailed review of hydrogen storage technologies is provided in ref. 18 and 19. Hydrogen can be stored as a gas in pressurized vessels, in its liquid phase in cryogenic tanks (21.2 K at ambient pressure) or as a solid in metal or complex hydrides. However, pressurized and liquid hydrogen both have major drawbacks. Hydrogen under pressure exhibits a low volumetric density: even using composite materials withstanding pressure up to 800 bar, the maximal hydrogen density is 40 kgH2 m−3. Further, there are obvious safety issues inherent to the high pressures of such systems. Liquid hydrogen, on the other hand, has a higher volumetric density. Yet, the minimal energy required for the liquefaction amounts 7.8 kW h kg−1 – about 20% of the higher heating value of hydrogen.20,21 Additionally, passive heat transfer to the environment lead to losses of a few percent per day. Therefore, hydrides have emerged as a potential alternative to store hydrogen in a safe and efficient manner. Hydrides are classified in two categories: metal hydrides and complex hydrides. A plot of the gravimetric and volumetric energy densities are shown for different storage methods in Fig. 4, showing the superior performance of hydrides as compared to conventional energy storage technologies.
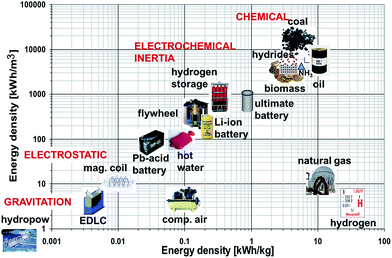 |
| | Fig. 4 Gravimetric and volumetric hydrogen densities for different storage methods (adapted from ref. 8). | |
Metal hydrides typically exhibit a very high volumetric density of up to 150 kg m−3. However, the gravimetric density is limited to less than 5% mass of hydrogen. The absorption and desorption processes occur at temperature close to ambient for selected metal hydrides. On the other hand, the formation of complex hydrides often times required elevated temperature (>600 K). Therefore, a metal hydride system was chosen to store hydrogen in the SSDS. The alloy used is of the type (LaCe)(NiCoMn)5 and has a hydrogen capacity of 1.4% mass. Currently, the price of this type of alloy is still mostly driven by the cost of processing. However, a large upscaling of this storage technology might result in increasing prices for the raw materials. The pressure–temperature relationship at equilibrium is given by the Van't Hoff eqn (1). A direct correlation between pressure and temperature at equilibrium is deduced for absorption and desorption as shown in eqn (1). The absorption and desorption processes are exothermic and endothermic, respectively. The pressure – composition isothermals of the metal hydride were measured using a GRZ AGAS system in the dynamic mode, with a flow rate equivalent to 1 N mL per min per gram of material. The isotherms and the corresponding Van't Hoff plot are shown in Fig. 5 and 6, respectively. The deduced enthalpy and entropy of reaction are calculated and summarized in Table 5.
| |  | (1) |
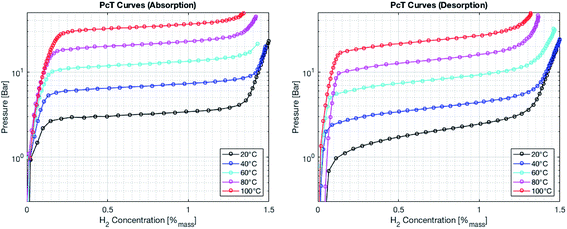 |
| | Fig. 5 Pressure–composition isotherms for the absorption process (left) and the desorption process (right). | |
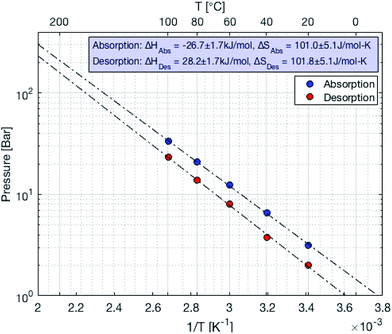 |
| | Fig. 6 Van't Hoff plot of the metal hydride (LaCe)(NiCoMn)5 used in the storage system and the compressor. | |
Table 5 Parameters for pressure–temperature equilibrium pressure relationship
|
|
Absorption |
Desorption |
| ΔHf [kJ mol−1] |
−26.7 ± 1.7 |
101.0 ± 5.1 |
| ΔS [J mol−1 K−1] |
28.2 ± 1.7 |
101.8 ± 5.1 |
The storage system is designed to have a capacity of at least 72 kW h in order to be comparable to the battery stacks. This corresponds to 1.85 kg of hydrogen based on the HHV. Thus, 132 kg of the alloy are necessary. The alloy is available in pellets with a size of 9.5 mm and its bulk density was measured to 4200 kg m−3. Due to material expansion upon hydrogen absorption, the filling rate should not exceed 70% of the volume of the container based on the bulk density of the alloy. Therefore, a volume of at least 44.9 L is necessary. Thus, five pressure gas cylinders from Eurocylinder Systems AG with a volume of 10 liters are used. The steel bottles are made of 34CrMo4 steel. The minimal wall thickness is 3.6 mm. The cylinders are tested up to 300 bar and certified for pressures up to 200 bar. In order to use the full capacity of the gas cylinders, a total of 147 kg of alloy is inserted in the cylinder, resulting in a theoretical hydrogen storage capacity of 2.05 kg, which corresponds to 80.8 kW h. A schematic and a picture of the storage unit is shown in Fig. 7. One of the main advantages of the presented hydrogen storage unit is the low pressure in the system, ensuring a high level of safety.
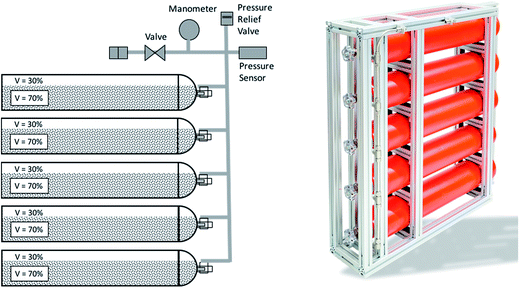 |
| | Fig. 7 Schematic (left) and picture of the metal hydride storage unit. The cylinders are filled with the alloy LaCeNiCoMn and have a total hydrogen storage capacity of 2.05 kg. | |
The hydrogen absorption in the storage system is thermally limited. Because the electrolyser provides hydrogen under a pressure of up to 13.8 bar, the maximal refueling temperature amounts to 56 °C. The passive heat losses of the system at this temperature are calculated following eqn (2). Thereby, TMH is the equilibrium temperature of the metal hydrides (56 °C), TAmb is the ambient temperature, RCond is the conductive thermal resistance of the walls and RConv is the convective heat transfer resistance between the outer wall and the ambient air. The thermal resistances RCond and RConv are calculated following established methods.22 The total heat transfer surface area amounts to 2.27 m2. The overall thermal resistance was calculated to 0.088 K W−1 using a convective heat transfer coefficient of 10 W m−2 K−1, which is a typical value for natural convection. Thereby, the losses by conduction and radiation were neglected. Further, the contact resistance between the alloy and the inner surface of the cylinder was assumed to be negligible. The total heat losses were therefore calculated to 699 W. The maximal hydrogen desorption rate is subsequently calculated following eqn (3) and matching the amount of heat generated by the absorption reaction to the amount of heat passively dissipated. It is estimated that the maximal desorption rate amounts to 86.6 mol h−1 or 173.1 g h−1, which is superior to the 50 g h−1 delivered by the electrolyser.
| |  | (2) |
| | ![[Q with combining dot above]](https://www.rsc.org/images/entities/i_char_0051_0307.gif) Gen = ṅH2ΔHR Gen = ṅH2ΔHR | (3) |
Similarly, the maximal desorption pressure is limited by the rate of heat transfer between the storage system and the ambient. By combining eqn (1)–(3), the maximal desorption pressure is calculated to 2.42 bar.
The weight and volume of the different components of the metal hydride storage system is shown in Table 6. The total volume of the system amounts to 206 L, for a storage capacity of 2.05 kg of hydrogen – or 80.8 kW h based on the HHV. This gives a volumetric energy density of 393 kW h m−3. The gravimetric energy density is calculated to 0.32 kW h kg−1.
Table 6 Weight and volume of the different components of the metal hydride storage system (255 kg, 206 liters)
| Component |
Supplier |
Weight [kg] |
Volume [L] |
Price [CHF] |
| Alloy |
Santoku Corp. |
147 |
35 |
5880 |
| Cylinders (per unit) |
Eurocylinder Systems AG |
68 (13.6) |
50 (10) |
890 (178) |
| Fittings, valves, manometer |
Swagelok |
5 |
N/A |
1460 |
| Frame |
Item 24 |
35 |
206 |
1280 |
Hydrogen compression
In order to obtain the level of pressure required in the chemical reactors, the thermodynamic properties of the phase transition in metal hydrides are used in a thermally driven metal hydride compressor. The metal hydrides compressor is based on the relationship between pressure and temperature given by eqn (1). The metal hydride compressor works between two temperature levels. The cold temperature level is set by the temperature of the cooling fluid, which is water at 10 °C. The hot temperature level is defined by the desorption pressure requirement of 50 bar, which corresponds to a temperature of 107.8 °C. Thus, by selectively heating the cylinder vessel up to 107.8 °C, the pressure is increased up to 50 bar. The compressor consists of four 1 L cylinders working in a sequential cycle of four steps: in the first step, the cylinder is filled with hydrogen. In the second step, it is heated up to reach the desired pressure. Next, hydrogen is released. Finally, the cylinder is cooled down to its original temperature. As the system consists of four cylinders working in a staggered sequence, it is possible to provide pressurized hydrogen continuously. A graphical representation of the metal hydride compressor and a picture are shown in Fig. 8.
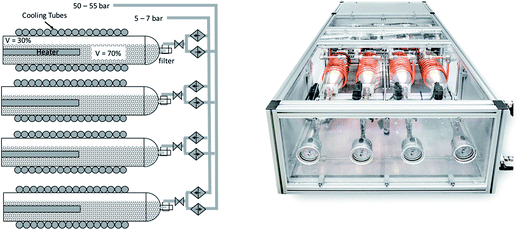 |
| | Fig. 8 Schematic (left) and actual picture of the metal hydrides compressor. | |
CO2 capture
The capture of carbon dioxide was first considered in conjunction with large scale storage as a transition solution for the mitigation of climate change – a technology known as Carbon Capture and Storage (CCS).23 Two different approaches are taken for the capture of CO2: extraction of carbon dioxide from atmospheric air, or capture at large point source (i.e. natural gas power generation plants, incineration plants, etc.). The first approach certainly poses a challenge in terms of economic and energetic efficiencies as the concentrations of CO2 in the atmosphere are much lower than in a flue gas stream.24 In fact, coal fired power plants have CO2 concentrations of up to 10–15%.25 The theoretical amount of energy required to extract CO2 from atmospheric air can be computed following eqn (4), where PCO2 is the partial pressure of CO2 in the incoming stream and P0 is the total pressure of the gas to be separated.26 Thereby, it is assumed that there is an infinite reservoir of gas – in our case atmospheric air – with a partial pressure PCO2. Thus, the theoretical quantity of energy required to extract CO2 from a concentration of 400 ppm (0.04%) amounts to 19.4 kJ mol−1. As a comparison, extracting carbon dioxide from a flue gas of a coal power plant with a CO2 concentration of 10% requires only 5.7 kJ mol−1.| |  | (4) |
The key advantage of atmospheric carbon capture versus CO2 extraction from flue gases is that it represents the only uncontroversial way to close the cycle shown in Fig. 1. For instance, capturing CO2 from a cement plant does not really compensate for the emissions produced by the combustion of carbon fuels in cars or planes. Therefore, the carbon dioxide capture unit planned for the demonstrator will be installed on the roof of the building and extract CO2 directly from the atmosphere.
Synthetic fuels production
The production of synthetic fuels is not a totally new idea. The reaction of hydrogen with carbon dioxide to methane and water was discovered by French Chemist Paul Sabatier at the beginning of the 20th century.27 A few years later, Franz Fischer and Hans Tropsch developed a process to convert carbon monoxide and hydrogen to hydrocarbons. The so called Fischer Tropsch process gained increasing interest around the period of World War II, albeit not for ecological concern but rather to reduce Germany's dependence on foreign fuels.27–29 Owing to increasing CO2 emissions and climate change concerns, a renewed interest in hydrocarbons synthesis was observed.30 In the presented demonstrator, the focus is laid on the synthesis of methane and methanol out of atmospheric carbon dioxide and solar hydrogen. Methane is chosen because the infrastructure for distribution and the technology for combustion is largely available: vehicles running on compressed natural gas already exist, and most countries have a distribution grid for natural gas. Methanol is chosen because, unlike methane, it is liquid at standard conditions. Hence, it is easier to store as a fuel because of its higher volumetric density. The corresponding chemical reactions are shown in eqn (5) and (6), respectively.| |  | (5) |
| |  | (6) |
The reactor design was made using thermodynamic and kinetic modeling shown below for the methanation reaction. This reaction is exothermic and the entropy is negative, therefore the equilibrium shifts from products to reactants with increasing temperature. The kinetics follow the Arrhenius relationship and increases exponentially with temperature. Thus, the selection of an adequate catalyst is crucial in order to maximize the CO2 conversion. The conversion limit at equilibrium for the methanation reaction is calculated following eqn (8) and shown in black in Fig. 9. Further, the actual conversion for different activation energies are calculated following eqn (9) and (10) and shown in the same figure. Thereby, the pre-exponential factor is set to 1000 s−1. The reaction rate on the temperature is plotted in blue. The thermodynamics values used for these calculations were taken from ref. 31.
| |  | (8) |
| |  | (9) |
| |  | (10) |
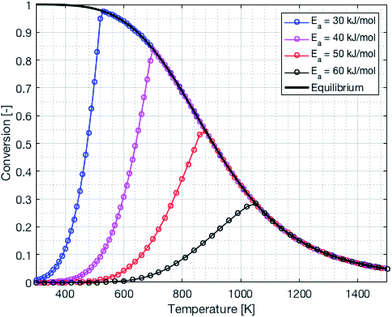 |
| | Fig. 9 Thermodynamic equilibrium and kinetics for the methanation reaction as a function of the temperature. | |
As both reactions are exothermic, a careful thermal management system has to be implemented. A schematic and a technical drawing of the chemical reactor for the methanation synthesis is shown in Fig. 10. The tubes shown in blue are cooling tubes. Cooling water at a temperature of 20 °C and a flow rate of 1 mL min−1 is required in order to maintain the temperature at the level such that the yield is maximized. The reactants are fed trough the inner, 6 mm diameter green tube seen in Fig. 10. The gases flow back through a catalyst bed and the products exit the reactor in the outer, 12 mm diameter dark green tube. The reactor for methanol synthesis has a similar design.
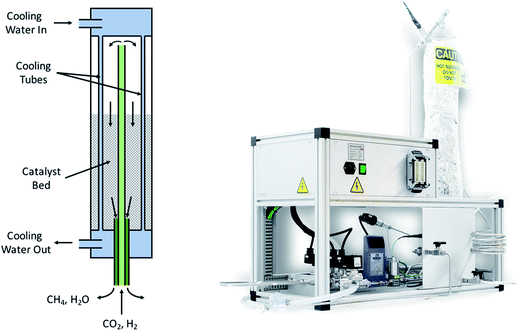 |
| | Fig. 10 Schematic of the methanation reactor (left) and actual picture of the reactor. The reactants enter the chemical reactor through the inner, light green tube and go through a catalyst bed. The resulting products exit via the outer, dark green tube. The reactor is cooled by embedded water tubes. | |
System modeling and optimization
One of the interesting aspects of the present project is the establishment of a database for the study of energy fluxes between the different components such as batteries, electrolyser, hydrogen storage etc. Such a database is crucial for system modeling and optimization. To that purpose, a wide array of pressure, temperature and mass flow sensors are inserted in the installation in order to monitor the individual processes and to determine optimal operating parameters.
Installation, infrastructure and safety
All the components shown in Fig. 2 but for the solar panels and the carbon capture system will be located in a room. Therefore, special measures have to be taken to ensure a safe operation. Two parameters are of critical importance: ventilation and thermal management. An adequate ventilation is necessary to prevent a mixture of hydrogen and air in the inflammability range (4–75% volume). The advantage of metal hydrides as compared to conventional pressurized hydrogen vessels is twofold: first, the equilibrium pressure within the vessel is low (<10 bar). Second, the hydrogen release is thermally limited: because the desorption reaction is endotherm, heat has to be provided in order to maintain a pressure above atmospheric and thus sustain hydrogen desorption. The design of the ventilation system is done by assuming the worst case scenario of a simultaneous failure of all storage vessels. The passive heating power of the ambient to the tanks is equated to the cooling power of the desorption reaction to obtain the maximal hydrogen release rate. The ventilation flow rate has to be superior to 25 times the hydrogen flow rate in order to remain outside of the inflammability range. For the present system, the passive release rate of hydrogen is calculated to 0.25 m3 h−1. The total room ventilation flow rate is 225 m3 h−1, thus limiting the hydrogen concentration to 0.11%, which is well below the safety limit. In addition, the room is provided with hydrogen and carbon monoxide detectors. Thermal management of the demonstrator installations is equally important. The main heat generation sources are the electrolyser, the inverters for the solar panels and the chemical reactors, which are all located in the same room. Therefore, careful design has to be implemented to avoid increasing temperatures and subsequent failures of instruments. In the present case, the total peak heating power rejected to ambient is computed to 3.5 kW with the main contribution generated by the electrolyser (1.9 kW). An A/C module with a cooling power of 3.7 kW is included in the room to ensure a reasonable operating temperature of the installation.
Conclusion
It is common to hear that technologies to shift from a fossil based – to a renewable energy based economy already exist. While this is certainly true to a certain extent, there is often time some confusion regarding the gap between a technology working in the lab and one that is produced at a large scale, fulfilling not only technical but also economic criteria. The present project aims at partially closing that gap by offering a testing platform to evaluate commercially available and emerging technologies related to the synthetic hydrocarbons cycle. Because of the intermediate size of the system, it allows testing and adapting the installation under realistic working conditions and at moderate cost. The small scale demonstrator Sion will provide performance data and test the degradation of the various components over an extended period of time. It is intended to be a dynamic project, offering a chance to foster exchange between academic and industrial partners. Besides demonstrating the viability of the synthetic hydrocarbons cycle from a technical perspective, it is to hope that this project will help emerging technologies to get one step closer to becoming a mass product.
Acknowledgements
The financial support from the Canton Valais, from the SCCER (CTI) Work Package Heat and Electricity Storage, from Gaznat SA and from Energie Sion Région (ESR) is gratefully acknowledged.
Notes and references
-
Key World Energy Statistics, Organisation for Economic Co-operation and Development, Paris, 2015 Search PubMed.
-
UN. Population Division, World Population, UN, 2015 Search PubMed.
-
T. F. Stocker, et al., IPCC: Climate Change 2013: The Physical Science Basis. Contribution of Working Group I to the Fifth Assessment Report of the Intergovernmental Panel on Climate Change, 2013 Search PubMed.
-
H. Wirth and K. Schneider, Recent facts about photovoltaics in Germany, Rep. Fraunhofer Inst. Sol. Energy Syst. Ger., 2013 Search PubMed.
- E. Fanone, A. Gamba and M. Prokopczuk, The case of negative day-ahead electricity prices, Energy Econ., 2013, vol. 35, 22–34 CrossRef.
-
B. J. O'Callaghan, Wind turbines are being paid millions to turn OFF, Mail Online, 03-Apr-2014, Online, http://www.dailymail.co.uk/sciencetech/article-2595902/Wind-farms-paid-millions-switch-OFF-turbines-generate-electricity.html, Accessed: 05-Sep-2016.
- G. Gahleitner, Hydrogen from renewable electricity: an international review of power-to-gas pilot plants for stationary applications, Int. J. Hydrogen Energy, 2013, vol. 38(5), 2039–2061 CrossRef.
- A. Züttel, P. Mauron, S. Kato, E. Callini, M. Holzer and J. Huang, Storage of Renewable Energy by Reduction of CO2 with Hydrogen, Chim. Int. J. Chem., 2015, vol. 69(5), 264–268 CrossRef PubMed.
- K. S. Lackner, Capture of carbon dioxide from ambient air, Eur. Phys. J. Spec. Top., 2009, vol. 176(1), 93–106 CrossRef.
- F. Marechal, D. Favrat and E. Jochem, Energy in the perspective of the sustainable development: the 2000 W society challenge, Resour., Conserv. Recycl., 2005, vol. 44(3), 245–262 CrossRef.
- R. Williams, Becquerel Photovoltaic Effect in Binary Compounds, J. Chem. Phys., 1960, vol. 32(5), 1505–1514 CrossRef.
-
J. Perlin, From space to earth: the story of solar electricity, Earthscan, 1999 Search PubMed.
-
S. Philipps and W. Warmuth, Photovoltaics Report, Frauenhofer Institute for Solar Energy, 2016 Search PubMed.
- A. G. Pattantyus-Abraham,
et al., Depleted-heterojunction colloidal quantum dot solar cells, ACS Nano, 2010, vol. 4(6), 3374–3380 CrossRef PubMed.
- P. Gao, M. Grätzel and M. K. Nazeeruddin, Organohalide lead perovskites for photovoltaic applications, Energy Environ. Sci., 2014, vol. 7(8), 2448–2463 Search PubMed.
- T. M. I. Mahlia, T. J. Saktisahdan, A. Jannifar, M. H. Hasan and H. S. C. Matseelar, A review of available methods and development on energy storage; technology update, Renewable Sustainable Energy Rev., 2014, vol. 33, 532–545 CrossRef.
- M. M. Thackeray, C. Wolverton and E. D. Isaacs, Electrical energy storage for transportation—approaching the limits of, and going beyond, lithium-ion batteries, Energy Environ. Sci., 2012, vol. 5(7), 7854–7863 Search PubMed.
- L. Schlapbach and A. Züttel, Hydrogen-storage materials for mobile applications, Nature, 2001, vol. 414(6861), 353–358 CrossRef PubMed.
- A. Züttel, Hydrogen storage methods, Naturwissenschaften, 2004, vol. 91(4), 157–172 CrossRef PubMed.
- S. Krasae-in, J. H. Stang and P. Neksa, Development of large-scale hydrogen liquefaction processes from 1898 to 2009, Int. J. Hydrogen Energy, 2010, vol. 35(10), 4524–4533 CrossRef.
- K. Ohlig and L. Decker, Hydrogen, 4. Liquefaction, Encycl. Ind. Chem., 2013, 1–6 Search PubMed.
-
T. L. Bergman, F. P. Incropera, D. P. DeWitt and A. S. Lavine, Fundamentals of heat and mass transfer, John Wiley & Sons, 2011 Search PubMed.
-
B. Smit, J. A. Reimer, C. M. Oldenburg and I. C. Bourg, Introduction to Carbon Capture and Sequestration, vol. 1, World Scientific, 2014 Search PubMed.
- K. Z. House, A. C. Baclig, M. Ranjan, E. A. van Nierop, J. Wilcox and H. J. Herzog, Economic and energetic analysis of capturing CO2 from ambient air, Proc. Natl. Acad. Sci. U. S. A., 2011, vol. 108(51), 20428–20433 CrossRef PubMed.
- J. P. Ciferno, T. E. Fout, A. P. Jones and J. T. Murphy, others, Capturing carbon from existing coal-fired power plants, Chem. Eng. Prog., 2009, vol. 105(4), 33 Search PubMed.
- T. Wang, K. S. Lackner and A. B. Wright, Moisture-swing sorption for carbon dioxide capture from ambient air: a thermodynamic analysis, Phys. Chem. Chem. Phys., 2013, vol. 15(2), 504–514 RSC.
- H. Taylor, Paul Sabatier 1854-1941, J. Am. Chem. Soc., 1944, vol. 66(10), 1615–1617 CrossRef.
- D. Leckel, Diesel Production from Fischer–Tropsch: The Past, the Present, and New Concepts, Energy Fuels, 2009, vol. 23(5), 2342–2358 CrossRef.
- H. Schulz, Short history and present trends of Fischer–Tropsch synthesis, Appl. Catal., A, 1999, vol. 186(1–2), 3–12 CrossRef.
- W. Wang, S. Wang, X. Ma and J. Gong, Recent advances in catalytic hydrogenation of carbon dioxide, Chem. Soc. Rev., 2011, vol. 40(7), 3703–3727 RSC.
-
S. G. Lias, J. E. Bartmess, J. F. Liebman, J. L. Holmes, R. D. Levin and W. G. Mallard, NIST Chemistry WebBook, NIST Stand. Ref. Database, no. 69, 2003, p. 20899 Search PubMed.
Footnote |
| † Whenever prices in foreign currencies were given, the following conversion factors were applied: CHF to USD 1.0:1.0, CHF to EUR 1.1:1.0. The prices indicated include the VAT (8%). |
|
| This journal is © The Royal Society of Chemistry 2017 |
 ab,
Jérémie
Bérard
ab,
François
Abbet
ab and
Andreas
Züttel
*ab
ab,
Jérémie
Bérard
ab,
François
Abbet
ab and
Andreas
Züttel
*ab
![[thin space (1/6-em)]](https://www.rsc.org/images/entities/char_2009.gif) 545 tons of lithium-ion batteries would be required – around 22 times the total weight of the aircraft at take-off. The seasonal storage, on the other hand, is limited by the costs and amounts of material required to provide for long-term energy storage. Using state-of-the-art battery technology, building a seasonal energy storage system for an average house in Switzerland costs approximately one order of magnitude more than the house. The technical solution to this problem that is now emerging makes use of CO2 capture technology combined with hydrogen produced from renewable energy to produce synthetic hydrocarbons.7,8 This process is summarized in Fig. 1.
545 tons of lithium-ion batteries would be required – around 22 times the total weight of the aircraft at take-off. The seasonal storage, on the other hand, is limited by the costs and amounts of material required to provide for long-term energy storage. Using state-of-the-art battery technology, building a seasonal energy storage system for an average house in Switzerland costs approximately one order of magnitude more than the house. The technical solution to this problem that is now emerging makes use of CO2 capture technology combined with hydrogen produced from renewable energy to produce synthetic hydrocarbons.7,8 This process is summarized in Fig. 1.


![[thin space (1/6-em)]](https://www.rsc.org/images/entities/char_2009.gif) 956
956![[thin space (1/6-em)]](https://www.rsc.org/images/entities/char_2009.gif) 956
956![[thin space (1/6-em)]](https://www.rsc.org/images/entities/char_2009.gif) 268
268![[thin space (1/6-em)]](https://www.rsc.org/images/entities/char_2009.gif) 707
707![[thin space (1/6-em)]](https://www.rsc.org/images/entities/char_2009.gif) 770
770![[thin space (1/6-em)]](https://www.rsc.org/images/entities/char_2009.gif) 000
000


![[Q with combining dot above]](https://www.rsc.org/images/entities/i_char_0051_0307.gif) Gen = ṅH2ΔHR
Gen = ṅH2ΔHR


