 Open Access Article
Creative Commons Attribution 3.0 Unported Licence
A functionalized metal–organic framework decorated with O− groups showing excellent performance for lead(II) removal from aqueous solution†
Caixia
Yu
ab,
Zhichao
Shao
a and
Hongwei
Hou
 *a
*a
aCollege of Chemistry and Molecular Engineering, Zhengzhou University, Zhengzhou 450001, P. R. China. E-mail: houhongw@zzu.edu.cn
bHenan Key Laboratory of New Optoelectronic Functional Materials, College of Chemistry and Chemical Engineering, Anyang Normal University, Anyang 455000, P. R. China
First published on 18th September 2017
Abstract
Heavy metal ions are highly toxic and widely spread as environmental pollutants. New strategies are being developed to efficiently remove these toxic ions. Herein, we use the intrinsic advantages of metal–organic frameworks (MOFs) and develop a porous Zn(II)-based MOF decorated with O− groups for the removal of Pb2+. Benefiting from its multiple porosity, sufficient adsorption sites and strong affinity, the activated MOF material exhibits an ultrahigh Pb2+ uptake capacity (616.64 mg g−1), surpassing all those of reported MOF adsorbents. Moreover, it can selectively capture Pb2+ with high efficiency (>99.27%) against background ions. Even in the presence of a high concentration of competitive ions, such as Ca2+ or Mg2+, effective removal (>99.21%) can also be achieved in a short time. The excellent removal performance demonstrates the strong electrostatic attraction and coordination interaction between the highly accessible O− groups and Pb2+. The possible adsorption mechanism was systematically verified by zeta potential, FT-IR and XPS studies. Our work reveals the enormous potential of functionalized MOFs as an appealing platform to construct sorbent materials.
Introduction
Lead (Pb2+), a prevalent and bio-accumulative heavy metal, has been recognized as one of the most toxic metals.1 With the rapid growth of industrialization and urbanization, Pb2+ discharge has become a serious environmental concern.2 At present, available clean water is limited and 90% of the available fresh water will be consumed by 2025.3 Almost all countries strive to remove Pb2+ from potable water in order to reduce levels of elevated blood Pb2+ in children.4 Owing to this fact, the removal of Pb2+ from water is critical in terms of the protection of public health and the environment. Many efforts have been dedicated to purify wastewater to get more available clean water. However, an efficient, cost-effective, robust and handy technology for the decontamination of water is urgently needed. The adsorption technique for removing heavy metal ions has gained extensive attention considering the easy operation, eco-friendliness and cost-effectiveness.1,5 Some effective adsorbents have been continuously developed and improved, including zeolites,6 carbon materials,7 clay minerals,8 nanomaterials9,10 and chelating polymers.11 Meanwhile, those sorbents face some challenges, such as a low capacity, a moderate affinity/selectivity, difficulties in separation, and a lack of structural and functional tunability,12 which have largely limited the effectiveness for Pb2+ removal. Therefore, there is an increasing interest in developing more efficient absorbents for the removal of Pb2+ from aqueous solution.Metal–organic frameworks (MOFs), constructed by metal ions or metal clusters and organic ligands through coordination bonds, are considered as a favorable platform for adsorption applications,13–15 because of their high surface area, tunable chemical composition, variable pore size distribution and exposed active sites.16–18 By ligand modifications or MOF post-functionalization, various functional groups can be purposefully incorporated into the pores of MOFs, giving rise to more active sites for facile adsorption. The functionalized MOFs decorated with neutral groups, such as thiol/thioether/hydroxyl/azine/sulphur-functional groups, were exploited for the removal of Pb2+, UO2+, Cd2+, Hg2+, etc. from aqueous solution.5,19–29 Two elaborately constructed sulphur-functionalized MOFs, FJI-H9 and FJI-H12, could selectively remove Cd2+ and Hg2+ from water with high uptake capacities (286 mg g−1 for Cd2+ and 439.8 mg g−1 for Hg2+).28,29 Nonetheless, the introduction of negatively charged groups into MOFs for the highly efficient removal of heavy metal ions has rarely been reported.
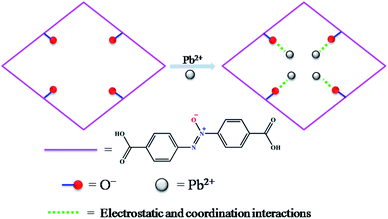
Herein, a functionalized MOF decorated with negatively charged O− groups was designed and applied to the removal of Pb2+ from aqueous solution (Scheme 1). Based on the design, the negative charges of the O− groups generate electrostatic interaction with Pb2+, which acts as a driving force in the adsorption process. Secondly, the O− groups also worked as active sites to form coordination bonds with Pb2+. Thirdly, as a Lewis acid, Pb2+ has a lower hydration energy and a larger ionic radius, and could readily accept electrons from the Lewis base of the O− groups. As a result, the O− groups show a significant affinity and high selectivity for Pb2+. Fourthly, the multiple porosity densely populated with O− groups would endow Pb2+ with fast sorption and a high removal efficiency. In this study, we synthesized a three-dimensional (3D) porous framework {[Zn3L3(BPE)1.5]·4.5DMF}n (1, H2L = 4,4′-azoxydibenzoic acid, BPE = bis(4-pyridyl)ethylene, DMF = N,N-dimethylformamide) functionalized with O− groups for the removal of Pb2+. The activated MOF material [Zn3L3(BPE)1.5]n (1a) exhibited an ultrahigh uptake capacity (616.64 mg g−1), a very high affinity (Kd 106 mL g−1) and a high removal efficiency for Pb2+. The adsorption mechanism was revealed by zeta potential, FT-IR and XPS studies. To the best of our knowledge, we are the first to introduce functional groups with negative charges into the pores of MOFs for the removal of heavy metal ions with excellent performance.
Experimental
Materials and apparatus
The ligand H2L was synthesized according to the literature method.30 All of the other reagents and chemicals were of an analytical grade and obtained from commercial sources. Powder X-ray diffraction (PXRD) data were collected on a PANalytical X’Pert PRO MPD system (PW3040/60). Fourier transform infrared (FT-IR) measurements were conducted on a Thermo Nicolet iS50 spectrometer. Scanning electron microscopy (SEM) images were taken on a Hitachi SU8010 instrument. X-ray photoelectron spectroscopy (XPS) data were obtained with a Thermo Escalab 250 spectrometer with monochromated Al-Kα excitation. The zeta potentials were determined using dynamic light scattering (DLS) on a Malvern Instruments Nanosizer-ZS. Thermogravimetric analysis (TGA) was carried out on a Netzsch STA-449F3 thermogravimetric analyzer under a nitrogen atmosphere at a heating rate of 10 °C min−1. Simultaneous inductively coupled plasma optical emission spectrometry (ICP-OES) on a PerkinElmer Optima 8000 instrument was used to determine the metal ion concentration in aqueous solution.Preparation of {[Zn3L3(BPE)1.5]·4.5DMF}n (1)
Zn(NO3)2·6H2O (14.9 mg, 0.05 mmol), H2L (14.3 mg, 0.05 mmol), BPE (4.6 mg, 0.025 mmol) and 6 mL DMF were placed in a 10 mL vial. The mixture was stirred until complete dissolution, and then it was kept in an oven at a temperature of 100 °C for 24 h. Orange block crystals of 1 were obtained, washed with DMF, and dried at room temperature. Yield: 8.8 mg (40%, based on H2L). Anal. calcd for C73.5H70.5N13.5Zn3O19.5: C, 53.46; H, 4.30; N, 11.45. Found: C, 53.38; H, 4.07; N, 11.07.Preparation of [Zn3L3(BPE)1.5]n (1a, activated 1)
MOF 1a was prepared by heating MOF 1 at 140 °C under vacuum (24 h) to remove the encapsulated DMF guests before the adsorption studies. As confirmed by PXRD, TG and elemental analysis, 1a retained the same framework of 1, but without DMF solvent molecules in the cavity. Anal. calcd for C60H39N9Zn3O15: C, 54.50; H, 2.97; N, 9.53. Found: C, 54.21; H, 3.22; N, 9.15.X-ray data collection and structure determination
Single X-ray diffraction intensities of crystals were collected on a CCD diffractometer at 153 K. All diffractometers were equipped with graphite monochromated Mo-Kα radiation (λ = 0.71073). The structure was solved by a direct method and expanded with the Fourier technique. All of the calculations were performed with the SHELXL-97 package.31 In 1, two azoxy groups of the L2− ligand were found to be disordered over two positions. All H atoms in 1 were placed in geometrically idealized positions and constrained to ride on their parent atoms. Moreover, the diffused electron densities resulting from these residual solvent molecules were removed from the data set using the SQUEEZE routine of PLATON and refined further using the data generated.32 The formula of {[Zn3L3(BPE)1.5]·4.5DMF}n was derived from thermogravimetric characterization. The crystal data for 1 are summarized as follows: C60H39N9O15Zn3, Mr = 1322.17, monoclinic, space group C2/c, a = 19.604(4) Å, b = 28.079(6) Å, c = 32.670(7) Å, α = 90°, β = 94.47(3)°, γ = 90°, V = 17![[thin space (1/6-em)]](https://www.rsc.org/images/entities/char_2009.gif) 929(7) Å3, Z = 8, Dc = 0.980 g cm−3, F(000) = 5376 and μ = 0.846 mm−1, 84
929(7) Å3, Z = 8, Dc = 0.980 g cm−3, F(000) = 5376 and μ = 0.846 mm−1, 84![[thin space (1/6-em)]](https://www.rsc.org/images/entities/char_2009.gif) 732 reflections collected, 15
732 reflections collected, 15![[thin space (1/6-em)]](https://www.rsc.org/images/entities/char_2009.gif) 810 unique (Rint = 0.0546). R1 = 0.0623, wR2 = 0.1871 and S = 1.093. Crystallographic data have been submitted to the Cambridge Structural Database with the deposition number CCDC 1536031.†
810 unique (Rint = 0.0546). R1 = 0.0623, wR2 = 0.1871 and S = 1.093. Crystallographic data have been submitted to the Cambridge Structural Database with the deposition number CCDC 1536031.†
Adsorption studies
All of the adsorption experiments were carried out at 25 °C using 10 mg of MOF 1a and 80 mL of Pb2+ standard solution. The Pb2+ solution was prepared by dissolving Pb(NO3)2 in deionized water and diluting to the desired concentration. To study the adsorption kinetics, adsorption experiments were performed at pH 6.0 (10 ppm Pb2+ solution) under continuous stirring. The Pb2+ concentrations of samples were measured at given time intervals using an ICP-OES spectrometer. The adsorption isotherm experiments were investigated by adding 10 mg MOF 1a into 80 mL Pb2+ solutions with different concentrations to reach adsorption equilibrium within 180 min. The adsorption capacity qt (mg g−1) and the removal efficiency were obtained from the following equations: | (1) |
 | (2) |
Furthermore, the desorption test was carried out by immersing the Pb2+ loaded MOF in 80 mL of HNO3 solution (0.1 mmol L−1) at 25 °C for 24 h. Then it was washed three times with water and dried under vacuum at 140 °C for 24 h. The desorbed Pb2+ was evaluated by the same method used in the adsorption studies.
Results and discussion
Characterization of 1 and 1a
The single-crystal X-ray diffraction study indicates that MOF 1 crystallizes in the C2/c monoclinic space group. The framework is composed of paddlewheel dinuclear Zn2(COO)4 secondary building units that are bridged by L2− ligands and further pillared by BPE to construct an interpenetrating 3D framework (Fig. 1). Although interpenetration occurs, two kinds of pore are still present in MOF 1 (Fig. 1c and d), which are calculated by the Platon program31 to have an effective solvent accessible volume of 8462.8 Å3 per unit cell (47.2% of the total cell volume). As expected, the pores in MOF 1 are decorated by a large number of O− sites, resulting in the functionalized pores. These functionalized pores will certainly be favorable for the capture of heavy metal ions.Thermogravimetric analysis (TGA) of 1 displays a major weight loss (20.2%) of the DMF guest molecules at 40–222 °C (Fig. S1†). So, the as-synthesized 1 was heated at 140 °C under vacuum for 24 h to generate the activated sample 1a. The TGA of 1a showed that the DMF molecules were completely removed (Fig. S1†), which suggested it would be a potential sorbent. The TGA, together with the elemental analysis, confirmed that the chemical formula of 1a was [Zn3L3(BPE)1.5]n.
To examine the permanent porosity of 1a, gas sorption isotherms were investigated (Fig. S2†). Unexpectedly, there is almost no N2 adsorption at 77 K compared to CO2 adsorption at 195 K, which can possibly be attributed to the different kinetic diameters of N2 (3.64 Å) and CO2 (3.30 Å which results in easier diffusion into the micropores). Similar N2 and CO2 sorption behaviors have been observed in many other flexible MOF materials.33–38 The Brunauer–Emmett–Teller surface area of 1a is calculated to be 82.5 m2 g−1 based on the CO2 adsorption isotherm. This is probably due to a higher diffusion barrier imposed on the 1D pore for the flexible MOF after desolvation and the corresponding structural contraction.33,34
As illustrated in Fig. S3,† the X-ray diffraction peaks obtained from 1a were sharp, indicating the crystalline nature of the desolvated phase. The low-angle Bragg’s reflection in 1 vanished in 1a. According to the literature, there is a slight shrinkage of the framework of 1a after guest molecule removal from 1.38–41 Soaking 1a in DMF for 24 h generated 1′, the low-angle Bragg’s reflection reappeared and the PXRD pattern was almost the same as that of 1 (Fig. S3†), which indicates that 1a is a flexible MOF and the framework did not collapse during this process. These results can be explained by the breathing behavior which has been extensively studied over the past few decades (Scheme S1†).34,35,41,42 For the flexible interpenetrated frameworks, subtle differences of guest content and composition will lead to different structures, and this transformation is reversible.33,36,39,43,44 Interestingly, a slight difference was observed in the PXRD data simulated from the single crystal data of 1 at 153 K and collected at 298 K (Fig. S3†). It can be concluded that the temperature induced structural changes in the flexible interpenetrated frameworks34,39 and also resulted in the different unit cell parameters (153 K, a = 19.604 Å, b = 28.079 Å, c = 32.670 Å, α = 90°, β = 94.47°, γ = 90°, V = 17![[thin space (1/6-em)]](https://www.rsc.org/images/entities/char_2009.gif) 929 Å3; 298 K, a = 21.79 Å, b = 26.94 Å, c = 33.00 Å, α = 90°, β = 92.24°, γ = 90°, V = 19
929 Å3; 298 K, a = 21.79 Å, b = 26.94 Å, c = 33.00 Å, α = 90°, β = 92.24°, γ = 90°, V = 19![[thin space (1/6-em)]](https://www.rsc.org/images/entities/char_2009.gif) 358 Å3).
358 Å3).
To elucidate the solvent induced breathing behavior,331 was immersed in water (24 h), and the single crystallinity of the resulted H2O-exchanged 1 (1–H2O) was not good. However, by immersing 1–H2O in DMF for 24 h, 1–H2O–DMF with better crystal quality was obtained and the unit cell parameters were very similar to those of 1 (298 K, Table S1†). So the structural transformation is reversible, and it is directly evidenced by the single crystal images (Fig. S4†). To reveal the structural change in the process of solvent-exchange, we tried to determine the crystal structures of various solvent-exchanged MOFs. Fortunately, we got the single-crystal structure of CHCl3-exchanged 1 (1–CHCl3) at 153 K (Table S2†), which retained the original metal–ligand connectivity. Meanwhile the total cell volume decreased from 17![[thin space (1/6-em)]](https://www.rsc.org/images/entities/char_2009.gif) 929 Å3 for 1 (153 K) to 17
929 Å3 for 1 (153 K) to 17![[thin space (1/6-em)]](https://www.rsc.org/images/entities/char_2009.gif) 753 Å3 for 1–CHCl3 (Table S2†), indicating a slight contraction of the square grid (Fig. S5†). After soaking 1–CHCl3 in DMF, the unit cell parameters of the generated 1–CHCl3–DMF were almost the same as those of 1 (298 K). These results further confirmed that the MOF is dynamic in nature and the transformation of the flexible framework is reversible,33,37,39,43 which is also supported by the PXRD patterns. As shown in Fig. S6,† the PXRD patterns of solvent-exchanged 1 are different from those of 1, but return to 1 after immersion in DMF for 24 h (Fig. S7†).
753 Å3 for 1–CHCl3 (Table S2†), indicating a slight contraction of the square grid (Fig. S5†). After soaking 1–CHCl3 in DMF, the unit cell parameters of the generated 1–CHCl3–DMF were almost the same as those of 1 (298 K). These results further confirmed that the MOF is dynamic in nature and the transformation of the flexible framework is reversible,33,37,39,43 which is also supported by the PXRD patterns. As shown in Fig. S6,† the PXRD patterns of solvent-exchanged 1 are different from those of 1, but return to 1 after immersion in DMF for 24 h (Fig. S7†).
Pb2+ sorption studies
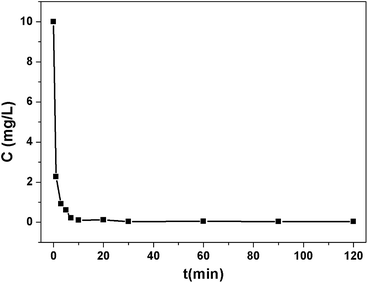
The pH value greatly influences the adsorption performance of Pb2+, so the effect of the pH ranging from 3.0 to 7.0 on the adsorption of Pb2+ was investigated. As shown in Fig. S8,† the removal efficiency of 1a was very low at pH 3.0 and it increased dramatically with the increasing of the pH and achieved the largest signal at pH 6.0. Further increasing the pH resulted in a decline of the removal efficiency. This is due to the protonation effect on the surface of the MOF adsorbent and excess H+ competing for the sorption sites at a low pH. When the pH is higher than 6.0, Pb2+ hydroxide precipitation may occur.45 Accordingly, the optimum pH value of 6.0 was selected for the subsequent adsorption experiments.To evaluate the effectiveness of Pb2+ removal from water, 1a was placed in a Pb2+ solution of 10 ppm at pH 6.0. The Pb2+ loaded 1a (1a–Pb) was isolated and washed with water to remove the residual Pb2+ on the exterior of 1a–Pb. Then it was examined by energy-dispersive X-ray spectroscopy (EDS) and this confirmed the existence of Pb (Fig. S9†). As shown in Fig. 2, 1a can rapidly capture Pb2+, and remove 98.12% Pb2+ within 7 min. After 1 h, the concentration of the residual Pb2+ reduced to 0.035 ppm, that is, 99.65% Pb2+ was removed. The fast kinetics and high efficiency for Pb2+ removal could be attributed to the high affinity of 1a.
To assess the sorbent’s affinity for Pb2+, the distribution coefficient Kd (mL g−1) was calculated as follows:
 | (3) |
The adsorption isotherms were investigated to estimate the maximum adsorption capacity of 1a by varying the Pb2+ concentrations from 5 ppm to 200 ppm at pH 6.0. As shown in Fig. 3a, the value of qe (equilibrium adsorption capacity) increased with the increasing Pb2+ concentrations and finally reached the maximum value of 616.64 mg g−1. In addition, we also considered the removal efficiency at different Pb2+ initial concentrations (Fig. S10†). More than 90% Pb2+ can be removed in the concentration range from 1 ppm to 75 ppm. The equilibrium adsorption isotherm data was fitted by the Langmuir model, yielding a relatively high correlation coefficient of 0.9997. The maximum adsorption capacity of 1a for Pb2+ was calculated to be 613.50 mg g−1, which closely matched with the experimental equilibrium value of 616.64 mg g−1. We reasoned that such an excellent lead adsorption capacity could be stemmed from the highly accessible O− groups densely populated throughout the pores of 1a.
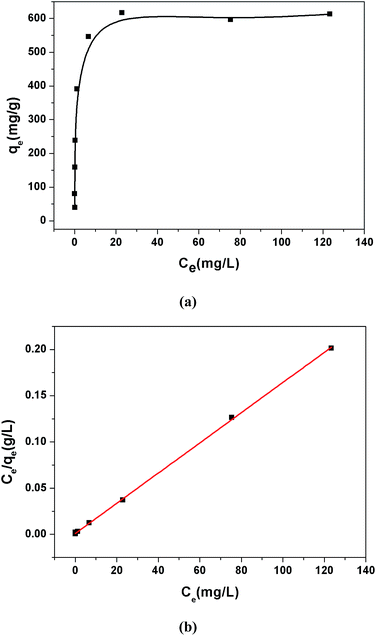 | ||
| Fig. 3 (a) Pb2+ adsorption isotherm for 1a. (b) Langmuir adsorption mode fitting for the adsorption of Pb2+ by 1a. | ||
To highlight the contribution of the O− groups to the Pb2+ uptake, we synthesized a similar MOF to 1 but without O− groups, [Zn(ADC)(BPE)0.5]n (ADC = 4,4′-azobenzenedicarboxylate),37 and investigated its adsorption isotherms for Pb2+. Results show that the activated [Zn(ADC)(BPE)0.5]n displayed a lower uptake capacity of 473.92 mg g−1. Meanwhile, we calculated the theoretical uptake capacity of 1a based on the molecular formula, pore volumes and one O− group per L2− adsorbing one Pb2+ ion by a coordination interaction. The calculated theoretical uptake capacity is 470.11 mg g−1, which is obviously lower than the experimental equilibrium value (616.64 mg g−1) of 1a. The higher experimental adsorption capacity for 1a could be attributed to the various adsorption modes formed by the O− groups, which offered not only coordination interactions but also electrostatic attractions between the O− groups and Pb2+. To the best of our knowledge, the Pb2+ uptake capacity of 1a is the highest among the reported MOF adsorbents (Table S3†), and also exceeded that of other Pb2+ adsorbents.51,53–57 These results suggest that 1a is a prospective adsorbent for Pb2+ removal due to its large adsorption capacity and high removal efficiency.
The selective removal of heavy metal ions will facilitate environmental protection and allow the reuse of heavy metals.53 However, a lot of adsorbents for Pb2+ removal exhibit low selectivity. An absorbent with high selectivity is required to separate heavy metal ions from wastewater. Selectivity tests were performed in a mixed solution containing Na+, Mg2+, K+, Ca2+, Mn2+, Co2+, Ni2+, Cd2+ and Pb2+ with the concentration of 10 ppm for each metal ion. The adsorption ability of 1a toward Pb2+ is considerably higher than that for other ions (Fig. 4a). In the mixed solution, 99.27% Pb2+ was removed, while 17.46% Cd2+ was absorbed. In contrast, other background metal ions such as Na+, Mg2+, K+, Ca2+, Mn2+, Co2+, and Ni2+ do not quite bind to 1a, with an equilibrium removal efficiency of less than 8%. This phenomenon can be explained by the HSAB principle.58 The negatively charged O atoms of the azoxy groups have the properties of a borderline base, which could readily bind with the metals Co2+, Ni2+, and Pb2+ (borderline acids) and Cd2+ (soft acid), and bind difficultly with Na+, Mg2+, K+, Ca2+, and Mn2+ (hard acids). Compared to the borderline acid Pb2+, the relatively low removal efficiencies for the borderline acids Co2+ and Ni2+ are attributed to their fairly high hydration energies (1915 kJ mol−1 for Co2+, 1980 kJ mol−1 for Ni2+, and 1425 kJ mol−1 for Pb2+).59 It is difficult for Co2+ and Ni2+ to detach water molecules and further interact with the negatively charged O atoms. So the MOF material has a strong preference and fairly high selectivity for Pb2+ against other metal ions, highlighting its potential in selectively removing Pb2+ from real wastewater.
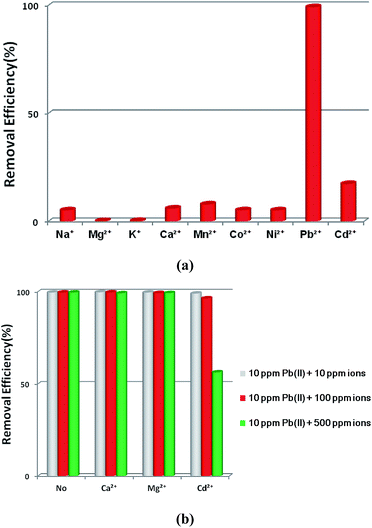 | ||
| Fig. 4 (a) The effects of coexisting ions on the removal of Pb2+ by 1a. (b) The effects of competing ions on the removal of Pb2+ by 1a. | ||
Ca2+ and Mg2+ are common cations that always ubiquitously co-exist in the natural water environment, and the same positive-charge and high level concentration might lead to competitive adsorption with Pb2+.2,60,61 The soft acid Cd2+, which has a comparable ionic size and charge density to Pb2+, and often co-exists with Pb2+,62 can strongly compete for the selectivity of sorbents. Thus, it is essential to investigate the effect of the competing ions Ca2+, Mg2+ and Cd2+ on the adsorption of Pb2+. As shown in Fig. 4b, outstanding Pb2+ removal efficiencies were obtained in the presence of competing ions of Ca2+ and Mg2+. With the molar ratios of Ca2+/Pb2+ and Mg2+/Pb2+ ranging from 1 to 50, there were only little decreases for Pb2+ removal efficiencies, changing from 99.82% to 99.21% with Ca2+ and 99.65% to 99.31% with Mg2+. A large removal capacity (96.43%) was still obtained at a molar ratio of 10 for Cd2+/Pb2+. When the ratio was increased to 50, the Pb2+ removal efficiency reduced to 56.31%. The concentration of Cd2+ in the natural water environment can hardly reach such a high ratio, thus Cd2+ could not affect the Pb2+ removal performance in a practical application.
All of these results indicate that 1a has a strong preference and an ultrahigh selectivity for Pb2+ sorption. The particular selectivity can be ascribed to the following reasons: (1) the densely populated O− groups of the functionalized MOF provided strong interactions between O− and Pb2+; (2) adsorbents preferentially adsorb divalent cations with a lower hydration energy in general, as metal ions have to detach a large share of hydrated water before they enter the smaller channels of the adsorbents.59,60,63,64 Compared with Ca2+ (1505 kJ mol−1), Mg2+ (1830 kJ mol−1) and Cd2+ (1755 kJ mol−1), the lowest Gibbs free energy of hydration was observed for Pb2+ (1425 kJ mol−1), indicating Pb2+ preferential adsorption than other divalent cations;59 (3) it has been reported that a larger ionic radius would be favorable for the interactions between metal ions and functional groups of the adsorbent.65–67 The radiuses of Ca2+, Mg2+ and Cd2+ are 0.100 nm, 0.072 nm and 0.095 nm, respectively, while the radius of Pb2+ is 0.119 nm. The larger radius would endow 1a with quite good selectivity for Pb2+ adsorption.
Stability and reusability study
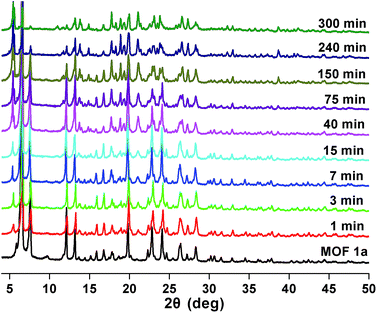
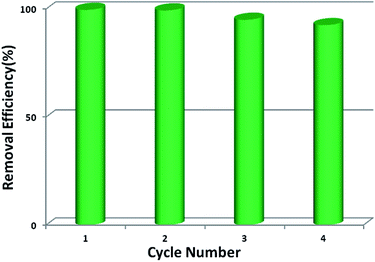
Stability and reusability are two important factors in the application of an adsorbent. To verify the chemical stability of 1a, we performed in situ PXRD measurements to evaluate the crystalline structure. In Fig. 5 and S11,† after soaking 1a in water for 300 min, and even soaking in Pb2+ solution for more than 300 min, it still holds a high crystalline form and retained the structure of 1a, indicating the good chemical stability of 1a in water and Pb2+ solution. On further immersion of 1a in aqueous solution of pH 3.0–10.0 (300 min), its high crystalline form was also preserved (Fig. S12†). Meanwhile, SEM investigations were carried out to examine the surface morphology of 1a before and after loading Pb2+. As shown in Fig. S13b,† the crystals of 1a did not collapse during the sorption process.36 The adsorption isotherm of 1a–Pb exhibits a negligible uptake for CO2 (Fig. S14†). The different adsorption capacities and behaviors of 1a and 1a–Pb are clearly caused by loading Pb2+. To get single crystals with better quality, we soaked 1–Pb in DMF for 24 h, and determined the unit cell parameters of 1–Pb–DMF (Table S1†). By comparison of the unit cell parameters with 1 (298 K), we can affirm that the adsorbent still maintains the single crystallinity even after loading Pb2+.From the consideration of economical and practical purposes, it is of great significance to study the desorption and regeneration of an adsorbent. As shown in Fig. 6, 1a exhibited a favorable cycle performance for Pb2+ adsorption, and the removal efficiency remained almost unchanged in the first two cycles and only slight fading was observed in the following cycles. The slight decrease may result from the loss of the adsorbent during cycling. Similar results were also reported in previous studies.55,68
Mechanism of Pb2+ removal
Generally, the adsorptive modes for metal ion removal mainly include electrostatic adsorption, coordination adsorption and ion exchange. To investigate whether there is electrostatic attraction in the sorption process of Pb2+, zeta potential measurements were performed. When the pH was above 4.0, the surface of 1a was negatively charged, and the density of the negative charge increased remarkably with increasing pH value (Fig. S15†). Meanwhile, the removal efficiency exhibited a similar variation tendency along with the change of pH value. The zeta potential of 1a–Pb appeared to be less negative in the pH range of 5.0–7.0 due to charge neutralization. Hence, it is believed that the electrostatic attraction is the main force causing the adsorption of Pb2+ onto 1a. When the solution pH was below 4.0, the surface charge on 1a turned positive, resulting in electrostatic repulsion between 1a and Pb2+. However, 1a still exhibited a removal efficiency of 19.68% at a pH of 3.0, which demonstrates that there are other interactions besides the electrostatic effect.Evaluating the effect of the background electrolyte on Pb2+ sorption is an effective macroscopic method to understand the adsorption mechanism.69 One can see that the background electrolyte had little effect on Pb2+ adsorption (Fig. S16†). Even at a high concentration of 500 ppm, a relatively high removal efficiency (98.39%) for Pb2+ was still obtained. Therefore, the mechanism of Pb2+ removal does not involve ion exchange behavior.
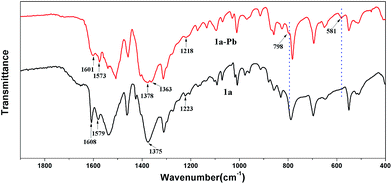
To further investigate the mechanism of Pb2+ sorption, FT-IR spectra of 1a and 1a–Pb were studied. In Fig. 7, a new peak at 581 cm−1 for 1a–Pb is a typical characteristic stretching vibration of Pb–O,70 confirming the fact of Pb2+ loading. The bands at 1378 cm−1 and 798 cm−1 occur after Pb2+ adsorption, implying the presence of NO3−, for charge balance.47,71,72 There are strong interactions between Pb2+ and the O− groups that could limit N–O stretching vibrations and consequently decrease their vibrational frequency, giving rise to a red shift from 1223 cm−1 to 1218 cm−1.25 For 1a, the peaks at 1608 cm−1, 1579 cm−1 and 1375 cm−1 are assigned to the characteristic groups of the aromatic C![[double bond, length as m-dash]](https://www.rsc.org/images/entities/char_e001.gif) C and C–N vibrations,73 whereas these peaks shifted to 1601 cm−1, 1573 cm−1, and 1363 cm−1, respectively, after loading Pb2+. This might give further evidence of coordination interactions between Pb2+ and O atoms.
C and C–N vibrations,73 whereas these peaks shifted to 1601 cm−1, 1573 cm−1, and 1363 cm−1, respectively, after loading Pb2+. This might give further evidence of coordination interactions between Pb2+ and O atoms.
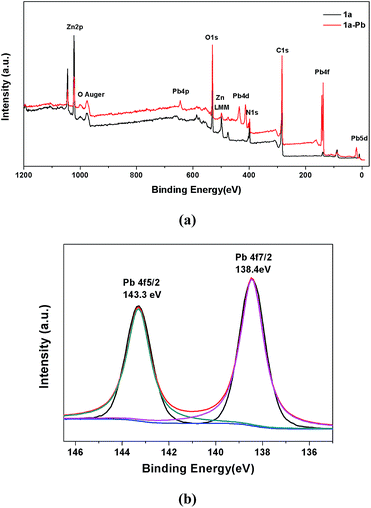
XPS spectra were also employed to provide more information on the interactions between 1a and Pb2+. As shown in Fig. 8a, the appearance of the Pb 4f, Pb 4d and Pb 4p peaks verifies that Pb2+ is undoubtedly loaded on 1a. A more detailed structure of the Pb species could be obtained in the high resolution XPS spectrum of Pb 4f. In Fig. 8b, there are two peaks at 143.3 eV and 138.4 eV, corresponding to Pb 4f5/2 and Pb 4f7/2. Compared with the Pb2+ binding energies of purified Pb(NO3)2 at 144.5 eV for Pb 4f5/2 and 139.6 eV for Pb 4f7/2,60 a remarkable shift of 1.2 eV to a lower binding energy for Pb 4f can be observed in 1a–Pb, which reveals the formation of strong affinities between Pb2+ and 1a.2 The energy separation of 4.9 eV between the Pb 4f5/2 (143.3 eV) and Pb 4f7/2 (138.4 eV) peaks further confirms that the coordination interaction, and not merely the electrostatic interaction, accounts for the mechanism of Pb2+ sorption.1,74 These results are consistent with the FT-IR analyses and zeta potential measurements.
Conclusions
In summary, a novel Zn(II)-based MOF functionalized with O− groups was elaborately constructed for the removal of Pb2+ from aqueous solution. The activated MOF showed excellent performance for Pb2+ removal with a record-high uptake capacity of 616.64 mg g−1 among MOF adsorbents, a high removal efficiency in a wide range (>90% at 1–75 ppm) and an exceptional distribution coefficient value of 2.3 × 10⁶ mL g−1, making the activated MOF one of the most promising materials for eliminating Pb2+ pollution from water. Notably, the activated MOF can selectively capture Pb2+ with a high efficiency even in the presence of a high concentration of other metal ions. Also, the adsorbent can be readily regenerated and recycled without a significant decrease of the removal efficiency. The densely populated and highly accessible O− groups with their remarkable affinity for Pb2+ are responsible for the impressive results. This work therefore lays a foundation for introducing charged groups into MOFs as a new platform for efficiently removing contaminants from aqueous solution.Conflicts of interest
There are no conflicts to declare.Acknowledgements
This work was supported by the National Natural Science Foundation of China (No. 21671174 and 21371155).Notes and references
- D. Chen, W. Shen, S. Wu, C. Chen, X. Luo and L. Guo, Nanoscale, 2016, 8, 7172–7179 RSC.
- J. Wang, W. Zhang, X. Yue, Q. Yang, F. Liu, Y. Wang, D. Zhang, Z. Li and J. Wang, J. Mater. Chem. A, 2016, 4, 3893–3900 CAS.
- A. Ayoub, R. A. Venditti, J. J. Pawlak, A. Salam and M. A. Hubbe, ACS Sustainable Chem. Eng., 2013, 1, 1102–1109 CrossRef CAS.
- B. Clark, S. Masters and M. Edwards, Environ. Sci. Technol., 2014, 48, 6836–6843 CrossRef CAS PubMed.
- Y. Wang, G. Ye, H. Chen, X. Hu, Z. Niu and S. Ma, J. Mater. Chem. A, 2015, 3, 15292–15298 CAS.
- A. V. Borhade, T. A. Kshirsagar, A. G. Dholi and J. A. Agashe, J. Chem. Eng. Data, 2015, 60, 586–593 CrossRef CAS.
- L. Zhou, L. Ji, P. C. Ma, Y. Shao, H. Zhang, W. Gao and Y. Li, J. Hazard. Mater., 2014, 265, 104–114 CrossRef CAS PubMed.
- L. Jiang and P. Liu, Ind. Eng. Chem. Res., 2014, 53, 2924–2931 CrossRef CAS.
- I. Ali, Chem. Rev., 2012, 112, 5073–5091 CrossRef CAS PubMed.
- M. Khajeh, S. Laurent and K. Dastafkan, Chem. Rev., 2013, 113, 7728–7768 CrossRef CAS PubMed.
- X. Luo, J. Zeng, S. Liu and L. Zhang, Bioresour. Technol., 2015, 194, 403–406 CrossRef CAS PubMed.
- R. B. Lin, T. Y. Li, H. L. Zhou, C. T. He, J. P. Zhang and X. M. Chen, Chem. Sci., 2015, 6, 2516–2521 RSC.
- C. Wang, X. Liu, N. Keser Demir, J. P. Chen and K. Li, Chem. Soc. Rev., 2016, 45, 5107–5134 RSC.
- B. Li, H. M. Wen, H. Wang, H. Wu, M. Tyagi, T. Yildirim, W. Zhou and B. Chen, J. Am. Chem. Soc., 2014, 136, 6207–6210 CrossRef CAS PubMed.
- D. Liu, J. P. Lang and B. F. Abrahams, J. Am. Chem. Soc., 2011, 133, 11042–11045 CrossRef CAS PubMed.
- N. Li, J. Xu, R. Feng, T. L. Hu and X. H. Bu, Chem. Commun., 2016, 52, 8501–8513 RSC.
- M. M. Chen, L. Chen, H. X. Li, L. Brammer and J. P. Lang, Inorg. Chem. Front., 2016, 3, 1297–1305 RSC.
- Y. Q. Chen, G. R. Li, Z. Chang, Y. K. Qu, Y. H. Zhang and X. H. Bu, Chem. Sci., 2013, 4, 3678–3682 RSC.
- E. Tahmasebi, M. Y. Masoomi, Y. Yamini and A. Morsali, Inorg. Chem., 2015, 54, 425–433 CrossRef CAS PubMed.
- Y. Wang, J. Xie, Y. Wu, H. Ge and X. Hu, J. Mater. Chem. A, 2013, 1, 8782–8789 CAS.
- Y. L. Hou, K. K. Yee, Y. L. Wong, M. Zha, J. He, M. Zeller, A. D. Hunter, K. Yang and Z. Xu, J. Am. Chem. Soc., 2016, 138, 14852–14855 CrossRef CAS PubMed.
- K. K. Yee, N. Reimer, J. Liu, S. Y. Cheng, S. M. Yiu, J. Weber, N. Stock and Z. Xu, J. Am. Chem. Soc., 2013, 135, 7795–7798 CrossRef CAS PubMed.
- L. Huang, M. He, B. Chen and B. Hu, J. Mater. Chem. A, 2015, 3, 11587–11595 CAS.
- F. Luo, J. L. Chen, L. L. Dang, W. N. Zhou, H. L. Lin, J. Q. Li, S. J. Liu and M. B. Luo, J. Mater. Chem. A, 2015, 3, 9616–9620 CAS.
- L. Aboutorabi, A. Morsali, E. Tahmasebi and O. Buyukgungor, Inorg. Chem., 2016, 55, 5507–5513 CrossRef CAS PubMed.
- M. Carboni, C. W. Abney, S. Liu and W. Lin, Chem. Sci., 2013, 4, 2396–2402 RSC.
- L. L. Wang, F. Luo, L. L. Dang, J. Q. Li, X. L. Wu, S. J. Liu and M. B. Luo, J. Mater. Chem. A, 2015, 3, 13724–13730 CAS.
- H. Xue, Q. Chen, F. Jiang, D. Yuan, G. Lv, L. Liang, L. Liu and M. Hong, Chem. Sci., 2016, 7, 5983–5988 RSC.
- L. Liang, Q. Chen, F. Jiang, D. Yuan, J. Qian, G. Lv, H. Xue, L. Liu, H. Jiang and M. Hong, J. Mater. Chem. A, 2016, 4, 15370–15374 CAS.
- E. B. Reid and E. G. Pritchett, J. Org. Chem., 1953, 18, 715–719 CrossRef CAS.
- G. M. Sheldrick, SHELXS-97 and SHELXL-97, Program for X-ray Crystal Structure Solution, University of Göettingen, Germany, 1997 Search PubMed.
- A. Spek, J. Appl. Crystallogr., 2003, 36, 7–13 CrossRef CAS.
- R. Haldar, M. Inukai, S. Horike, K. Uemura, S. Kitagawa and T. K. Maji, Inorg. Chem., 2016, 55, 4166–4172 CrossRef CAS PubMed.
- Y. S. Wei, K. J. Chen, P. Q. Liao, B. Y. Zhu, R. B. Lin, H. L. Zhou, B. Y. Wang, W. Xue, J. P. Zhang and X. M. Chen, Chem. Sci., 2013, 4, 1539–1546 RSC.
- M. L. Foo, R. Matsuda, Y. Hijikata, R. Krishna, H. Sato, S. Horike, A. Hori, J. Duan, Y. Sato, Y. Kubota, M. Takata and S. Kitagawa, J. Am. Chem. Soc., 2016, 138, 3022–3030 CrossRef CAS PubMed.
- N. Yanai, K. Kitayama, Y. Hijikata, H. Sato, R. Matsuda, Y. Kubota, M. Takata, M. Mizuno, T. Uemura and S. Kitagawa, Nat. Mater., 2011, 10, 787–793 CrossRef CAS PubMed.
- B. Chen, S. Ma, E. J. Hurtado, E. B. Lobkovsky and H. C. Zhou, Inorg. Chem., 2007, 46, 8490–8492 CrossRef CAS PubMed.
- T. K. Maji, G. Mostafa, R. Matsuda and S. Kitagawa, J. Am. Chem. Soc., 2005, 127, 17152–17153 CrossRef CAS PubMed.
- P. Kanoo, R. Haldar, S. K. Reddy, A. Hazra, S. Bonakala, R. Matsuda, S. Kitagawa, S. Balasubramanian and T. K. Maji, Chem.–Eur. J., 2016, 22, 15864–15873 CrossRef CAS PubMed.
- P. L. Llewellyn, G. Maurin, T. Devic, S. Loera-Serna, N. Rosenbach, C. Serre, S. Bourrelly, P. Horcajada, Y. Filinchuk and G. Férey, J. Am. Chem. Soc., 2008, 130, 12808–12814 CrossRef CAS PubMed.
- G. Ferey and C. Serre, Chem. Soc. Rev., 2009, 38, 1380–1399 RSC.
- S. Kitagawa, R. Kitaura and S. Noro, Angew. Chem., Int. Ed., 2004, 43, 2334–2375 CrossRef CAS PubMed.
- D. N. Dybtsev, H. Chun and K. Kim, Angew. Chem., Int. Ed., 2004, 43, 5033–5036 CrossRef CAS PubMed.
- B. Chen, C. Liang, J. Yang, D. S. Contreras, Y. L. Clancy, E. B. Lobkovsky, O. M. Yaghi and S. Dai, Angew. Chem., Int. Ed., 2006, 45, 1390–1393 CrossRef CAS PubMed.
- L. Kong, L. Yan, Z. Qu, N. Yan and L. Li, J. Mater. Chem. A, 2015, 3, 15755–15763 CAS.
- M. L. Feng, D. Sarma, X. H. Qi, K. Z. Du, X. Y. Huang and M. G. Kanatzidis, J. Am. Chem. Soc., 2016, 138, 12578–12585 CrossRef CAS PubMed.
- L. Ma, Q. Wang, S. M. Islam, Y. Liu, S. Ma and M. G. Kanatzidis, J. Am. Chem. Soc., 2016, 138, 2858–2866 CrossRef CAS PubMed.
- M. E. Doumer, A. Rigol, M. Vidal and A. S. Mangrich, Environ. Sci. Pollut. Res. Int., 2016, 23, 2684–2692 CrossRef CAS PubMed.
- Y. Shin, G. E. Fryxell, W. Um, K. Parker, S. V. Mattigod and R. Skaggs, Adv. Funct. Mater., 2007, 17, 2897–2901 CrossRef CAS.
- M. J. Manos, V. G. Petkov and M. G. Kanatzidis, Adv. Funct. Mater., 2009, 19, 1087–1092 CrossRef CAS.
- Z. Li, J. Chen and Y. Ge, Chem. Eng. J., 2017, 308, 809–817 CrossRef CAS.
- L. M. Jakomin, L. Marban, S. Grondona, M. Glok Galli and D. E. Martinez, Bull. Environ. Contam. Toxicol., 2015, 95, 325–331 CrossRef CAS PubMed.
- X. Luo, L. Liu, F. Deng and S. Luo, J. Mater. Chem. A, 2013, 1, 8280–8286 CAS.
- Y. Xie, J. Wang, M. Wang and X. Ge, J. Hazard. Mater., 2015, 297, 66–73 CrossRef CAS PubMed.
- L. L. Ling, W. J. Liu, S. Zhang and H. Jiang, J. Mater. Chem. A, 2016, 4, 10336–10344 CAS.
- C. Zhang, Z. Yu, G. Zeng, B. Huang, H. Dong, J. Huang, Z. Yang, J. Wei, L. Hu and Q. Zhang, Chem. Eng. J., 2016, 284, 247–259 CrossRef CAS.
- S. Luo, X. Xu, G. Zhou, C. Liu, Y. Tang and Y. Liu, J. Hazard. Mater., 2014, 274, 145–155 CrossRef CAS PubMed.
- R. G. Pearson, J. Am. Chem. Soc., 1963, 85, 3533–3539 CrossRef CAS.
- Y. Marcus, J. Chem. Soc., Faraday Trans., 1991, 87, 2995–2999 RSC.
- Q. Peng, J. Guo, Q. Zhang, J. Xiang, B. Liu, A. Zhou, R. Liu and Y. Tian, J. Am. Chem. Soc., 2014, 136, 4113–4116 CrossRef CAS PubMed.
- R. He, W. Li, D. Deng, W. Chen, H. Li, C. Wei and Y. Tang, J. Mater. Chem. A, 2015, 3, 9789–9798 CAS.
- L. Q. Niu, P. Jia, S. P. Li, J. L. Kuang, X. X. He, W. H. Zhou, B. Liao, W. S. Shu and J. T. Li, Environ. Pollut., 2015, 205, 333–339 CrossRef CAS PubMed.
- E. Eren, B. Afsin and Y. Onal, J. Hazard. Mater., 2009, 161, 677–685 CrossRef CAS PubMed.
- Y. Du, L. Zhu and G. Shan, J. Colloid Interface Sci., 2012, 367, 378–382 CrossRef CAS PubMed.
- X. Yu, S. Tong, M. Ge, L. Wu, J. Zuo, C. Cao and W. Song, J. Environ. Sci., 2013, 25, 933–943 CrossRef CAS.
- P. S. Lau, H. Y. Lee, C. C. K. Tsang, N. F. Y. Tam and Y. S. Wong, Environ. Technol., 1999, 20, 953–961 CrossRef CAS.
- K. S. Low, C. K. Lee and S. M. Mak, Wood Sci. Technol., 2004, 38, 629–640 CrossRef CAS.
- L. Chu, C. Liu, G. Zhou, R. Xu, Y. Tang, Z. Zeng and S. Luo, J. Hazard. Mater., 2015, 300, 153–160 CrossRef CAS PubMed.
- W. Yao, S. Yu, J. Wang, Y. Zou, S. Lu, Y. Ai, N. S. Alharbi, A. Alsaedi, T. Hayat and X. Wang, Chem. Eng. J., 2017, 307, 476–486 CrossRef CAS.
- J. S. Ogden, J. Chem. Phys., 1972, 56, 1658 CrossRef CAS.
- R. Bianco, S. Wang and J. T. Hynes, J. Phys. Chem. A, 2008, 112, 9467–9476 CrossRef CAS PubMed.
- M. C. G. Lebrero, D. E. Bikiel, M. D. Elola, D. A. Estrin and A. E. Roitberg, J. Chem. Phys., 2002, 117, 2718–2725 CrossRef.
- L. Hu, Z. Yang, L. Cui, Y. Li, H. H. Ngo, Y. Wang, Q. Wei, H. Ma, L. Yan and B. Du, Chem. Eng. J., 2016, 287, 545–556 CrossRef CAS.
- L. J. Chen, S. M. Zhang, Z. S. Wu, Z. J. Zhang and H. X. Dang, Mater. Lett., 2005, 59, 3119–3121 CrossRef CAS.
Footnote |
| † Electronic supplementary information (ESI) available. CCDC 1536031. For ESI and crystallographic data in CIF or other electronic format see DOI: 10.1039/c7sc03308g |
| This journal is © The Royal Society of Chemistry 2017 |

