 Open Access Article
Towards quantifying the role of hydrogen bonding within amphiphile self-association and resultant aggregate formation†
L. J.
White
a,
N. J.
Wells
b,
L. R.
Blackholly
a,
H. J.
Shepherd
 a,
B.
Wilson
a,
G. P.
Bustone
a,
T. J.
Runacres
c and
J. R.
Hiscock
a,
B.
Wilson
a,
G. P.
Bustone
a,
T. J.
Runacres
c and
J. R.
Hiscock
 *a
*a
aSchool of Physical Sciences, University of Kent, Park Wood Road, Canterbury, Kent CT2 7NH, UK. E-mail: J.R.Hiscock@Kent.ac.uk; Tel: +44(0) 1227 823043
bSchool of Chemistry, University of Southampton, Southampton, SO17 1BJ, UK
cSchool of Biosciences, University of Kent, Park Wood Road, Canterbury, Kent CT2 7NH, UK
First published on 26th September 2017
Abstract
Herein, we present a series of five tetrabutylammonium (TBA) sulfonate–urea amphiphilic salts. In solution these amphiphilic salts have been shown to form a variety of self-associated species. The proportion and type of which are both solvent and concentration dependent. In DMSO-d6 a variety of NMR experiments provide evidence towards the formation of mainly dimeric over larger aggregate species. Increasing the percentage of water was shown to increase the concentration of the larger aggregates over dimers in solution. A correlation was established between critical micelle concentration (CMC) values obtained in a 1![[thin space (1/6-em)]](https://www.rsc.org/images/entities/char_2009.gif) :
:![[thin space (1/6-em)]](https://www.rsc.org/images/entities/char_2009.gif) 19 EtOH
19 EtOH![[thin space (1/6-em)]](https://www.rsc.org/images/entities/char_2009.gif) :
:![[thin space (1/6-em)]](https://www.rsc.org/images/entities/char_2009.gif) H2O mixture, dimeric self-association constants obtained in a DMSO-d6 – 0.5% H2O and the results of simple semi-empirical PM6 computational modelling methods. This approach begins to quantify the role of hydrogen bonding in amphiphile self-association and the effects it imparts on surfactant properties. This consequently provides preliminary evidence that these properties maybe predicted by simple low level computational modelling techniques.
H2O mixture, dimeric self-association constants obtained in a DMSO-d6 – 0.5% H2O and the results of simple semi-empirical PM6 computational modelling methods. This approach begins to quantify the role of hydrogen bonding in amphiphile self-association and the effects it imparts on surfactant properties. This consequently provides preliminary evidence that these properties maybe predicted by simple low level computational modelling techniques.
Introduction
Molecular self-assembly typically relies on the formation of intermolecular non-covalent interactions such as hydrogen bonding, charge transfer or electrostatics.1,2 These self-association events, in combination with hydrophobic/hydrophilic solvent interactions inform the structure of any resultant aggregate.3 Gaining an understanding of these intermolecular, non-covalent self-association events has integrated supramolecular complexation principles into the design of monomeric units, leading to controlled self-association events and novel programmable nanostructures,2,4–7 supramolecular organic frameworks8 (SOFs) and supramolecular gels.9–11Many of these self-associated systems are stabilised through the formation of intermolecular hydrogen bonds. This has been highlighted through the work of Steed and co-workers in which covalent bonds were replaced by non-covalent hydrogen bonds in the design of supramolecular gels.12 Zhou and co-workers have also shown the potential of hydrogen-bonded amphiphiles to act as drug/gene delivery systems.13 Yagai and co-workers have utilised hydrogen bonding in the construction of molecular semi-conductors,14 while Ikkala and co-workers have shown that hydrogen bonds can be used to drive the self-assembly of cobalt nanoparticles to form hollow capsids.15 This work highlights the important role hydrogen bonding takes in self-association processes, producing wide-ranging functional materials. Developing an understanding and predictable control of these interactions at a molecular level is therefore of high importance.
The use of neutral hydrogen bond donating (HBD) receptors for the selective coordination of anionic guest species in competitive solvent mixtures is well known.16,17 However, there are relatively few examples of low molecular weight compounds (MW < 500) which incorporate HBD cavities, covalently linked to an anionic substituent. One example of this type of molecular structure published by Gale, Sambrook and co-workers uses this combination of anionic HBA and HBD motifs for the selective hydrogen bonded coordination of a neutral phosphonate over anionic species.18
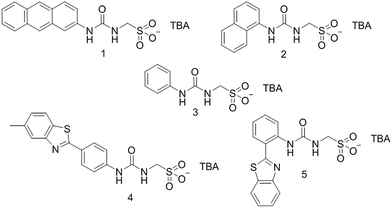
This class of covalently linked HBD–anion compound, specifically containing a urea-spacer-sulfonate/carboxylate motif was first probed for its surfactant properties by Faustino and co-workers19–22 with examples shown to exhibit similar critical micelle concentrations (CMC) to that of sodium decanoate.23 We have extended this work, producing a series amphiphilic salts containing the covalently linked urea/thiourea–CH2–sulfonate motif. Our preliminary solution state study confirmed that in DMSO solution the anionic portion of these amphiphilic salts self-associates through the formation of intermolecular hydrogen bonds. We have also shown that this self-associative hydrogen bonded network can be modified though the addition of competitive hydrogen bond accepting (HBA) and HBD species.24 A second solid state study showed that in the presence of a weakly-coordinating counter cation, such as tetrabutylammonium (TBA), the urea/thiourea–CH2–sulfonate ion was found to self-associate through intermolecular hydrogen bonded urea![[thin space (1/6-em)]](https://www.rsc.org/images/entities/char_2009.gif) :
:![[thin space (1/6-em)]](https://www.rsc.org/images/entities/char_2009.gif) sulfonate complex formation; the hydrogen bond length and angle were influenced by the relative acidity of the HBD groups present within the monomeric structure.25 We have also looked to utilise this motif towards the templating of DNA incorporated nanostructures.26 Herein we present the synthesis of four novel, intrinsically fluorescent, sulfonate–urea based amphiphilic salts 1, 2, 4, 5. Although a single crystal X-ray structure has previously been reported for 3,25 any studies relating to self-association properties of this amphiphile within the solution or gas phase have not been explored. This amphiphile acts as a standard, allowing the effects of amphiphile aromaticity and addition of benzothiazole moieties to be explored.
sulfonate complex formation; the hydrogen bond length and angle were influenced by the relative acidity of the HBD groups present within the monomeric structure.25 We have also looked to utilise this motif towards the templating of DNA incorporated nanostructures.26 Herein we present the synthesis of four novel, intrinsically fluorescent, sulfonate–urea based amphiphilic salts 1, 2, 4, 5. Although a single crystal X-ray structure has previously been reported for 3,25 any studies relating to self-association properties of this amphiphile within the solution or gas phase have not been explored. This amphiphile acts as a standard, allowing the effects of amphiphile aromaticity and addition of benzothiazole moieties to be explored.
The self-association properties of these five amphiphiles have been investigated in the solid, gas and solution states. In addition, the surfactant properties for these amphiphilic salts have also been explored, with correlations established between experimentally derived self-association constants, CMC values and computationally derived electrostatic surface potential values. This has allowed us to begin to quantify the contribution of hydrogen bonded complex formation toward global solution state properties, and highlights the possible use of low level theory calculations towards predicting these physical properties for a structurally similar class of amphiphile in a comparable, but more accessible manner to those prognostic studies produced by Nagarajan and Ruckenstein.27
Synthesis
The synthesis of 3 has previously been reported.25 Amphiphiles 1 and 4 were synthesised by reaction of 2-aminoanthracene or 4-(6-methylbenzothiazol)aniline as appropriate, with triphosgene in ethyl acetate to give the corresponding isocyanate. This was followed by the addition of TBA aminomethanesulfonate. After further purification, 1 and 4 were obtained as yellow solids in yields of 43% and 65% respectively. Amphiphile 2 was obtained through the reaction of TBA aminomethanesulfonate with 1-naphthyl isocyanate in pyridine. The pure product was obtained as a pale brown solid with a yield of 31%. Amphiphile 5 was synthesised through the activation of 2-(2-aminophenyl)benzothiazole with 1,1′-carbonyldiimidazole in chloroform followed by the addition of TBA aminomethanesulfonate. The pure product was obtained as a pale-yellow solid with a yield of 42%.Results and discussion
Solid state single crystal X-ray structures‡
Single crystal X-ray structures of 1, 2, 4 and 5 were obtained through the slow evaporation of a DMSO![[thin space (1/6-em)]](https://www.rsc.org/images/entities/char_2009.gif) :
:![[thin space (1/6-em)]](https://www.rsc.org/images/entities/char_2009.gif) H2O solution containing the relevant amphiphile. A structure for 3 has already been published25 and shows the sulfonate–urea portion of the amphiphilic salt forming hydrogen bonded tapes through an intermolecular urea–sulfonate complexation process. As shown in Fig. 1, the crystal structure obtained for 2 also shows the formation of a sulfonate–urea hydrogen bonded complex however, in this case we observe the formation of a dimer stabilised by four intermolecular hydrogen bonds. Each of the four NH groups acts as a HBD, with an oxygen atom of the anionic sulfonate group acting as the HBA. The interior angle of self-association, calculated from the intersecting planes of the urea substituents, shows this dimer to be planar. The analogous crystal structure obtained for 4 (Fig. 2) again shows a sulfonate–urea dimer, with four intermolecular hydrogen bonds. In this instance, and unlike 2, the NH HBD groups each form a hydrogen bond with a different HBA sulfonate oxygen atom. This causes the formation of a non-planar dimer with a 55.1(2)° interior angle of self-association.
H2O solution containing the relevant amphiphile. A structure for 3 has already been published25 and shows the sulfonate–urea portion of the amphiphilic salt forming hydrogen bonded tapes through an intermolecular urea–sulfonate complexation process. As shown in Fig. 1, the crystal structure obtained for 2 also shows the formation of a sulfonate–urea hydrogen bonded complex however, in this case we observe the formation of a dimer stabilised by four intermolecular hydrogen bonds. Each of the four NH groups acts as a HBD, with an oxygen atom of the anionic sulfonate group acting as the HBA. The interior angle of self-association, calculated from the intersecting planes of the urea substituents, shows this dimer to be planar. The analogous crystal structure obtained for 4 (Fig. 2) again shows a sulfonate–urea dimer, with four intermolecular hydrogen bonds. In this instance, and unlike 2, the NH HBD groups each form a hydrogen bond with a different HBA sulfonate oxygen atom. This causes the formation of a non-planar dimer with a 55.1(2)° interior angle of self-association.
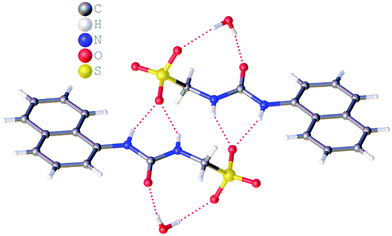 | ||
| Fig. 1 Single crystal X-ray structure of 2, illustrating dimerization through urea–anion complexation. TBA counter cations have been omitted for clarity. Interior angle of self-association = 180.0°. | ||
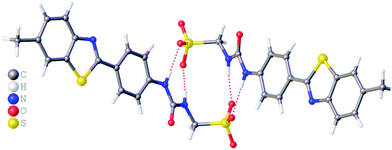 | ||
| Fig. 2 Single crystal X-ray structure of 4, illustrating dimerization through urea–anion complexation. TBA counter cations and associated water molecules have been omitted for clarity. | ||
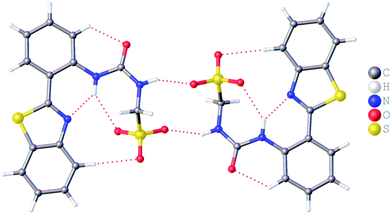
The crystal structure of 5 also forms a sulfonate–urea hydrogen bonded dimer, as shown in Fig. 3. In this example the dimer is only stabilised through the formation of two intermolecular sulfonate–urea hydrogen bonds due to the intramolecular hydrogen bond formed between the HBA benzothiazole nitrogen and a HBD NH urea group. This means that this NH group is no longer free to form dimer stabilising intermolecular hydrogen bonds. As with 2, calculation of the interior angle of self-association shows this dimer to be planar.
It is well known that anthracene undergoes oxidation to form anthraquinone.28 From the crystal structure shown in Fig. 4, we see that the anthracene substituent of 1 is susceptible to this process. However, this crystal structure is also an example of molecular self-sorting. During the two week crystallisation process a proportion of 1 was oxidised to form the analogous anthraquinone. The dimer formed is again stabilised through the formation of four intermolecular sulfonate–urea hydrogen bonds, in an identical arrangement to that observed for 4. This results in the formation of a dimer with an interior hydrogen bond angle of 15.3(4)°, ≈3.5 times smaller than that observed with 4. This is because the dimer is unsymmetrical, containing two different monomeric units, one electron rich (anthracene) and one electron poor (anthraquinone). The interaction of these electron rich and electron poor aromatic ring systems bring together the planes of the dimer. In light of this observation, when studying the self-association properties of 1 in both the solution and gas phase, periodic 1H NMR studies were preformed to ensure the purity of the compound used.
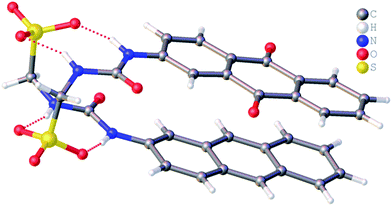 | ||
| Fig. 4 Single crystal X-ray structure of 1, illustrating dimerization through urea–anion complexation. TBA counter cations have been omitted for clarity. | ||
Gas phase mass spectrometry
As shown in Table 1, the presence of dimerised sulfonate–urea anionic monomers for 1–4 was also observed in the gas phase through high resolution electrospray mass spectrometry experiments. Although the differentiation of the anionic monomer ([M]−) or dimer ([M + M]2−) was not possible using these methods, the presence of mono-protonated sulfonate–urea dimer ([M + M + H]−) was observed in all cases except for that of 5. This is likely due to the presence of the intramolecular hydrogen bond formed between the benzothiazole and urea NH, cf.Fig. 3, limiting the number of potential HBD groups available to stabilise the formation of the protonated dimeric unit.| Amphiphile | m/z [M]− | m/z [M + M + H+]− | ||
|---|---|---|---|---|
| Theoretical | Actual | Theoretical | Actual | |
| 1 | 329.0602 | 329.0567 | 659.1204 | 659.1210 |
| 2 | 279.0445 | 278.9615 | 559.0890 | 558.9373 |
| 3 | 229.0289 | 229.0292 | 459.0578 | 459.0649 |
| 4 | 376.0431 | 376.039 | 753.0862 | 753.0864 |
| 5 | 362.0275 | 362.0261 | Not observed | |
Solution state studies
Unlike the gas or solid states, the solution state behaviour are influenced by the introduction of solvent–solute interactions. These solvent–solute interactions will affect molecular self-association events and resultant aggregate formation processes. Solvent molecules can act as HBD or HBA, which compete with those of the amphiphiles themselves. This may disrupt weaker hydrogen bonds that are observed within the solid state that are now outcompeted through the formation of more favourable solvent–solute interactions. The type of solvent within a system will also dictate the type of extended aggregates formed, maximising favourable interactions with the amphiphilic monomeric unit.Dynamic light scattering (DLS) studies
The self-association properties of 1, 3, 4 and 5 were first explored in DMSO though DLS studies. Fig. 5 gives an overview of these results through comparison of peak maxima obtained from average intensity size distribution studies. Amphiphile 2 could not be observed via these methods due to specific absorbance and fluorescence. In order to ensure that the self-associated superstructures formed had achieved a thermodynamic minimum the samples underwent an annealing process (heating to 40 °C and cooling back to 25 °C).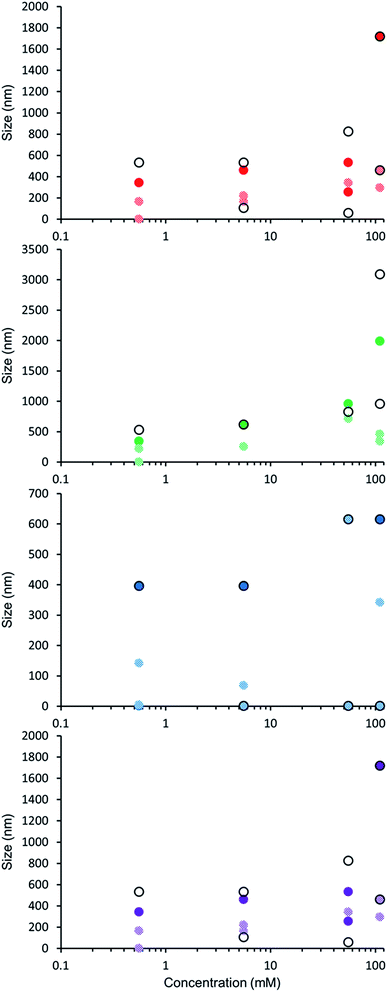 | ||
| Fig. 5 Graph comparing peak maxima obtained from average intensity particle size distribution of 1 and 3–5 in DMSO by DLS. Samples were measured at 25 °C (dark solid filled circles), then heated to 40 °C (light patterned filled circles) and after cooling back to 25 °C (black unfilled circles). The full data sets, including peak widths, can be found within the ESI.† Red = 1, green = 3, blue = 4, purple = 5. | ||
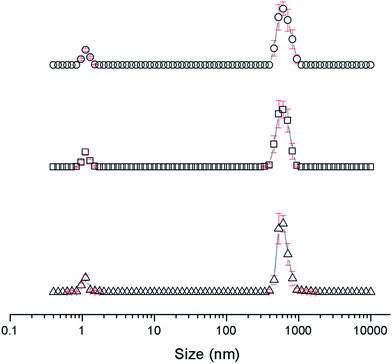
DLS studies show the presence of three different sized structures within a DMSO solution of 1–5. The first approximately 1 nM in diameter is likely to be the sulfonate–urea monomer or dimeric species, the second approximately 200–600 nM is attributed to a larger self-associated species, and a third >1000 nm is likely to be an aggregate of the smaller self-associated species. This third species is not observed with 4 and is most prevalent with 5. The concentration of these largest structures decreases when diluted and/or annealed, further supporting the hypothesis that these structures are aggregates of smaller ones. By comparison the mid-size species remain fairly stable in solution throughout the annealing process. Although there is a decrease in size with increasing temperature, the original sized structures are regenerated upon cooling. There is a general decrease in size of these aggregates with decreasing concentration from 111.27 mM to 0.56 mM. The smallest sized aggregates (≈1 nm) are observed primarily with 4 as shown in Fig. 6 however; as this information has been obtained from an intensity distribution the presence of a few large structures in solution can mask the presence of smaller ones, especially in instances where the differences in size of these aggregates can be greater than 1000 nm.
In order to compare the effects of altering solvent conditions on the self-associated aggregates present in solution, comparative DLS studies were conducted with 1–5 in a variety of aqueous mixtures. The concentration of these studies was determined by the solubility of these amphiphiles. A comparison of those structures observed by DLS can be seen in Table 2. Moving from a 100% DMSO solution to a DMSO![[thin space (1/6-em)]](https://www.rsc.org/images/entities/char_2009.gif) :
:![[thin space (1/6-em)]](https://www.rsc.org/images/entities/char_2009.gif) H2O 1
H2O 1![[thin space (1/6-em)]](https://www.rsc.org/images/entities/char_2009.gif) :
:![[thin space (1/6-em)]](https://www.rsc.org/images/entities/char_2009.gif) 1 mixture appears to stabilise larger aggregate structures, whereas further increasing the percentage of H2O results in a general decrease the aggregate size. In order to increase the molarity of amphiphile with increasing proportions of H2O, DMSO was replaced with ethanol. Excluding evidence of dimer/monomer within the solution state, in an EtOH
1 mixture appears to stabilise larger aggregate structures, whereas further increasing the percentage of H2O results in a general decrease the aggregate size. In order to increase the molarity of amphiphile with increasing proportions of H2O, DMSO was replaced with ethanol. Excluding evidence of dimer/monomer within the solution state, in an EtOH![[thin space (1/6-em)]](https://www.rsc.org/images/entities/char_2009.gif) :
:![[thin space (1/6-em)]](https://www.rsc.org/images/entities/char_2009.gif) H2O 1
H2O 1![[thin space (1/6-em)]](https://www.rsc.org/images/entities/char_2009.gif) :
:![[thin space (1/6-em)]](https://www.rsc.org/images/entities/char_2009.gif) 19 mixture, 1–5 only show the formation of a single type of aggregated structure exhibiting the following tend 3 (400 nm) > 2 (260 nm) > 5 (220 nm) > 1 (160 nm) > 4 (120 nm). In splitting this family of amphiphiles into two sub groups: sub-group one containing 1, 2 and 3 with decreasing aromatic ring system size, and sub-group two containing 4 and 5 which both have benzothiazole substituents. Considering these two sub-groups independently shows the increase the aromatic ring system size (1 > 2 > 3) to correlate with decreasing size aggregates (1 < 2 < 3). We also observe that in general, intramolecular hydrogen bonded 5 forms larger structures than 4.
19 mixture, 1–5 only show the formation of a single type of aggregated structure exhibiting the following tend 3 (400 nm) > 2 (260 nm) > 5 (220 nm) > 1 (160 nm) > 4 (120 nm). In splitting this family of amphiphiles into two sub groups: sub-group one containing 1, 2 and 3 with decreasing aromatic ring system size, and sub-group two containing 4 and 5 which both have benzothiazole substituents. Considering these two sub-groups independently shows the increase the aromatic ring system size (1 > 2 > 3) to correlate with decreasing size aggregates (1 < 2 < 3). We also observe that in general, intramolecular hydrogen bonded 5 forms larger structures than 4.
| Solvent | Conc. (mM) | 1 | 2 | 3 | 4 | 5 |
|---|---|---|---|---|---|---|
| a The absorbance and emission properties of this amphiphile prevented DLS measurements. | ||||||
| DMSO | 5.56 | 530, 110 | 620 | 400 | 1100 | |
| 1.1 | ||||||
| 0.56 | 530 | 530 | 400 | 530 | ||
| 0.7 | ||||||
DMSO![[thin space (1/6-em)]](https://www.rsc.org/images/entities/char_2009.gif) : :![[thin space (1/6-em)]](https://www.rsc.org/images/entities/char_2009.gif) H2O, 1 H2O, 1![[thin space (1/6-em)]](https://www.rsc.org/images/entities/char_2009.gif) : :![[thin space (1/6-em)]](https://www.rsc.org/images/entities/char_2009.gif) 1 1 |
5.56 | 2000 | 620 | 2000 | 1300 | 2300 |
| 460 | 220 | 260 | ||||
| 0.56 | 1100 | 960 | 530 | 960 | 2700 | |
| 710 | ||||||
DMSO![[thin space (1/6-em)]](https://www.rsc.org/images/entities/char_2009.gif) : :![[thin space (1/6-em)]](https://www.rsc.org/images/entities/char_2009.gif) H2O, 3 H2O, 3![[thin space (1/6-em)]](https://www.rsc.org/images/entities/char_2009.gif) : :![[thin space (1/6-em)]](https://www.rsc.org/images/entities/char_2009.gif) 7 7 |
5.56 | 340 | 830 | 1100 | 460 | 1300 |
| 79 | ||||||
| 0.56 | 400 | 400 | 620 | 620 | 340 | |
DMSO![[thin space (1/6-em)]](https://www.rsc.org/images/entities/char_2009.gif) : :![[thin space (1/6-em)]](https://www.rsc.org/images/entities/char_2009.gif) H2O, 1 H2O, 1![[thin space (1/6-em)]](https://www.rsc.org/images/entities/char_2009.gif) : :![[thin space (1/6-em)]](https://www.rsc.org/images/entities/char_2009.gif) 4 4 |
0.56 | 340 | 340 | 710 | 620 | 830 |
| 59 | 70 | 91 | ||||
EtOH![[thin space (1/6-em)]](https://www.rsc.org/images/entities/char_2009.gif) : :![[thin space (1/6-em)]](https://www.rsc.org/images/entities/char_2009.gif) H2O, 1 H2O, 1![[thin space (1/6-em)]](https://www.rsc.org/images/entities/char_2009.gif) : :![[thin space (1/6-em)]](https://www.rsc.org/images/entities/char_2009.gif) 19 19 |
5.56 | 220 | 160 | 220 | 300 | 300 |
| 59 | ||||||
| 0.56 | 160 | 260 | 400 | 120 | 220 | |
| 0.8 | ||||||
Microscopy studies
Amphiphiles 1, 2, 4 and 5 are intrinsically fluorescent, allowing direct observation of aggregates formed in the solution state through a combination of transmission and fluorescence microscopy techniques. This allows for confirmation of the results obtained through indirect methods such as DLS. Comparing identical images obtained through these two microscopy techniques also enables the locations of comparatively high concentrations of the sulfonate–urea anion to be identified. The excitation and emission properties of 1, 2, 4 and 5, in analogous solvent mixtures to those used in comparative DLS studies are presented in Table 3.| λ max (nm) | Solvent | |||||
|---|---|---|---|---|---|---|
| DMSO | DMSO![[thin space (1/6-em)]](https://www.rsc.org/images/entities/char_2009.gif) : :![[thin space (1/6-em)]](https://www.rsc.org/images/entities/char_2009.gif) H2O, 1 H2O, 1![[thin space (1/6-em)]](https://www.rsc.org/images/entities/char_2009.gif) : :![[thin space (1/6-em)]](https://www.rsc.org/images/entities/char_2009.gif) 1 1 |
DMSO![[thin space (1/6-em)]](https://www.rsc.org/images/entities/char_2009.gif) : :![[thin space (1/6-em)]](https://www.rsc.org/images/entities/char_2009.gif) H2O, 3 H2O, 3![[thin space (1/6-em)]](https://www.rsc.org/images/entities/char_2009.gif) : :![[thin space (1/6-em)]](https://www.rsc.org/images/entities/char_2009.gif) 7 7 |
DMSO![[thin space (1/6-em)]](https://www.rsc.org/images/entities/char_2009.gif) : :![[thin space (1/6-em)]](https://www.rsc.org/images/entities/char_2009.gif) H2O, 1 H2O, 1![[thin space (1/6-em)]](https://www.rsc.org/images/entities/char_2009.gif) : :![[thin space (1/6-em)]](https://www.rsc.org/images/entities/char_2009.gif) 4 4 |
EtOH![[thin space (1/6-em)]](https://www.rsc.org/images/entities/char_2009.gif) : :![[thin space (1/6-em)]](https://www.rsc.org/images/entities/char_2009.gif) H2O, 1 H2O, 1![[thin space (1/6-em)]](https://www.rsc.org/images/entities/char_2009.gif) : :![[thin space (1/6-em)]](https://www.rsc.org/images/entities/char_2009.gif) 19 19 |
||
| 1 | λ ex | 281 | 276 | 272 | 274 | 260 |
| λ em | 445 | 441 | 437 | 432 | 437 | |
| ΔλST | 164 | 165 | 165 | 158 | 177 | |
| 2 | λ ex | 315 | 337 | 294 | 296 | 224 |
| λ em | 377 | 395 | 377 | 377 | 380 | |
| ΔλST | 62 | 58 | 83 | 81 | 156 | |
| 4 | λ ex | 339 | 335 | 333 | 332 | 331 |
| λ em | 392 | 395 | 394 | 397 | 399 | |
| ΔλST | 53 | 60 | 61 | 65 | 68 | |
| 5 | λ ex | 280 | 280 | 283 | 285 | 229 |
| λ em | 430 | 419 | 419 | 417 | 415 | |
| ΔλST | 150 | 139 | 136 | 132 | 186 | |
As the type of aggregate formed is solvent dependent, observing the aggregates directly in the solution state has distinct advantages over methods that involve the de-solvation or freezing of a sample. As with all imaging techniques, observations made may not be representative of the sample bulk. Microscopy results, without comparative studies such as DLS or NMR, should be taken as qualitative rather than quantitative unless otherwise stated. The excitation and emission properties of 1 and 2 prevented observations of those structures in solution by fluorescence microscopy due to inherent background fluorescence and a comparatively small Stoke shift leading to incompatibility with microscope filters respectively. Solutions containing 4 and 5 were successfully visualised at comparative concentrations to those DLS studies, providing unambiguous structure identification.
In line with techniques previously reported by Levin29 the movement of these aggregates in solution was restricted by placing 10 μL of the appropriate solution to be observed onto an agarose pad. A cover slip was then applied to the surface of the sample to prevent solvent evaporation. Interaction of the aggregates with the agarose pad allows clear images to be obtained. Photobleaching during the imaging led to a loss of fluorescence emission intensity, and therefore some amphiphile aggregates could not be successfully captured in one or both images. Comparing the images obtained for 4, it appears that in a DMSO solution (Fig. 7) those structures formed are conglomerates of smaller aggregated species whereas in a DMSO![[thin space (1/6-em)]](https://www.rsc.org/images/entities/char_2009.gif) :
:![[thin space (1/6-em)]](https://www.rsc.org/images/entities/char_2009.gif) H2O 1
H2O 1![[thin space (1/6-em)]](https://www.rsc.org/images/entities/char_2009.gif) :
:![[thin space (1/6-em)]](https://www.rsc.org/images/entities/char_2009.gif) 19 mixture (Fig. 8) there is evidence of larger singular aggregate species with little internal structure. A similar type of structure to that seen in Fig. 8 was observed for 5 in a EtOH
19 mixture (Fig. 8) there is evidence of larger singular aggregate species with little internal structure. A similar type of structure to that seen in Fig. 8 was observed for 5 in a EtOH![[thin space (1/6-em)]](https://www.rsc.org/images/entities/char_2009.gif) :
:![[thin space (1/6-em)]](https://www.rsc.org/images/entities/char_2009.gif) H2O 1
H2O 1![[thin space (1/6-em)]](https://www.rsc.org/images/entities/char_2009.gif) :
:![[thin space (1/6-em)]](https://www.rsc.org/images/entities/char_2009.gif) 19 mixture (Fig. 9).
19 mixture (Fig. 9).
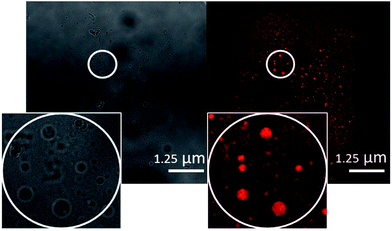 | ||
| Fig. 7 A transmitted light image (left) and DAPI filter composite image (right) of 4 (0.50 mM) in DMSO. An example of those aggregates formed has been circled for clarity. | ||
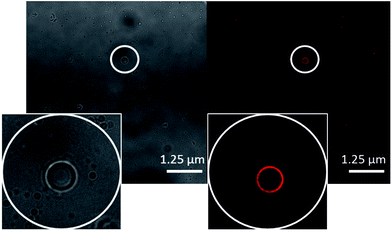 | ||
Fig. 8 A transmitted light image (left) and DAPI filter composite image (right) of 4 (0.50 mM) in a DMSO![[thin space (1/6-em)]](https://www.rsc.org/images/entities/char_2009.gif) : :![[thin space (1/6-em)]](https://www.rsc.org/images/entities/char_2009.gif) H2O 1 H2O 1![[thin space (1/6-em)]](https://www.rsc.org/images/entities/char_2009.gif) : :![[thin space (1/6-em)]](https://www.rsc.org/images/entities/char_2009.gif) 19 mixture. An example of those aggregates formed has been circled for clarity. 19 mixture. An example of those aggregates formed has been circled for clarity. | ||
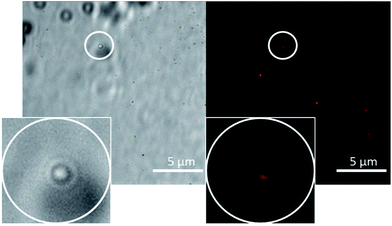 | ||
Fig. 9 A transmitted light image (left) and DAPI filter composite image (right) of 5 (0.50 mM) in a EtOH![[thin space (1/6-em)]](https://www.rsc.org/images/entities/char_2009.gif) : :![[thin space (1/6-em)]](https://www.rsc.org/images/entities/char_2009.gif) H2O 1 H2O 1![[thin space (1/6-em)]](https://www.rsc.org/images/entities/char_2009.gif) : :![[thin space (1/6-em)]](https://www.rsc.org/images/entities/char_2009.gif) 19 mixture. An example of those aggregates formed has been circled for clarity. 19 mixture. An example of those aggregates formed has been circled for clarity. | ||
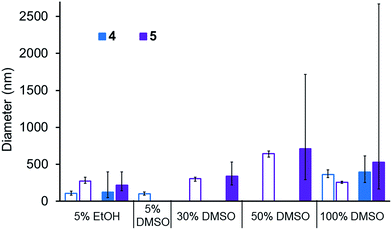
A comparison of the average size and spread of size for the aggregate structures formed by 4 and 5 in different solvent mixtures obtained by DLS and microscopy techniques is shown in Fig. 10. The average size of those aggregated structures observed by these different methods is in good agreement. In most instances the average size of those structures observed by DLS is slightly higher than those observed by microscopy which is as expected. Using microscopy measurements, we are able to measure the actual size of the aggregate, whereas DLS measurements includes the solvation sphere surrounding the aggregate. The size of all structures observed by microscopy methods lie within the spread of aggregate sizes that are observed by DLS.
NMR studies
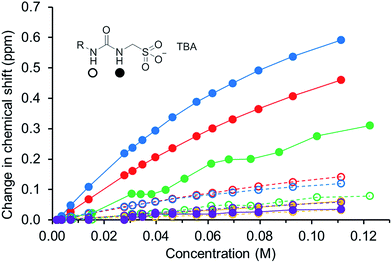
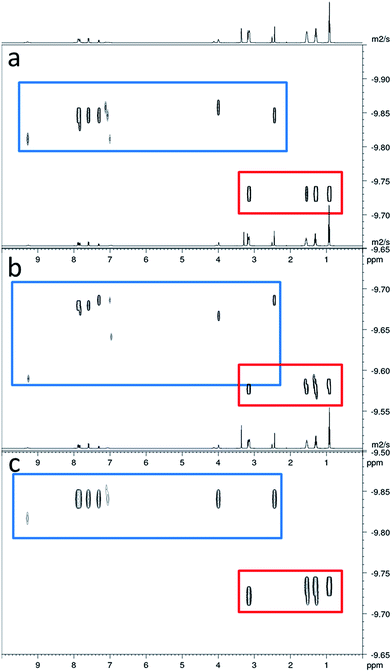
In order to gain some understanding of molecular level self-association interactions, 1H NMR dilution studies of 1–5 were conducted in a DMSO-d6 – 0.5% H2O mixture (Fig. 11). This solvent system was chosen to allow the direct observation of the HBD urea NH groups. The DLS studies indicated the presence of a small species within this solvent system ≈1 nm in diameter including solvation sphere (Fig. 6). The comparatively low count rate observed within the DLS studies for this solvent system suggests that the majority of the self-associated sulfonate–urea within the DMSO solution exists as dimers. To establish if this is the case a proof-of-principle 1H NMR DOSY experiment was conducted with 4 at 55.56 mM, mimicking DLS experimental conditions. This experiment allows estimation for the size of self-associated species, visible by 1H NMR spectroscopy. The comparative results for these studies are shown in Fig. 12.The 1H DOSY studies show that the TBA counter cation has a different diffusion constant from that of the sulfonate–urea anion, demonstrating that these two species are not strongly coordinated in solution. The translational diffusion constant obtained from 1H NMR DOSY was used to calculate the hydrodynamic diameter of the anionic species in solution, via the Stokes–Einstein equation.30 As with DLS, the size of these structures should be treated with caution as these approximations assume that the structure observed is a sphere and that the size of the complex is large compared to that of the solvent.31 These systems (as shown by the dilution studies) exist in fast exchange, which can also cause complications with data interpretation.32,33 The use of the NH signals to ascertain translational diffusion constants proved unreliable therefore diffusion constants were obtained from the aromatic CH and CH2 signals, giving upper and lower limits for the hydrodynamic radius of 4 at 26 °C (1.61 nm ≤ dH ≥ 1.66 nm), after being heated to 39 °C (1.44 nm ≤ dH ≥ 1.51 nm) and then cooled back to 26 °C (1.58 nm ≤ dH ≥ 1.61 nm). The comparative size of these structures calculated by DLS, stable during the entire annealing process was 1.12 nm (Fig. 6), which correlates well with the 1H DOSY NMR results. However, we do not observe the formation of the larger structures observed by DLS via this NMR method. In this case it is hypothesised that these larger structures exist in concentrations that are too low or the size of the aggregate is too large to be observed by this NMR method. The DLS experiments had already indicated that these larger structures may not exist in any great quantities within the solution state and a comparative 1H NMR experiment supports this. In this experiment a solution of 4 (111.12 mM) in DMSO-d6 was doped with 5 μL of DCM. Comparative integration of the DCM signal with the aromatic CH and CH2 signals of the sulfonate–urea showed no discernible loss of the sulfonate–urea anion from the solution, showing that the larger aggregated structures exist in very small quantities and therefore cannot be detected under these NMR experimental conditions. An analogous pair of 1H NMR experiments were conducted with 4 (≈6 mM) in D2O (0.5 mL) with the addition of ethanol (25 μL) and DMSO (5 μL) respectively into each experiment. Comparative integration showed the apparent loss of 10% and 14% of 4 in each case respectively. It is hypothesised that this ‘lost’ material is now invisible to the NMR spectrometer as it has effectively been removed from the solution state into the solid state aggregates.
The NMR experiments conducted with 4 show that only a very small percentage of the sulfonate–urea anion is held in the larger aggregate structures. The size of those structures remaining in solution (≈1 nm) would suggest that they are anionic dimers, such as those observed in solid state and gas phase experiments. The downfield change in chemical shift of the urea NHs with increasing concentration of amphiphile confirms the formation of a hydrogen bonded species. These data have been fitted to both dimerization/equal K (EK)34,35 and cooperative equal K (CoEK) models, see Table 4. These models both assume one component, one-dimensional homogenous aggregation36 with all self-association constants assumed equal for the EK model whereas the CoEK model assumes that the first self-association constant differs from that observed for identical subsequent events.37 For those models tested, the EK model gave the best fit to these dilution study data, with >70% monomer present in DMSO-d6 – 0.5% H2O solutions of 1–5 in a concentration less than 0.03 M. This further supports the hypothesis that we are predominately observing dimer formation within this solvent system and makes chemical sense when considering those single crystal X-ray structures presented in Fig. 1–4. Although the self-association constants are low we observe the following trend 4 (2.7 M−1) > 1 (1.5 M−1) > 5 (0.6 M−1) > 3 (0.3 M−1) > 2 (<0.1 M−1). This trend inversely correlates with the size of nanostructure observed by DLS in the solution state, the stronger the self-association the smaller the self-associated aggregate. As we increase the size of the sulfonate–urea anion from benzene to anthracene/benzathiazole we increase the dimerization constant and again see that the presence of the intramolecular hydrogen bond of 5 also lowers the self-association constant when compared to 4.
| Amphiphile | EK model (M−1) | CoEK model (M−1) | |||
|---|---|---|---|---|---|
| K e | K dim | K e | K dim | ρ | |
| a Data fitted using L-BFGS-B (quasi-Newtown) rather than Nelder–Mead (simplex) methods. | |||||
| 1 | 2.9 ± 0.5% | 1.5 ± 0.2% | 8.6 ± 1.1% | 4.3 ± 0.5% | 0.5 ± 2.5% |
| 2 | <0.1 ± 1.5% | <0.1 ± 0.8% | 0.5 ± 43.1% | 0.3 ± 21.5% | 0.0 ± 47.0% |
| 3 | 0.6 ± 3.0% | 0.3 ± 1.5% | 13.0 ± 5.7% | 6.5 ± 2.9% | 0.2 ± 23.8% |
| 4 | 5.3 ± 0.6% | 2.7 ± 0.3% | 13.0 ± 0.7% | 6.5 ± 0.3% | 0.5 ± 2.0% |
| 5 | 1.2 ± 2.1% | 0.6 ± 1.1% | 6.2 ± 8.8% | 3.1 ± 4.4% | 0.4 ± 17.8% |
Surface tension and critical micelle concentration (CMC)
The surfactant properties of these amphiphilic molecules were also measured in a EtOH![[thin space (1/6-em)]](https://www.rsc.org/images/entities/char_2009.gif) :
:![[thin space (1/6-em)]](https://www.rsc.org/images/entities/char_2009.gif) H2O 1
H2O 1![[thin space (1/6-em)]](https://www.rsc.org/images/entities/char_2009.gif) :
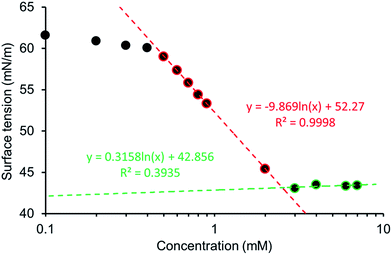
:![[thin space (1/6-em)]](https://www.rsc.org/images/entities/char_2009.gif) 19 mixture. The addition of 5% ethanol was to aid solubility, allowing comparison across this series of five amphiphiles. The pendent drop method was used to establish the surface tension of a solution containing decreasing concentrations of 1–5. This allowed the calculation of the CMC and surface tension as exemplified in Fig. 13 and in an analogous fashion to those experiments conducted by Costas and co-workers.39 Attempts were also made to study the surfactant effects of 1–5 in DMSO but results were not reproducible, presumably due to the hydroscopic nature of the solvent.
19 mixture. The addition of 5% ethanol was to aid solubility, allowing comparison across this series of five amphiphiles. The pendent drop method was used to establish the surface tension of a solution containing decreasing concentrations of 1–5. This allowed the calculation of the CMC and surface tension as exemplified in Fig. 13 and in an analogous fashion to those experiments conducted by Costas and co-workers.39 Attempts were also made to study the surfactant effects of 1–5 in DMSO but results were not reproducible, presumably due to the hydroscopic nature of the solvent.
The CMC values calculated for a EtOH![[thin space (1/6-em)]](https://www.rsc.org/images/entities/char_2009.gif) :
:![[thin space (1/6-em)]](https://www.rsc.org/images/entities/char_2009.gif) H2O 1
H2O 1![[thin space (1/6-em)]](https://www.rsc.org/images/entities/char_2009.gif) :
:![[thin space (1/6-em)]](https://www.rsc.org/images/entities/char_2009.gif) 19 solution are reviewed in Table 5 with the trend 4 < 1 < 5 < 2 < 3, with over an 80 fold increase in CMC observed between 4 (CMC = 0.50 mM) and 3 (CMC = 40.89 mM). The CMC for our most effective surfactant, 4, was also established in 100% H2O to be 0.81 mM. This is an order of magnitude lower than sodium dodecyl sulfate which has a reported CMC, under the same conditions of 8.08 (ref. 40) – 8.2 (ref. 41) mM. Comparative zeta potential measurements (Table 5), obtained for 1, 2, 4 and 5 (5.56 mM) in a EtOH
19 solution are reviewed in Table 5 with the trend 4 < 1 < 5 < 2 < 3, with over an 80 fold increase in CMC observed between 4 (CMC = 0.50 mM) and 3 (CMC = 40.89 mM). The CMC for our most effective surfactant, 4, was also established in 100% H2O to be 0.81 mM. This is an order of magnitude lower than sodium dodecyl sulfate which has a reported CMC, under the same conditions of 8.08 (ref. 40) – 8.2 (ref. 41) mM. Comparative zeta potential measurements (Table 5), obtained for 1, 2, 4 and 5 (5.56 mM) in a EtOH![[thin space (1/6-em)]](https://www.rsc.org/images/entities/char_2009.gif) :
:![[thin space (1/6-em)]](https://www.rsc.org/images/entities/char_2009.gif) H2O 1
H2O 1![[thin space (1/6-em)]](https://www.rsc.org/images/entities/char_2009.gif) :
:![[thin space (1/6-em)]](https://www.rsc.org/images/entities/char_2009.gif) 19 solution, confirmed that these solutions contained stable aggregates (−30 mV ≥ zeta potential ≥ +30 mV). In comparison a solution of 3 was shown to contain structures with incipient stability. This measurement was obtained at a concentration below the CMC in the case of 3, 2 and 5, however this does not mean that stable aggregated species do not exist in solution.42
19 solution, confirmed that these solutions contained stable aggregates (−30 mV ≥ zeta potential ≥ +30 mV). In comparison a solution of 3 was shown to contain structures with incipient stability. This measurement was obtained at a concentration below the CMC in the case of 3, 2 and 5, however this does not mean that stable aggregated species do not exist in solution.42
| Amphiphile | EtOH![[thin space (1/6-em)]](https://www.rsc.org/images/entities/char_2009.gif) : :![[thin space (1/6-em)]](https://www.rsc.org/images/entities/char_2009.gif) H2O 1 H2O 1![[thin space (1/6-em)]](https://www.rsc.org/images/entities/char_2009.gif) : :![[thin space (1/6-em)]](https://www.rsc.org/images/entities/char_2009.gif) 19 19 |
H2O | |||
|---|---|---|---|---|---|
| Zeta potential (mV) | CMC (mM) | Surface tension (mN m−1) | CMC (mM) | Surface tension | |
| 1 | −82 | 2.52 | 43.15 | ||
| 2 | −96 | 10.67 | 46.67 | ||
| 3 | −19 | 40.89 | 47.90 | ||
| 4 | −101 | 0.50 | 46.50 | 0.81 | 54.68 |
| 5 | −79 | 9.54 | 48.71 | ||
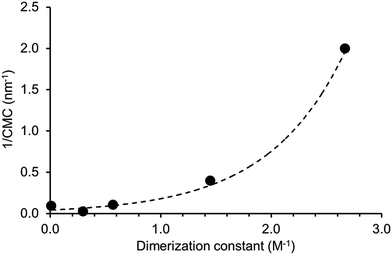
A plot of reciprocal CMC (obtained for a EtOH![[thin space (1/6-em)]](https://www.rsc.org/images/entities/char_2009.gif) :
:![[thin space (1/6-em)]](https://www.rsc.org/images/entities/char_2009.gif) H2O 1
H2O 1![[thin space (1/6-em)]](https://www.rsc.org/images/entities/char_2009.gif) :
:![[thin space (1/6-em)]](https://www.rsc.org/images/entities/char_2009.gif) 19 solution) vs. dimerization constant (obtained in DMSO-d6 – 0.5% H2O) reveals a correlation between these two experimentally derived values (Fig. 14). As the strength of dimerization increases the CMC is shown to decrease. Water and DMSO are both highly competitive hydrogen bonding solvents. However as previously demonstrated, DMSO is not hydrophilic enough to extensively stabilise extended self-associated aggregates in solution, whereas an EtOH
19 solution) vs. dimerization constant (obtained in DMSO-d6 – 0.5% H2O) reveals a correlation between these two experimentally derived values (Fig. 14). As the strength of dimerization increases the CMC is shown to decrease. Water and DMSO are both highly competitive hydrogen bonding solvents. However as previously demonstrated, DMSO is not hydrophilic enough to extensively stabilise extended self-associated aggregates in solution, whereas an EtOH![[thin space (1/6-em)]](https://www.rsc.org/images/entities/char_2009.gif) :
:![[thin space (1/6-em)]](https://www.rsc.org/images/entities/char_2009.gif) H2O 1
H2O 1![[thin space (1/6-em)]](https://www.rsc.org/images/entities/char_2009.gif) :
:![[thin space (1/6-em)]](https://www.rsc.org/images/entities/char_2009.gif) 19 solution is.
19 solution is.
In silico studies
In 2004, Hunter proposed that, even at a low level of theory, computationally derived electrostatic potential maps calculated using an energy minimised structure and semi-empirical AM1 modelling methods would produce Emax and Emin surface values that correlate well with experimentally derived values.43 These surface energy maximum (Emax) and minimum (Emin) values, correspond to the principle HBD urea and HBA sulfonate sites respectively. Using analogous methodology we have used Spartan 16′′ with semi-empirical PM6 modelling methods to derive comparative Emax and Emin values such as those shown in Fig. 15. AM1 modelling methods were substituted for PM6 methods in line with work produced by Stewart.44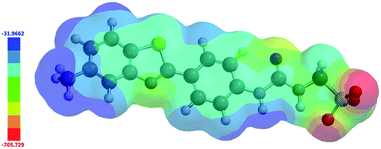 | ||
| Fig. 15 Electrostatic potential map calculated for 4 using semi-empirical PM6 modelling methods. Emax and Emin values depicted in the figure legend are given in kJ mol−1. | ||
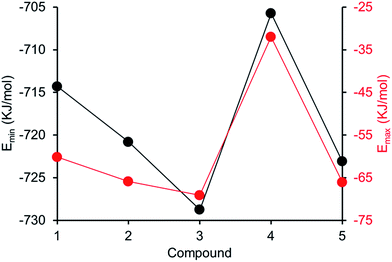
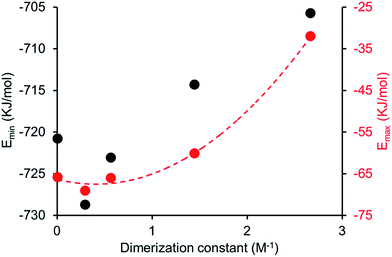
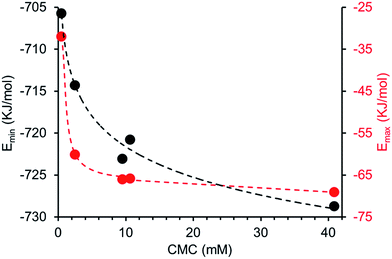
Comparing computationally derived Emax and Emin values (Fig. 16) across this series of five amphiphiles we see a general increase in both Emax and Emin values with increasing aromaticity from phenyl, to naphyl to anthracene. There is also a decrease in Emax and Emin values from 4 to 5, primarily due to the presence of the intramolecular hydrogen bond in 5. The trend in Emax and Emin values is as follows: 4 > 1 > 2 > 5 > 3. The decrease in Emax can be interpreted as a decrease in partial positive surface charge and therefore deactivation of the HBD group. These trends correlate with those observed for dimerization constant (Fig. 17) and are the inverse of those observed with CMC (Fig. 18). This is evidence that not only is CMC dependent on dimerization process but that these properties, for this class of amphiphile, may be predicted by simple computational modelling techniques.
Conclusions
In conclusion, we have synthesised four novel intrinsically fluorescent amphiphilic salts 1, 2, 4 and 5. We have shown how the self-association properties of this class of amphiphile vary based on their physical state. Single crystal X-ray diffraction experiments show 1, 2, 4 and 5 all form self-associated dimers through the formation of four hydrogen bonds, with the exception of 5 in which the dimer is only stabilised through the formation of two hydrogen bonds due to intramolecular hydrogen bond formation. Protonated forms of the sulfonate–urea dimers were observed in the gas phase for 1–4. Moving into the solution state the fluorescence properties of 1, 2, 4 and 5 were explored, resulting in the direct observation of those aggregates formed by 4 and 5 in a variety of aqueous solvent mixtures through a combination of fluorescence and transmission microscopy. Complimentary DLS, zeta potential and 1H NMR experiments have allowed us to ascertain the stability of those self-associated structures formed within different aqueous DMSO/ethanol solutions. In 100% DMSO this series of amphiphiles principally form dimeric structures, while moving to a higher percentage of water increases the percentage of larger aggregates observed. Low level semi-empirical PM6 modelling methods have been used to calculate comparative Emax and Emin values for 1–5. Those calculated values correlate well with experimentally derived dimerization constants and CMC values. We hypothesise that the surfactant properties (determined experimentally) of these five amphiphiles are dependent on the HBD capabilities of the urea substituent (predicted through computational modelling) and therefore the strength of dimerization (derived experimentally). It may consequently become possible to predict the surfactant properties of this class of amphiphile, through measuring the dimerization constant and/or simple computational techniques.Conflicts of interest
There are no conflicts of interest to declare.Acknowledgements
J. Hiscock would like to thank the University of Kent for the Caldin Fellowship, G. Thompson (NMR), K. Howland (mass spectrometry) and D. P. Mulvihill (microscopy). J. Hiscock and L. White (LJW) would also like to thank the Army Research Office (US) for funding for LJW MRes studentship (grant number W911NF-16-1-0247).Notes and references
- C. Wang, Z. Wang and X. Zhang, Acc. Chem. Res., 2012, 45, 608 CrossRef CAS PubMed
.
- G. Yu, K. Jie and F. Huang, Chem. Rev., 2015, 115, 7240 CrossRef CAS PubMed
.
- K. P. Nartowski, S. M. Ramalhete, P. C. Martin, J. S. Foster, M. Heinrich, M. D. Eddleston, H. R. Green, G. M. Day, Y. Z. Khimyak and G. O. Lloyd, Cryst. Growth Des., 2017, 17, 4100 CAS
.
- S. Kumar, K. Ludwig, B. Schade, H. von Berlepsch, I. Papp, R. Tyagi, M. Gulia, R. Haag and C. Boettcher, Chem.–Eur. J., 2016, 22, 5629 CrossRef CAS PubMed
.
- B. N. S. Thota, L. H. Urner and R. Haag, Chem. Rev., 2016, 116, 2079 CrossRef CAS PubMed
.
- J. Wang, X. Wang, F. Yang, H. Shen, Y. You and D. Wu, Langmuir, 2015, 31, 13834 CrossRef CAS PubMed
.
- D. F. Yu, Q. Zhang, C. X. Wu, Y. X. Wang, L. H. Peng, D. Q. Zhang, Z. B. Li and Y. L. Wang, J. Phys. Chem. B, 2010, 114, 8934 CrossRef CAS PubMed
.
- J. Tian, L. Chen, D. W. Zhang, Y. Liu and Z. T. Li, Chem. Commun., 2016, 52, 6351 RSC
.
- S. M. Ramalhete, K. P. Nartowski, N. Sarathchandra, J. S. Foster, A. N. Round, J. Angulo, G. O. Lloyd and Y. Z. Khimyak, Chem.–Eur. J., 2017, 23, 8014 CrossRef CAS PubMed
.
- N. M. Sangeetha and U. Maitra, Chem. Soc. Rev., 2005, 34, 821 RSC
.
- J. W. Steed, Chem. Commun., 2011, 47, 1379 RSC
.
- A. E. Hooper, S. R. Kennedy, C. D. Jones and J. W. Steed, Chem. Commun., 2016, 52, 198 RSC
.
- X. Zhou, G. Liu, K. Yamato, Y. Shen, R. Cheng, X. Wei, W. Bai, Y. Gao, H. Li, Y. Liu, F. Liu, D. M. Czajkowsky, J. Wang, M. J. Dabney, Z. Cai, J. Hu, F. V. Bright, L. He, X. C. Zeng, Z. Shao and B. Gong, Nat. Commun., 2012, 3(949), 1 Search PubMed
.
- X. Lin, M. Suzuki, M. Gushiken, M. Yamauchi, T. Karatsu, T. Kizaki, Y. Tani, K. Nakayama, M. Suzuki, H. Yamada, T. Kajitani, T. Fukushima, Y. Kikkawa and S. Yagai, Sci. Rep., 2017, 7(43098), 1 Search PubMed
.
- Nonappa, J. S. Haataja, J. V. I. Timonen, S. Malola, P. Engelhardt, N. Houbenov, M. Lahtinen, H. Hakkinen and O. Ikkala, Angew. Chem., Int. Ed., 2017, 56, 6473 CrossRef CAS PubMed
.
- N. Busschaert, C. Caltagirone, W. Van Rossom and P. A. Gale, Chem. Rev., 2015, 115, 8038 CrossRef CAS PubMed
.
- P. A. Gale and C. Caltagirone, Chem. Soc. Rev., 2015, 44, 4212 RSC
.
- J. R. Hiscock, N. J. Wells, J. A. Ede, P. A. Gale and M. R. Sambrook, Org. Biomol. Chem., 2016, 14, 9560 CAS
.
- C. M. C. Faustino, A. R. T. Calado and L. Garcia-Rio, J. Phys. Chem. B, 2009, 113, 977 CrossRef CAS PubMed
.
- C. M. C. Faustino, A. R. T. Calado and L. Garcia-Rio, Biomacromolecules, 2009, 10, 2508 CrossRef CAS PubMed
.
- C. M. C. Faustino, A. R. T. Calado and L. Garcia-Rio, J. Colloid Interface Sci., 2011, 359, 493 CrossRef CAS PubMed
.
- C. M. C. Faustino, A. R. T. Calado and L. Garcia-Rio, J. Colloid Interface Sci., 2012, 367, 286 CrossRef CAS PubMed
.
- C. M. C. Faustino, A. R. T. Calado and L. Garcia-Rio, J. Colloid Interface Sci., 2010, 351, 472 CrossRef CAS PubMed
.
- J. R. Hiscock, G. P. Bustone, B. Wilson, K. E. Belsey and L. R. Blackholly, Soft Matter, 2016, 12, 4221 RSC
.
- L. R. Blackholly, H. J. Shepherd and J. R. Hiscock, CrystEngComm, 2016, 18, 7021 RSC
.
- T. L. Gumbs, L. J. White, N. J. Wells, H. J. Shepherd and J. R. Hiscock, Supramol. Chem., 2017, 1, DOI:10.1080/10610278.2017.1351613
.
- R. Nagarajan and E. Ruckenstein, Langmuir, 1991, 7, 2934 CrossRef CAS
.
- A. Mallakin, B. J. McConkey, G. B. Miao, B. McKibben, V. Snieckus, D. G. Dixon and B. M. Greenberg, Ecotoxicol. Environ. Saf., 1999, 43, 204 CrossRef CAS PubMed
.
- P. A. Levin, Methods Microbiol., 2002, 31, 115 CAS
.
- J. P. Patterson, M. P. Robin, C. Chassenieux, O. Colombani and R. K. O'Reilly, Chem. Soc. Rev., 2014, 43, 2412 RSC
.
- A. Macchioni, G. Ciancaleoni, C. Zuccaccia and D. Zuccaccia, Chem. Soc. Rev., 2008, 37, 479 RSC
.
- J. A. Aguilar, R. W. Adams, M. Nilsson and G. A. Morris, J. Magn. Reson., 2014, 238, 16 CrossRef CAS PubMed
.
- A. D. Chen, C. S. Johnson, M. Lin and M. J. Shapiro, J. Am. Chem. Soc., 1998, 120, 9094 CrossRef CAS
.
- M. P. Evstigneev, A. S. Buchelnikov, V. V. Kostjukov, I. S. Pashkova and V. P. Evstigneev, Supramol. Chem., 2013, 25, 199 CrossRef CAS
.
- P. R. Stoesser and S. J. Gill, J. Phys. Chem., 1967, 71, 564 CrossRef CAS PubMed
.
- L. K. S. von Krbek, C. A. Schalley and P. Thordarson, Chem. Soc. Rev., 2017, 46, 2622 RSC
.
- R. B. Martin, Chem. Rev., 1996, 96, 3043 CrossRef CAS PubMed
.
-
P. Thordarson, K. Sewell and V. Efremova, Bindfit v0.5, http://www.supramolecular.org Search PubMed
.
- A. Pineiro, X. Banquy, S. Perez-Casas, E. Tovar, A. Garcia, A. Villa, A. Amigo, A. E. Mark and M. Costas, J. Phys. Chem. B, 2007, 111, 4383 CrossRef CAS PubMed
.
- M. S. Akhter, Colloids Surf., A, 1997, 121, 103 CrossRef CAS
.
- E. A. G. Aniansson, S. N. Wall, M. Almgren, H. Hoffmann, I. Kielmann, W. Ulbricht, R. Zana, J. Lang and C. Tondre, J. Phys. Chem., 1976, 80, 905 CrossRef CAS
.
- E. Ruckenstein and R. Nagarajan, J. Phys. Chem., 1975, 79, 2622 CrossRef CAS
.
- C. A. Hunter, Angew. Chem., Int. Ed., 2004, 43, 5310 CrossRef CAS PubMed
.
- J. J. P. Stewart, J. Mol. Model., 2007, 13, 1173 CrossRef CAS PubMed
.
- G. M. Sheldrick, Acta Crystallogr., Sect. A: Found. Adv., 2015, 71, 3 CrossRef PubMed
.
- G. M. Sheldrick, Acta Crystallogr., Sect. C: Struct. Chem., 2015, 71, 3 CrossRef PubMed
.
- O. V. Dolomanov, L. J. Bourhis, R. J. Gildea, J. A. K. Howard and H. Puschmann, J. Appl. Crystallogr., 2009, 42, 339 CrossRef CAS
.
Footnotes |
| † Electronic supplementary information (ESI) available: This includes experimental details and DLS, zeta potential, tensiometry, microscopy, mass spectrometry NMR, crystallography‡ and UV-Vis data. CCDC 1562758–1562761. For ESI and crystallographic data in CIF or other electronic format see DOI: 10.1039/c7sc03888g |
| ‡ A suitable crystal of each amphiphile was selected and mounted on a Rigaku Oxford Diffraction Supernova diffractometer. Data were collected using Cu Kα radiation at 100 K. Structures were solved with the ShelXT45 or ShelXS structure solution programs via direct methods and refined with ShelXL46 on least squares minimisation. Olex2 (ref. 47) was used as an interface to all ShelX programs. |
| This journal is © The Royal Society of Chemistry 2017 |

