 Open Access Article
Every photon counts: understanding and optimizing photon paths in luminescent solar concentrator-based photomicroreactors (LSC-PMs)†
Dario
Cambié
 a,
Fang
Zhao
a,
Volker
Hessel
a,
Michael G.
Debije
*b and
Timothy
Noël
a,
Fang
Zhao
a,
Volker
Hessel
a,
Michael G.
Debije
*b and
Timothy
Noël
 *a
*a
aDepartment of Chemical Engineering and Chemistry, Micro Flow Chemistry & Process Technology, Eindhoven University of Technology, Den Dolech 2, Eindhoven, 5612 AZ, The Netherlands. E-mail: T.Noel@tue.nl
bDepartment of Chemical Engineering and Chemistry, Functional Organic Materials & Devices, Eindhoven University of Technology, Den Dolech 2, Eindhoven, 5612 AZ, The Netherlands. E-mail: M.G.Debije@tue.nl
First published on 28th June 2017
Abstract
Luminescent solar concentrator-based photomicroreactors (LSC-PMs) have been recently proposed for sustainable and energy-efficient photochemical reactions. Herein, a Monte Carlo ray tracing algorithm to simulate photon paths within LSC-PMs was developed and experimentally validated. The simulation results were then used to investigate the expected efficiency of scaled-up devices. A novel metric, defined as the ‘Average Photon Path Traveled in the Device’ (APPTD), was introduced to measure the impact of different channel design choices and to rationalize the LSC-PM improvement over traditional LSC. The simulation results suggest that the combination of luminescent solar concentrators and continuous-flow photochemistry has the potential to become the most photon-efficient application of LSCs reported to date.
1. Introduction
Luminescent solar concentrators (LSCs) are thin sheets of luminophore-doped materials that collect, convert, and concentrate incident solar light at the edge(s) of the device.1 To those edges, photovoltaic cells are usually attached to produce electricity. LSCs possess the ability to absorb both the direct and the diffuse components of solar light and have been proposed for applications in building-integrated photovoltaics, smart-windows and noise barriers.2 Recently, we reported a novel device exploiting the LSC concept to enable solar-powered continuous-flow photochemistry called a luminescent solar concentrator photomicroreactor (LSC-PM).3Solar photochemistry is as old as photochemistry,4 yet, after the introduction of artificial light sources, less attention has been given to the use of sunlight as an energy source to promote chemical reactions.5 In recent years, according to the principles of green chemistry,6 the use of natural sunlight as a sustainable and cost-efficient energy source for photochemical reactions has attracted renewed interest.7 Among the several flow reactors proposed for solar photochemistry,8 the LSC-PM is unique as it is able to both (a) down-convert high-energy photons to match the absorption requirements of the reaction media and (b) transport photons within the light guide, decoupling the reactor volume from the irradiated area while simultaneously avoiding the significant heating of the reaction mixture experienced with optical concentrators.5 The use of LSC-PMs allows the increase of the photon-flux received by the reaction mixture flowing in the capillary with a corresponding acceleration in the reaction kinetics.9
In traditional LSCs, an increase in the luminophore doping does not automatically translate to an augmented edge emission, as reabsorption losses are also incremented.10 With LSC-PMs, by embedding the absorber within the lightguide, the need to deliver the waveguided photons all the way to the device edges is lifted. This means that the absorption efficiency can be increased (e.g. with higher dye loading) without impacting the collection efficiency, as reabsorption losses are limited by the shorter photon distance traveled through the device. This advantage of LSC-PM is expected to be more pronounced in large-area applications, where reabsorption losses and background absorption by the matrix are plaguing traditional LSCs.11
The individual processes taking place in an LSC, such as absorption and emission by the luminophore and total internal reflection, are relatively simple but their mutual connections and interplay, coupled with the optical complexity of a 3D geometry, can result in a complex system. In this context, the effect of different design parameters on the device efficiency might not be immediately clear. This complexity is further increased in the LSC-PM system, where the different contributions of direct and luminescent irradiation of the reaction mixture have to be taken into account as they can affect the reaction selectivity. We rationalized that the application of a ray tracing algorithm for the description of photon paths within the device could be useful to understand and help optimize the design of the device.
Here, we present a Monte Carlo-based ray tracing simulation algorithm to characterize the behavior of LSC-PMs and to guide further device design. After validation with experimental data, we modelled reactors with ideal geometries, even if not accessible with the current manufacturing processes, to probe the efficiency limits of the LSC-PM concept. This allows us to provide indications on the best parameters for the device design, and to estimate the maximum possible efficiency of the system.
2. Model description
The first use of Monte Carlo simulations in LSC optimization dates back to the early 1980s.12 Since then, ray tracing simulations have been frequently applied to the modeling of LSC devices as their simplicity and generally good agreement with the experimental results produced valid insights on several aspects of device performance.13 For our simulation, we have used a modified version of PvTrace, a Python Monte Carlo ray-tracing algorithm designed to model LSCs.14The simulation starts by generating a photon and follows it until either (a) it reaches the boundaries of the 3D virtual space, (b) it is lost due to non-radiative phenomena or (c) it is stuck in a loop for more than 50 iterations. The photon wavelengths are randomly assigned within an AM 1.5G-based probability distribution function, to mimic the solar spectrum, and the incoming angle of the incident photon is set normal to the LSC-PM top surface.
At each encounter of the photon trajectory with an object, the probabilities of reflection and refraction are considered, and for each distance traveled in an object the probability of absorption (and, possibly, reemission) is evaluated. The outcomes of all these probabilities are then determined by the Monte Carlo method (i.e. by random sampling the respective probability distribution functions). A schematic representation of the main decision steps with the relevant physical properties is presented in the flowchart in Scheme 1.
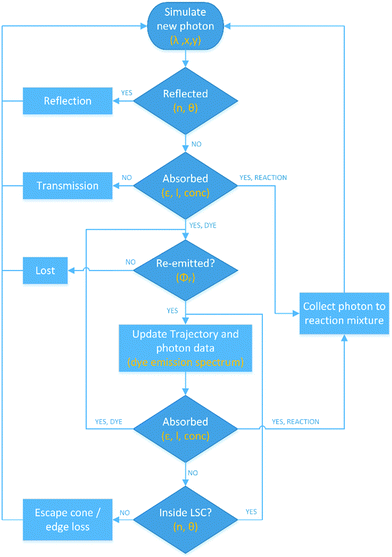 | ||
| Scheme 1 Schematic representation of the algorithm decision tree. For each step, the relevant physical entities are highlighted. | ||
The trajectories of all the photons are saved in a database that is queried at the end of the simulation to count the number of photons per each photon fate (i.e. reflected, transmitted, edge-emitted, absorbed in the reaction mixture or lost in a non-radiative process). As all the data associated with the simulated photons are stored in the simulation database, further analysis of the photon paths can be carried out after the simulation ends, for example, generating spectral distribution of the photons per each fate, resulting in a complete photon-balance graph.
3. Model validation
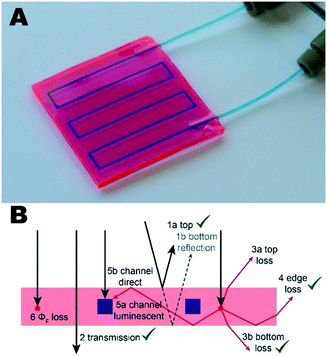
To model the reaction channels embedded in the lightguide, the original PvTrace program had to be significantly rewritten; therefore we sought to validate experimentally as many model-calculated photon fates as possible. As shown in Fig. 1, the possible fates of the photons impinging the device are: (1) top reflection, (2) transmission through the device, (3) emission within escape cone (either on the top or bottom side), (4) edge emission, (5) absorption by the reaction media (either of primary or secondary photons), and (6) losses, including non-unity fluorescence quantum yield and matrix absorption. All the outcomes marked with a green tick in Fig. 1 were directly compared against experimental results.3.1. Reflection
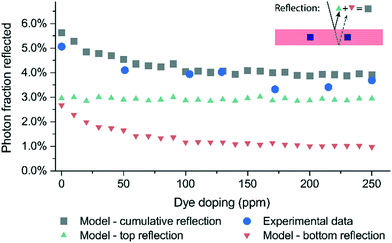
When a photon reaches the top or bottom surface of the LSC-PM, there is a small but non-negligible probability that it will be reflected. As the intersection between the photon trajectory and the device is the first event in the ray-tracing chain, it is important that it is modeled accurately. Reflection probabilities are evaluated by the algorithm according to Fresnel reflectance equations. With irradiation normal to the device surface, and considering the polydimethylsiloxane (PDMS) matrix refractive index (i.e. 1.41), the calculated probability of top reflection is 2.9% (see the ESI†).Yet, both the simulations and the experimental measurements evidenced higher reflections (about 5%). This is due to the reflections which occur both at the top and bottom surfaces of the device (second surface reflection) as clarified by the dye-doping dependence of this second contribution (see Fig. 2 and the ESI†). Gratifyingly, the agreement between the experimental and the simulation data is quite good.
3.2. Transmission
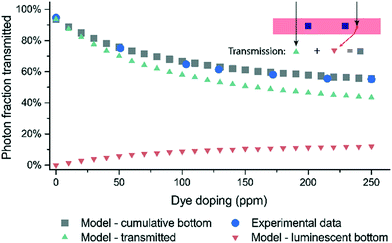
The transmission spectrum constitutes the second benchmark for the model. In the model, the absorption spectrum of the device is simply calculated by adding the background absorption of the matrix with the Lumogen F Red 305 absorption spectrum in PDMS. Indeed, a perfect agreement of the model with the experimental data both in terms of optical transmission (Fig. 3) and its wavelength distribution was observed (see the ESI†).3.3. Edge emission
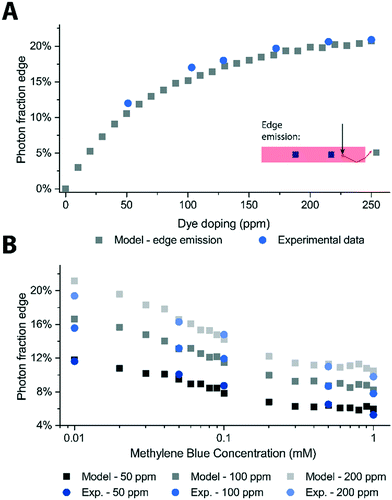
Unlike a PV cell, LSCs do not have a standardized performance characterization metric. Yet, as their traditional target is to deliver photons at the edge of the device, virtually all the benchmarking metrics involve the edge emissions. Most commonly, edge emissions are evaluated in terms of their ratio to the total incident photons (external efficiency) or to the absorbed photon flux (internal efficiency). In LSC-PM applications, as the absorber lies within the waveguide, the emission of photons out the device edges is not desired, as, if not reflected back into the device, it constitutes a loss mechanism. Still, we could measure the edge emission of an LSC-PM to compare experimental results and simulations. As the edge-emitted photons are characterized by a longer photon path within the device than the reflected and transmitted components, they constitute a real litmus test for our Monte Carlo model. Longer photon paths indeed correspond to a deeper position in the stochastic tree of the simulation, where the influence of appropriate handling of reabsorption and reemission events becomes proportionally more important over other confounding physical phenomena (like scattering).We were thus quite satisfied with the very good agreement between measured edge emissions and simulated results, not just as a function of different device dye loadings but also with different photocatalyst concentrations of the reaction mixture present in the channels (Fig. 4). The decrease in the edge emission experienced in this latter case is showing a clear exponential trend as the photon absorption in the LSC-PM channels follows the Bouguer–Lambert–Beer law. Incidentally, the good fitting between the calculated and the measured decrease in the edge emissions observed here is also an indirect proof of the accuracy of the model predictions on the photons absorbed in the channels.
4. Device optimization
With a working model in our hands, we started analyzing the behavior of the 5 × 5 cm2 LSC-PM with 6 channels that we have reported earlier (Fig. 1A).3 A complete photon-balance for the 350–700 nm range for this model-case is reported in Fig. 5B and C. The largest fraction in the photon balance, 43% of the photons reaching the device, is constituted by the transmitted photons, i.e. the photons not absorbed by the luminophore leaving the device at the bottom surface. Although this limits the overall device efficiency, from the wavelength distribution graph, it can be concluded that most of the transmitted photons (gray area) are found in regions where the absorption of the luminophore is limited or absent (e.g. above 600 nm). This means that a further increase of the dye loading is not likely to improve the device performance significantly, as observed experimentally.3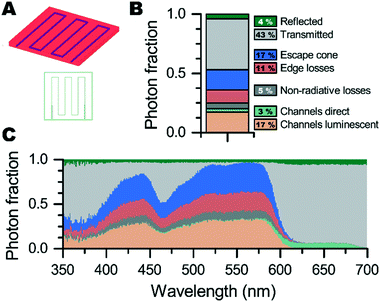 | ||
| Fig. 5 (A) The modeled 5 × 5 cm2 LSC-PM. (B and C) Relative contribution of the different photon fates to the overall photon balance (the original wavelength of the generated photons is considered). | ||
Given the limits of the chosen luminophore, the optimization of the device optical efficiency can only focus on improving the internal efficiency of the device, i.e. the number of photons reaching the reaction channels divided by the total photons absorbed by the device (eqn (1)).
 | (1) |
This can be obtained from the simulation results by dividing the sum of direct and luminescent irradiation to the channels by all the photons absorbed in the device (i.e. all but transmitted and reflected photons). For the 5 × 5 cm2 LSC-PM with 6 channels, the calculated internal efficiency is 38%.
4.1. Channel height
From the analysis of the luminescent photons, it is clear that a significant fraction is lightguided to the edges of the device without being absorbed in the channels. The edge losses, the second most significant loss mechanism, should be reduced to improve the device performance. For practical limitation, the channels in the PDMS matrix were designed to have a height of 1 mm over 3 mm of total device thickness. Since it was already found that the aspect ratio of the channels had an impact on the ability of the channels to efficiently capture the lightguided photons, we anticipated that channels spanning the whole device thickness could decrease the edge losses even further. Indeed, the simulation results for such an optimized reactor showed an increase in the internal efficiency to 55%, with edge losses decreased from 11 to 5% (Fig. 6).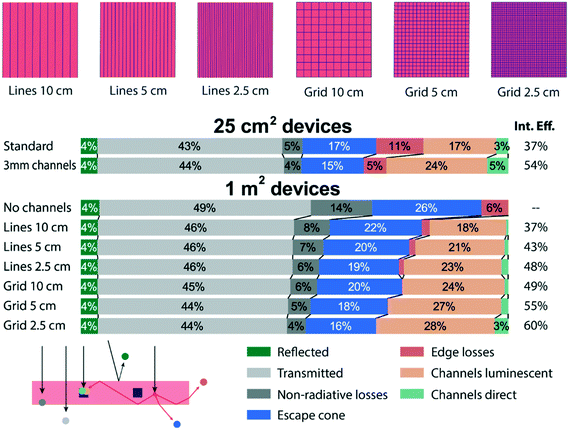 | ||
| Fig. 6 Photon balances for the modeled reactors. Even when scaled-up, the LSC-PM's internal efficiency is comparable or even higher than that on the small scale. | ||
4.2. Channel pattern
A significant difference of LSC-PM over LSC is expected to be seen on scaled-up devices,15 therefore, we decided to simulate a 1 square meter device. Over such a large area, the edge loss fraction of LSC-PM is expected to decrease, with a corresponding increase in the device internal efficiency. In particular, 6 designs were tested having spacing between channels varying from 2.5 to 10 cm and disposed in a one or two-direction fashion (see Fig. 6). The channels were designed to be half a millimeter wide to afford uniform irradiation to the reaction mixture and as tall as the device thickness, since this was shown to be favorable in the previous comparison.From the simulation results (Fig. 6), the advantage of the grid-design as a more efficient photon collector is clear. In particular, the internal efficiency of the “grid 10 cm” design is superior to the “lines 5 cm” characterized by the same reactor volume, and comparable with the “lines 2.5 cm”. The internal efficiencies of the different designs span between 36 and 60%, proving that the performance of the device is consistent or improved on large-scale application.
4.3. Photon path length analysis
The LSC-PM can address the main limitation of LSCs, which is the limited efficiency of large-scale applications. Evidently, this is due to the shorter photon path required to reach the final absorber. The importance of the photon path length to the device efficiency is also proved by the influence of the difference device patterns (i.e. lines versus grid). Therefore, we rationalized that the ‘Average Photon Path Travelled in the Device’ (APPTD), which gives the average distance travelled by emitted photons that eventually reach either a channel or the edge, calculated from the simulation results could be directly used as metric to estimate the impact of the LSC-PM design choices on the device efficiency. See Table 1 for the APPTD of the reactors described in this work.| Reactor design | APPTD (cm) | Non-radiative losses | Escape cone losses |
|---|---|---|---|
| No channels | 26.7 | 14.4% | 25.5% |
| Lines 10 cm | 9.3 | 8.3% | 21.6% |
| Lines 5 cm | 5.6 | 7.2% | 20.1% |
| Lines 2.5 cm | 3.3 | 6.3% | 18.7% |
| Grid 10 cm | 5.6 | 6.2% | 19.9% |
| Grid 5 cm | 3.0 | 5.3% | 18.1% |
| Grid 2.5 cm | 1.6 | 4.4% | 16.4% |
In Table 1, the APPTD for the luminescent photons reaching either the edge of the device or the channels is reported for the different reactors previously described. There is a clear correlation between the increase in the path-length before the final absorption event and the increase in reabsorption losses, both as photons reemitted within the escape cone and as non-radiative losses due to background absorption or the non-unity quantum yield of the luminophore (0.95). In other words, the shorter the path required for light to travel before reaching a channel, the less the likelihood of light loss via non-emission events or redirection out either the top or bottom surfaces. Of course, increasing the channel density has practical limitations, and so a good balance between functionality and practicality of production needs to be reached, but for the first time we present the possibility of scaling up the sizes of LSC devices without compromising their capability of efficiently processing the captured light. This unique characteristic of LSC-PMs could make them the most efficient application of LSCs, especially on large area applications as highlighted by the simulation results in Fig. 6.
5. Conclusion
Based on the results of the simulations here described, we believe that LSC-PMs have the potential to become the most efficient application of LSCs to date. This higher efficiency derives from the shorter paths that the luminophore-emitted photons have to travel within the lightguide before being productively used. It has been shown how the reduction in the “Average Photon Path Travelled in the Device” (APPTD), a novel metric here introduced which can only be measured via ray tracing simulations, is directly correlated with the decrease in reabsorption losses. Furthermore, we believe that the studies reported here are crucial in the development of novel and more energy-efficient LSC-PMs. These reactors display great potential for the continuous-manufacturing of fine chemicals, such as pharmaceuticals, powered by solar energy.Acknowledgements
D. C. and T. N. would like to acknowledge the European Union for a Marie Curie ITN Grant (Photo4Future, grant number 641861). We also acknowledge the Dutch Science Foundation (NWO) for a VIDI grant for T. N. (SensPhotoFlow, grant number 14150).References
- M. G. Debije and P. P. C. Verbunt, Adv. Energy Mater., 2012, 2, 12 CrossRef CAS.
- M. G. Debije, Adv. Funct. Mater., 2010, 20, 1498 CrossRef CAS; M. G. Debije and V. A. Rajkumar, Sol. Energy, 2015, 122, 334 CrossRef; M. Kanellis, M. M. de Jong, L. Slooff and M. G. Debije, Renewable Energy, 2017, 103, 647 CrossRef.
- D. Cambié, F. Zhao, V. Hessel, M. G. Debije and T. Noël, Angew. Chem., Int. Ed., 2017, 56, 1050 CrossRef PubMed.
- H. D. Roth, Angew. Chem., Int. Ed. Engl., 1989, 28, 1193 CrossRef.
- M. Oelgemoller, Chem. Rev., 2016, 116, 9664 CrossRef CAS PubMed.
- P. T. Anastas and J. C. Warner, Green Chemistry: Theory and Practice, Oxford University Press, New York, 1998 RSC; A. Albini and M. Fagnoni, Green Chem., 2004, 6, 1 RSC; D. Ravelli, S. Protti, M. Fagnoni and A. Albini, Curr. Org. Chem., 2013, 17, 2366 CrossRef CAS.
- D. M. Schultz and T. P. Yoon, Science, 2014, 343, 1239176 CrossRef PubMed.
- A. M. Nauth, A. Lipp, B. Lipp and T. Opatz, Eur. J. Org. Chem., 2017, 2099 CrossRef CAS; D. Dondi, S. Protti, A. Albini, S. M. Carpio and M. Fagnoni, Green Chem., 2009, 11, 1653 RSC; B. Pohlmann, H. D. Scharf, U. Jarolimek and P. Mauermann, Sol. Energy, 1997, 61, 159 CrossRef; C. Covell, A. Gilbert and C. Richter, J. Chem. Res., 1998, 316 RSC; D. Cambié, C. Bottecchia, N. J. W. Straathof, V. Hessel and T. Noël, Chem. Rev., 2016, 116, 10276 CrossRef PubMed; T. Noël, Photochemical Processes in Continuous-Flow Reactors, World Scientific, 2017 Search PubMed.
- Y. Su, K. Kuijpers, N. Koenig, M. Shang, V. Hessel and T. Noël, Chem. – Eur. J., 2016, 22, 12295 CrossRef CAS PubMed.
- T. J. J. Meyer, J. Hlavaty, L. Smith, E. R. Freniere and T. Markvart, Proc. SPIE, 2009, 7211, 72110N CrossRef.
- A. Burgers, L. Slooff, R. Kinderman and J. Van Roosmalen, Modelling of luminescent concentrators by ray-tracing, presented at Presented at the 20th European Photovoltaic Solar Energy Conference and Exhibition, 2005 CrossRef CAS; S. J. Gallagher, P. C. Eames and B. Norton, Int. J. Ambient Energy, 2004, 25, 47 CrossRef CAS; W. R. L. Thomas, J. M. Drake and M. L. Lesiecki, Appl. Opt., 1983, 22, 3440 CrossRef PubMed.
- R. W. Olson, R. F. Loring and M. D. Fayer, Appl. Opt., 1981, 20, 2934 CrossRef CAS PubMed; K. Heidler, A. Goetzberger and V. Wittwer, in Fourth E.C. Photovoltaic Solar Energy Conference, Springer, Netherlands, 1982, pp. 682–686 CrossRef PubMed; J. Sansregret, J. M. Drake, W. R. L. Thomas and M. L. Lesiecki, Appl. Opt., 1983, 22, 573 CrossRef PubMed.
- B. S. Richards and K. R. McIntosh, Progr. Photovolt.: Res. Appl., 2007, 15, 27 CrossRef CAS; A. Schüler, A. Kostro, C. Galande, M. V. Del Olmo, E. de Chambrier and B. Huriet, Principles of Monte-Carlo ray-tracing simulations of quantum dot solar concentrators, presented at Proceedings of ISES World Congress 2007, 2008, vol. I–V CrossRef; A. Kerrouche, D. A. Hardy, D. Ross and B. S. Richards, Sol. Energy Mater. Sol. Cells, 2014, 122, 99 CrossRef; R. Bose, D. J. Farrell, A. J. Chatten, M. Pravettoni, A. Buechtemann, J. Quilitz, A. Fiore, L. Manna and K. W. J. Barnham, Conf. Rec. IEEE Photovoltaic Spec. Conf., 2008, 24–28 Search PubMed; W. G. J. H. M. v. Sark, K. W. J. Barnham, L. H. Slooff, A. J. Chatten, A. Büchtemann, A. Meyer, S. J. McCormack, R. Koole, D. J. Farrell, R. Bose, E. E. Bende, A. R. Burgers, T. Budel, J. Quilitz, M. Kennedy, T. Meyer, C. D. M. Donegá, A. Meijerink and D. Vanmaekelbergh, Opt. Express, 2008, 16, 21773 CrossRef PubMed; M. Kennedy, A. Chatten, D. Farrell, R. Bose, A. Büchtemann, S. McCormack, J. Doran, B. Norton and K. Barnham, in 23rd European Photovoltaic Solar Energy Conference and Exhibition, Valencia, Spain, 2008 Search PubMed.
- D. J. Farrell, PhD Thesis, Department of Physics, Imperial College London, 2009 Search PubMed.
- F. Zhao, D. Cambié, J. Janse, E. W. Wieland, K. P. L. Kuijpers, V. Hessel, M. G. Debije and T. Noël, 2017, submitted for publication.
Footnote |
| † Electronic supplementary information (ESI) available: ESI is available from the Royal Society of Chemistry or from the authors. See DOI: 10.1039/c7re00077d |
| This journal is © The Royal Society of Chemistry 2017 |

