Assessing the reliability of computing ion pair lifetimes and self-diffusivity to predict experimental viscosity trends of ionic liquids†
Michael T.
Humbert
 ,
Yong
Zhang
and
Edward J.
Maginn
 *
*
Department of Chemical and Biomolecular Engineering, University of Notre Dame, Notre Dame, Indiana 46556, USA. E-mail: ed@nd.edu
First published on 23rd June 2017
Abstract
Self-diffusivities and ion pair lifetimes were calculated for 24 ionic liquids at 400 K. These values were then compared with the experimental viscosities of the ionic liquid at 298 K. Experimental viscosities were found to have a strong correlation with both the ion pair lifetime and the inverse diffusivity. For both properties, the ionic liquids were divided into two groups based on the nature of the anion. It was found that both the ion pair lifetime and the self-diffusivity can be used to predict the ionic liquids with a viscosity lower than a given threshold with an 80% success rate. This predictive capability would allow for rapid screening of ionic liquids to determine those with low viscosities.
Design, System, ApplicationIonic liquids are useful in a variety of applications from batteries to CO2 separation but are hindered by high viscosities. One common technique is to use computer simulations to predict the properties of a system of ionic liquids before they are synthesized. Since viscosity is a computationally expensive property to calculate, easier to calculate properties are used to rule out the high viscosity ionic liquids, reducing the overall computational expense. This method makes high-throughput screening of ionic liquids feasible, allowing for increased exploration of the design space of ionic liquids with multiple industrial applications. |
1 Introduction
Due to a wide variety of desirable properties such as low vapor pressures and large liquid phase range, ionic liquids (ILs) have been studied for a broad range of practical applications, from solvents to CO2 capture.1–5 One drawback of ILs is that they are usually much more viscous than other alternatives. This has led to many studies trying to predict viscosities of ILs and determine ways of minimizing their viscosities.One method that is commonly used to predict (or at least correlate) the viscosity of ILs is quantitative structure–property relationship (QSPR) modeling.6–8 QSPR correlates easy to obtain descriptors for ILs with experimental data to obtain relationships that can be used to predict desired properties for molecules similar to the training set. A major drawback is that it requires extensive experimental data and does not extend well to compounds significantly different from the training set. This lack of predictive capability makes it difficult to use this tool for screening purposes and thus other methods are needed.
One such predictive method is molecular dynamics (MD) simulations. Not only can MD be used to calculate the viscosity of a system, it can also provide molecular insight as to why viscosities are high or low. The most common method for calculating viscosity from equilibrium MD utilizes the Green–Kubo relation9
 | (1) |
![[thin space (1/6-em)]](https://www.rsc.org/images/entities/char_2009.gif) 000 CPU hours for a single viscosity calculation. This cost severely limits the number of molecules that can be tested. Thus for a high throughput screening calculation, it would be beneficial to have an easy to calculate property that could be used in place of a direct viscosity calculation.
000 CPU hours for a single viscosity calculation. This cost severely limits the number of molecules that can be tested. Thus for a high throughput screening calculation, it would be beneficial to have an easy to calculate property that could be used in place of a direct viscosity calculation.
One possible predictor for viscosity is the ion pair lifetime of the system.11 This property is a measure of how long a given ion pair remains together. It has been shown that for various ILs there is a linear relationship between the computed ion pair lifetime and viscosity calculated using MD.12 If this relationship extends to the experimental viscosity, it would provide an easy way to predict trends in the viscosity of ILs.
The self-diffusivity of the molecules could also be used to predict the viscosity of an IL. The Stokes–Einstein equation predicts an inverse relationship between viscosity and diffusivity13
 | (2) |
While the Stokes–Einstein equation was derived for spheres of radius ri in a fluid with a viscosity η, it can still give an idea of the relationship between diffusivity and viscosity for ILs. Ion pair lifetimes and self-diffusivities can be calculated in a fraction of the time it takes to calculate the viscosity, and so these properties could be useful to calculate in a screening study of viscosity. The objective of this work is to determine if the ion pair lifetime and diffusivity can be used to determine low viscosity ILs in a rapid manner to enable high-throughput screening.
Tables 1 and 2 show the different ions studied in this work, as well as the abbreviations used. Experimental data used in this paper were taken from several sources14–28 as compiled by Paduszynski et al.29 Experimental data were selected to have low water content (<100 ppm) and were at a temperature of 298 K.
2 Methods
2.1 Molecular dynamics simulations
The LAMMPS package was used to perform all equilibrium MD simulations.30 Since the goal of this research is high-throughput screening, the General Amber Force Field (GAFF) was used to parameterize all interactions.31 No attempt was made to optimize the force field parameters to match the experimental data. To calculate the partial charges, the structure of each ion was optimized using the Gaussian 09 package at the B3LYP/6-311++g(d,p) level.32 Charges were then calculated using the RESP method for fitting the electrostatic potential surface.33 Finally, the charges were scaled by 0.8 to account for charge transfer and polarizability.34 Coulombic interactions were calculated using the particle–particle particle–mesh method35 with a cutoff of 12 Å. All simulations had a time step of 1 fs, with periodic boundary conditions in all directions. Initial configurations were created using the package Packmol, with 250 ion pairs.36,37 To equilibrate the density, the system was run for 2 ns in the isothermal–isobaric (NPT) ensemble at 400 K and 1 atm. For production runs, three trajectories were run with identical initial positions, but randomized velocities. Each trajectory was run for 20 ns, with the first 2 ns taken for equilibration. During the production runs, the positions were recorded every 1000 time steps for further analysis. The Nosé–Hoover thermostat38 and the extended Lagrangian approach39 were used to maintain constant temperature and pressure, respectively. Sample input and force field files are included in the ESI.†All simulations were run at a temperature of 400 K, unlike the experimental data which were collected at 298 K. This is a consequence of the inherently slow dynamics of ILs at room temperature. As described below, even simulations of 100 ns were too short to adequately compute ion pair lifetimes or self-diffusivities at 298 K. Thus, to keep with the objective of finding a fast and computationally efficient screening method, simulations were carried out at high temperature and the results were examined to see if they could predict viscosity trends at 298 K.
2.2 Ion pair lifetime
Ion pair lifetimes were computed using a previously reported procedure.12,40,41 An ion pair is defined as the closest anion around a central cation or vice versa. The function h(t) is defined as unity if a particular counterion is the closest counterion to a central ion. Otherwise, the function is zero. A correlation function can then be defined as | (3) |
From this, the ion pair lifetime is defined as
 | (4) |
The integral in eqn (4) was evaluated by fitting the correlation function to a multiple exponential function with up to six terms
| C(t) = ∑aie−t/bi | (5) |
2.3 Self-diffusivity
The self-diffusion coefficients for the ions were calculated from the mean-squared displacement (MSD) using the Einstein relation | (6) |
The self-diffusion coefficient was calculated for the cation and anion in each simulation. There is a large difference between the values for the cations and anions. Thus, the uncertainty for diffusivity was calculated separately for the cation and the anion. The overall uncertainty was taken as the maximum of these two values. The comparisons were performed on the average of these six different values.
3 Results and discussion
3.1 Ion pair lifetime
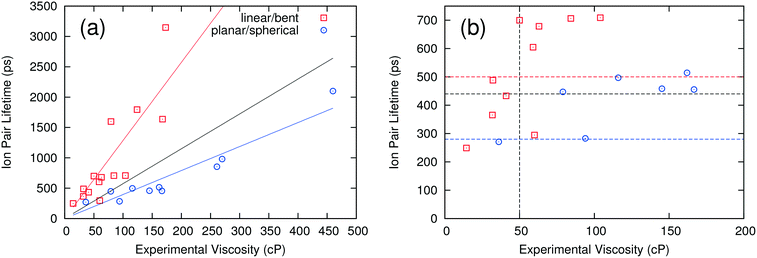
Fig. 1(a) compares the computed ion pair lifetimes for all of the ILs with their experimental viscosities. A linear regression to all the results shows that there is a weak correlation between the computed ion pair lifetime and experimental viscosity, with a coefficient of determination R2 of 0.116. Interestingly, the correlation becomes much better if the ILs are separated into two different groups: those having linear or “bent” anions and those having planar or spherical anions (see Table 2 for definitions). When these groups are considered separately, the R2 values increase to 0.707 and 0.903 for linear/bent and planar/spherical anions, respectively. While these two linear fits could be used to estimate the viscosity directly, what is really needed for a high-throughput screening method is a critical value of the ion pair lifetime that corresponds to a viscosity threshold. ILs above the viscosity threshold are rejected while those below the threshold are retained for further study. In this work, thresholds were chosen to correspond to ILs that have a viscosity of 50 cP or lower. By this definition, an IL would be correctly categorized if the experimental viscosity is below 50 cP and the ion pair lifetime is below the critical value, or if the experimental viscosity is above 50 cP and the ion pair lifetime is above the critical value. The critical ion pair lifetimes were chosen such that the percentage of ILs correctly categorized was maximized. This analysis was performed twice, once on all ILs at the same time and once for the two anion groups separately.When all ILs are analyzed concurrently, the resulting critical ion pair lifetime is 440 ps (black horizontal line in Fig. 1b). That is, ILs with ion pair lifetimes equal to or less than 440 ps should have a viscosity less than 50 cP. This analysis correctly categorizes 20 of the 24 ILs (an 83% success rate). Of the four ILs incorrectly categorized, two were false positives (i.e. their viscosities were incorrectly predicted to be below 50 cP) and two were false negatives (i.e. incorrectly predicted to have viscosities above 50 cP). If the two anion groups are analyzed separately, the success rate increases to 92%, or two ILs incorrectly categorized. One of the two incorrectly categorized ILs had a viscosity very close to the threshold of 50 cP and was a false negative. The other had a similar viscosity of 60 cP and was a false positive. The resulting critical ion pair lifetimes are 500 ps (red horizontal line) for linear and bent anions, and 280 ps (blue horizontal line) for planar and spherical anions. By using these critical ion pair lifetimes, ILs can be screened rapidly to determine those with a viscosity of less than 50 cP. While this approach is not 100% accurate, it does provide a mechanism for quickly analyzing ILs to determine those with a high probability of having a low viscosity. The critical ion pair lifetime can be adjusted up or down to make the screening more or less “conservative” in determining which ILs may have viable viscosities.
It is also possible to separate the ILs into groups based on the nature of the cation. Three such groups were investigated: aromatic ring cations, non-aromatic ring cations and quaternary phosphonium cations. Fig. 2a shows computed ion pair lifetime versus experimental viscosity for these three different groups. The ILs having non-aromatic ring cations have significantly larger ion pair lifetimes than those with aromatic ring cations, but no other clear pattern or trend is evident. Fig. 2b shows how the experimental viscosity correlates with the computed ion pair lifetime for ILs containing a common NTF2 anion paired with the three different types of cations. There is a single trend independent of the type of cation considered. This shows that, while the type of cation can have a large effect on the ion pair lifetime of the system, it also has a large effect on the viscosity. This suggests that, for the ILs examined in this study, the nature of the cation does not need to be considered when correlating ion pair lifetimes and viscosity; grouping ILs by the shape of the anion is sufficient to separate the low viscosity ILs from those with higher viscosities.
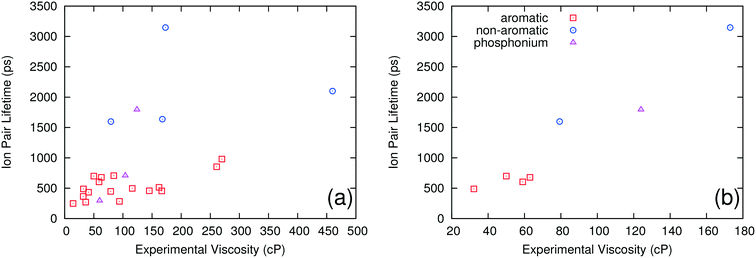 | ||
| Fig. 2 Ion pair lifetime vs. experimental viscosity of different ILs grouped by the type of cation for all ILs (a) and only the ILs with NTF2 as the anion (b). | ||
3.2 Self-diffusivity
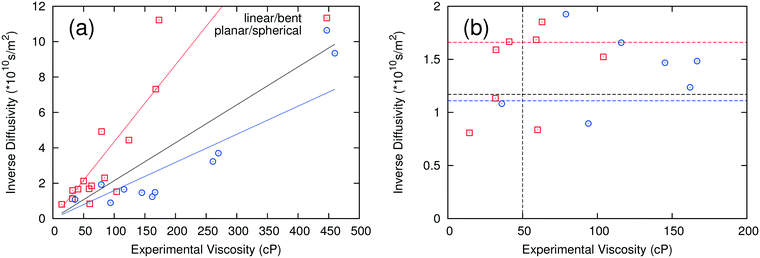
The self-diffusivity of molecules in a system is predicted to have an inverse relationship with the viscosity according to the Stokes–Einstein relationship. Thus, the inverse of the computed average self-diffusivity was plotted against the experimental viscosity in Fig. 3a. When all data are included in a linear regression, the coefficient of determination R2 is 0.326, which is higher than the corresponding R2 for the ion pair lifetime but is still rather low. When the fitting is performed on the anion groups defined previously, the R2 values improve to 0.696 and 0.803 for linear/bent and planar/spherical anions, respectively. Similar to the analysis used for ion pair lifetime, a critical self-diffusivity was used to discriminate between high and low viscosity ILs.When using only one critical self-diffusivity for the two groups, a critical self-diffusivity of 8.5 × 10⁻¹¹ m2 s−1 was found to have the best performance, with a success rate of 79%. This corresponds to the black dashed line at 1.17 × 10¹⁰ s m−2 in Fig. 3b. If two critical self-diffusivities are used for the two groups of anions, the success rate is increased to 83%. The critical values used were 6 × 10⁻¹¹ m2 s−1 (1.67 × 10¹⁰ s m−2) for the linear/bent anions (red line) and 9 × 10⁻¹¹ m2 s−1 (1.11 × 10¹⁰ s m−2) for the planar/spherical anions (blue line). While the R2 values for self-diffusivity are slightly lower than for those where the ion pair lifetime was used, self-diffusivity is more extendable to systems with only one component or systems with many components, which would have a large number of ways to define ion pair combinations.
System size has been shown to have an effect on the values of diffusivities calculated using MD simulations.42–46 Yeh and Hummer derived an equation for the correction of system size dependence, which is related to the viscosity and size of the system.45 Since the goal of the present work is to efficiently screen ILs for viscosity, the simple correction cannot be used in this analysis because it requires the viscosity as input. To test whether neglecting the system size correction skews the results, the viscosities of a subset of the ILs used in the study were extrapolated to 400 K using a Vogel–Fulcher–Tammann fitting provided in the experimental papers.14–28 These viscosities were used to compute self-diffusivities corrected for system size (see the ESI† for details). These system size corrections did not change the relative ordering of the viscosities, and thus were determined to be unnecessary for the analysis.
3.3 Convergence testing
One way to further optimize this procedure is to determine the minimum length of simulation required to return converged results. The ion pair lifetime and self-diffusivity were calculated for each IL using different lengths of simulation. These calculations were performed using the same simulations to maintain consistency in the calculation. Trajectories of a given length were obtained by skipping frames at the beginning of the trajectory until the desired simulation length was reached. All of the ILs show similar behavior, so only one example is presented. Fig. 4 shows how ion pair lifetimes and diffusivities evolve over different lengths of simulation. Both the average value and the uncertainty stabilize after 10 ns, meaning that one 10 ns simulation is long enough to provide accurate results. This work used three simulations in order to provide an estimate of the uncertainty, but the uncertainty is small enough that only one simulation would be needed to rank the ILs.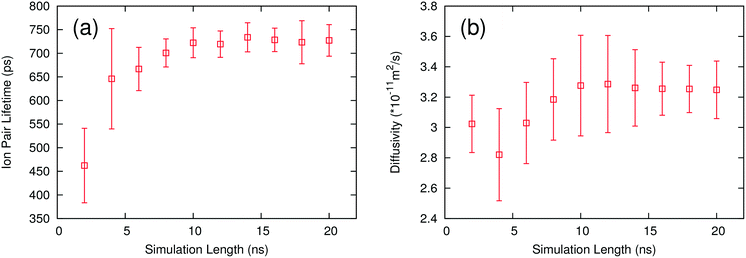 | ||
| Fig. 4 Plots of ion pair lifetime (a) and self-diffusivity (b) with different lengths of simulation for the ion pair [C4C1IM PF6]. | ||
3.4 Temperature effects
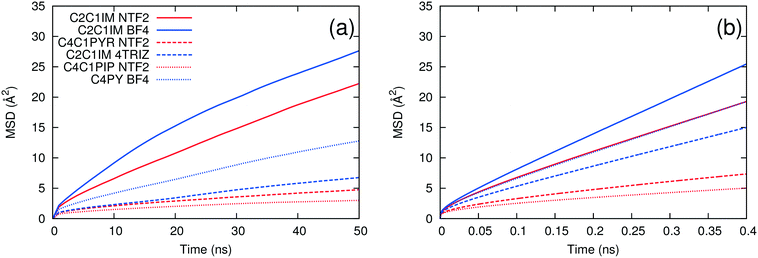
As noted above, the dynamics of ILs tend to be slow at low temperature. We carried out long simulations on a subset of ILs at 298 K and found that self-diffusivities and ion pair lifetimes could not be reliably computed even after 100 ns simulation time. At 400 K, the dynamics of the ILs are fast enough that reasonably short simulations are sufficient for computing these properties, consistent with the rapid screening objective of this work. To test whether the use of high temperature simulations reduces the predictive capability of the method, we compared the trends in the MSD at both 298 K and 400 K. As shown in Fig. 5, the ILs with the largest and smallest MSDs at 400 K also are the ones with the largest and smallest MSDs at 298 K. On the other hand, [C2C1IM][NTF2] has a larger MSD than [C4PY][BF4] at 298 K, but the two ILs have similar MSD trends at 400 K. This suggests that the effect of extrapolating the trends observed at high temperature to low temperature is generally reasonable but that some of the inaccuracies of the method could be due to this extrapolation.The second method of testing the temperature dependence of the trends observed was to calculate the ion pair lifetime and self-diffusivity for several ILs at an intermediate temperature where experimental data exist. Some of the data at 343 K were taken from sources different than those at 298 K.18,21,22,28,47Fig. 6 shows a comparison of experimental viscosities versus ion pair lifetimes and inverse self-diffusivities at 343 K. The separation between linear/bent and planar/spherical anions is still evident when comparing inverse diffusivities and ion pair lifetimes to experimental viscosities at the same temperature. Certainly it is desirable to run simulations at the same temperature as the experiments, but given the current computational limitations this is not yet feasible for a fast screening-type investigation of low temperature viscosities.
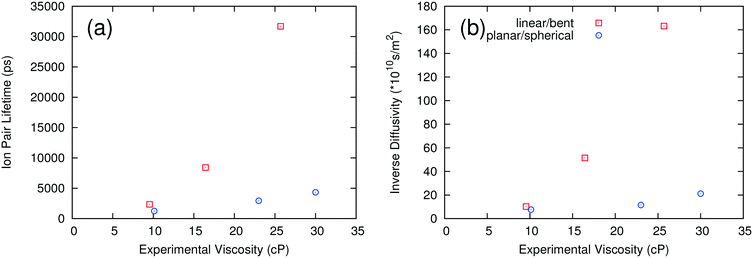 | ||
| Fig. 6 Ion pair lifetimes (a) and diffusivities (b) calculated at 343 K compared to experimental viscosities at 343 K for select ionic liquids. | ||
3.5 Accuracy of predictions
There are at least three possible reasons why roughly 20% of the ILs were improperly categorized by viscosity. The first is the temperature difference between the simulations and the experiments. Although many of the trends in IL dynamics at high temperature were unchanged at low temperature, different ion pairs will have different trends in viscosity as the temperature changes. As a result, performing calculations at temperatures higher than the experiments will never be able to perfectly predict experimental trends at room temperature. Unfortunately, simulations at higher temperatures were required due to the slow dynamics of the ILs at room temperature. A second possible source of error is related to the accuracy of the force fields used. While there are many force fields parameterized specifically for the ILs in this study, to maintain generality, GAFF was used in the present work. It could be that a different force field would have achieved higher accuracy for ion pair lifetimes and self-diffusivity, although even force fields specifically parameterized for ILs can have relatively large errors in dynamical properties. All of the ILs that were improperly classified were close to the threshold viscosity, making it very difficult to differentiate between them. One final source of error is the experimental measurements themselves. It is well known that experimental viscosities for the same IL can vary by 10% or more due to measurement error, impurities and other factors.48 While care was taken in selecting experimental sources that minimized these sources of error, there are still large ranges of reported values for viscosity of ionic liquids.4 Conclusion
We carried out simulations of 24 different ILs and found that two predictors were useful in discriminating between low and high viscosity ILs: ion pair lifetime and self-diffusivity. These surrogate properties can be used to successfully identify low viscosity ILs with at least an order of magnitude less computational cost compared to direct calculation of the viscosity from equilibrium MD. The approach was only successful when the ILs were grouped into two categories based on the nature of the anion (linear/bent or planar/spherical). The method is able to predict the ILs with viscosities less than 50 cP with an accuracy of roughly 80%. Simulations carried out at temperatures closer to the temperatures where experimental viscosities were measured should have an even higher accuracy, though at greatly increased computational cost. It will be useful to apply this method to a wider range of ILs to determine whether these simple predictors can be applied to other classes of ILs.Acknowledgements
This material is based upon work supported by the U.S. Department of Energy, Basic Energy Science, Joint Center for Energy Storage Research under contract no. DE-AC02- 06CH11357. Computational resources were provided by the National Energy Research Scientific Computing Center, which is supported by the Office of Science of the U.S. Department of Energy under contract no. DE-AC02-05CH11231, and the Center for Research Computing (CRC) at the University of Notre Dame.References
- N. V. Plechkova and K. R. Seddon, Chem. Soc. Rev., 2008, 37, 123–150 RSC.
- E. J. Maginn, J. Phys.: Condens. Matter, 2009, 21, 373101 CrossRef CAS PubMed.
- J. P. Hallet and T. Welton, Chem. Rev., 2011, 111, 3508–3576 CrossRef PubMed.
- K. Wendler, F. Dommert, Y. Y. Zhao, R. Berger, C. Holm and L. Delle Site, Faraday Discuss., 2012, 154, 111 RSC.
- H. Wang, G. Gurau and R. D. Rogers, Chem. Soc. Rev., 2012, 41, 1519 RSC.
- H. Matsuda, H. Yamamoto, K. Kurihara and K. Tochigi, Fluid Phase Equilib., 2007, 261, 434–443 CrossRef CAS.
- R. Bini, M. Malvaldi, W. R. Pitner and C. Chiappe, J. Phys. Org. Chem., 2008, 21, 622–629 CrossRef CAS.
- L. S. Ferreira and J. O. Trierweiler, IFAC Proceedings Volumes, 2009, vol. 7, pp. 405–410 Search PubMed.
- M. P. Allen and D. J. Tildesley, Computer Simulation of Liquids, Oxford University Press, Oxford, 1987 Search PubMed.
- Y. Zhang, A. Otani and E. J. Maginn, J. Chem. Theory Comput., 2015, 11, 3537–3546 CrossRef CAS PubMed.
- M. Kohagen, M. Brehm, Y. Lingscheid, R. Giernoth, J. Sangoro, F. Kremer, S. Naumov, C. Iacob, J. Kärger, R. Valiullin and B. Kirchner, J. Phys. Chem. B, 2011, 115, 15280–15288 CrossRef CAS PubMed.
- Y. Zhang and E. J. Maginn, J. Phys. Chem. Lett., 2015, 705, 700–705 CrossRef PubMed.
- A. Einstein, Ann. Phys., 1905, 322, 549–560 CrossRef.
- H. Tokuda, K. Hayamizu, K. Ishii, A. Bin, H. Susan and M. Watanabe, J. Phys. Chem. B, 2005, 109, 6103–6110 CrossRef CAS PubMed.
- W. Li, Z. Zhang, B. Han, S. Hu, Y. Xie and G. Yang, J. Phys. Chem. B, 2007, 111, 6452–6456 CrossRef CAS PubMed.
- P. J. Carvalho, T. Regueira, L. M. N. B. F. Santos, J. Fernandez and J. A. P. Coutinho, J. Chem. Eng. Data, 2010, 55, 645–652 CrossRef CAS.
- H. Tokuda, K. Hayamizu, K. Ishii, M. A. B. H. Susan and M. Watanabe, J. Phys. Chem. B, 2004, 108, 16593–16600 CrossRef CAS.
- C. Schreiner, S. Zugmann, R. Hartl and H. J. Gores, J. Chem. Eng. Data, 2010, 55, 1784–1788 CrossRef CAS.
- H. Rodríguez and J. Brennecke, J. Chem. Eng. Data, 2006, 51, 2145–2155 CrossRef.
- G. McHale, C. Hardacre, R. Ge, N. Doy, R. W. K. Allen, J. M. MacInnes, M. R. Bown and M. I. Newton, Anal. Chem., 2008, 80, 5806–5811 CrossRef CAS PubMed.
- F. M. Gaciño, T. Regueira, L. Lugo, M. J. P. Comuñas and J. Fernández, J. Chem. Eng. Data, 2011, 56, 4984–4999 CrossRef.
- J. M. Crosthwaite, M. J. Muldoon, J. K. Dixon, J. L. Anderson and J. F. Brennecke, J. Chem. Thermodyn., 2005, 37, 559–568 CrossRef CAS.
- N. D. Khupse and A. Kumar, J. Solution Chem., 2009, 38, 589–600 CrossRef CAS.
- H. Tokuda, K. Ishii, M. A. B. H. Susan, S. Tsuzuki, K. Hayamizu and M. Watanabe, J. Phys. Chem. B, 2006, 110, 2833–2839 CrossRef CAS PubMed.
- M. L. P. Le, F. Alloin, P. Strobel, J. C. Leprêtre, L. Cointeaux and C. P. del Valle, Ionics, 2012, 18, 817–827 CrossRef CAS.
- K. Tsunashima, S. Kodama, M. Sugiya and Y. Kunugi, Electrochim. Acta, 2010, 56, 762–766 CrossRef CAS.
- K. Tsunashima and M. Sugiya, Electrochem. Commun., 2007, 9, 2353–2358 CrossRef CAS.
- C. Shi, A. DeSilva, M. Guzman and J. F. Brennecke, ECS Trans., 2012, 50, 309 CrossRef.
- K. Paduszynski and U. Domanska, J. Chem. Inf. Model., 2014, 54, 1311–1324 CrossRef CAS PubMed.
- S. Plimpton, J. Comput. Phys., 1995, 117, 1–19 CrossRef CAS.
- J. M. Wang, R. M. Wolf, J. W. Caldwell, P. A. Kollman and D. A. Case, J. Comput. Chem., 2004, 25, 1157–1174 CrossRef CAS PubMed.
- M. J. Frisch, G. W. Trucks, H. B. Schlegel, G. E. Scuseria, M. A. Robb, J. R. Cheeseman, G. Scalmani, V. Barone, B. Mennucci, G. A. Petersson, H. Nakatsuji, M. Caricato, X. Li, H. P. Hratchian, A. F. Izmaylov, J. Bloino, G. Zheng, J. L. Sonnenberg, M. Hada, M. Ehara, K. Toyota, R. Fukuda, J. Hasegawa, M. Ishida, T. Nakajima, Y. Honda, O. Kitao, H. Nakai, T. Vreven, J. A. Montgomery Jr., J. E. Peralta, F. Ogliaro, M. Bearpark, J. J. Heyd, E. Brothers, K. N. Kudin, V. N. Staroverov, R. Kobayashi, J. Normand, K. Raghavachari, A. Rendell, J. C. Burant, S. S. Iyengar, J. Tomasi, M. Cossi, N. Rega, J. M. Millam, M. Klene, J. E. Knox, J. B. Cross, V. Bakken, C. Adamo, J. Jaramillo, R. Gomperts, R. E. Stratmann, O. Yazyev, A. J. Austin, R. Cammi, C. Pomelli, J. W. Ochterski, R. L. Martin, K. Morokuma, V. G. Zakrzewski, G. A. Voth, P. Salvador, J. J. Dannenberg, S. Dapprich, A. D. Daniels, O. Farkas, J. B. Foresman, J. V. Ortiz, J. Cioslowski and D. J. Fox, Gaussian09 Revision A.1 Search PubMed.
- C. I. Bayly, P. Cieplak, W. D. Cornell and P. A. Kollman, J. Phys. Chem., 1993, 97, 10269–10280 CrossRef CAS.
- Y. Zhang and E. J. Maginn, J. Phys. Chem. B, 2012, 116, 10036–10048 CrossRef CAS PubMed.
- H. W. Hockney and J. W. Eastwood, Computer Simulation Using Particles, Adam Hilger, Philadelpha, PA, 1989 Search PubMed.
- J. M. Martínez and L. Martínez, J. Comput. Chem., 2003, 24, 819–825 CrossRef PubMed.
- L. Martinez, R. Andrade, E. G. Birgin and J. M. Martinez, J. Comput. Chem., 2009, 30, 2157–2164 CrossRef CAS PubMed.
- W. G. Hoover, Phys. Rev. A: At., Mol., Opt. Phys., 1985, 31, 1695–1697 CrossRef.
- W. Shinoda, M. Shiga and M. Mikami, Phys. Rev. B: Condens. Matter Mater. Phys., 2004, 69, 16–18 CrossRef.
- W. Zhao, F. Leroy, B. Heggen, S. Zahn, B. Kirchner, S. Balasubramanian and F. Muller-Plathe, J. Am. Chem. Soc., 2009, 131, 15825–15833 CrossRef CAS PubMed.
- M. Kohagen, M. Brehm, J. Thar, W. Zhao, F. Müller-Plathe and B. Kirchner, J. Phys. Chem. B, 2011, 115, 693–702 CrossRef CAS PubMed.
- O. A. Moultos, Y. Zhang, I. N. Tsimpanogiannis, I. G. Economou and E. J. Maginn, J. Chem. Phys., 2016, 145, 074109 CrossRef PubMed.
- B. Dunweg and K. Kremer, J. Chem. Phys., 1993, 99, 6983 CrossRef.
- M. Fushiki, Phys. Rev. E: Stat., Nonlinear, Soft Matter Phys., 2003, 68, 021203 CrossRef CAS PubMed.
- I.-C. Yeh and G. Hummer, J. Phys. Chem. B, 2004, 108, 15873–15879 CrossRef CAS.
- G. Guevara-Carrion, J. Vrabec and H. Hasse, J. Chem. Phys., 2011, 134, 074508 CrossRef PubMed.
- A. Bhattacharjee, P. J. Carvalho and J. A. P. Coutinho, Fluid Phase Equilib., 2014, 375, 80–88 CrossRef CAS.
- R. D. Chirico, V. Diky, J. W. Magee, M. Frenkel and K. N. Marsh, Pure Appl. Chem., 2009, 81, 781–790 CrossRef.
Footnote |
| † Electronic supplementary information (ESI) available. See DOI: 10.1039/c7me00015d |
| This journal is © The Royal Society of Chemistry 2017 |


