DOI:
10.1039/C6RA06389F
(Paper)
RSC Adv., 2016,
6, 65808-65815
The antioxidative effects of three lactobacilli on high-fat diet induced obese mice
Received
10th March 2016
, Accepted 11th June 2016
First published on 22nd June 2016
Abstract
In this paper, three Lactobacillus strains (L. coryniformis subsp. torquens T3, L. paracasei subsp. paracasei M5 and L. paracasei subsp. paracasei X12) isolated in our laboratory were investigated for antioxidant activity in vitro and in vivo. Hydroxyl and 2,2-diphenyl-1-picrylhydrazyl (DPPH) free radical scavenging activities and reducing power were examined in vitro. Three Lactobacillus strains were administered to high-fat diet induced obese mice. The results indicated that T3 and M5 showed the highest hydroxyl radical and DPPH scavenging activities at a dose of 109 CFU mL−1, with inhibition rates of 40.33, 41.11% and 40.76, 44.31%, respectively. The reducing activities of these two strains were also significantly higher than those of X12. Compared with the high-fat diet group, M5 and T3 have effectively controlled body weight and hepatomegaly and significantly decreased blood triglyceride and total cholesterol levels (p < 0.05). Besides, M5 and T3 obviously improved the antioxidative indexes including MDA levels, T-SOD, GSH-Px, CAT and T-AOC activities. Overall, M5 and T3 have a strong antioxidant activity in vitro and can improve oxidative damage and control body weight in mice, suggesting that they may be potential anti-obesity and antioxidant probiotics.
1. Introduction
Reactive oxygen species (ROS) is a general term for peroxides, such as superoxide anions, hydroxyl radicals, hydrogen peroxide and NO free radicals, which are produced during cellular metabolism.1 In vivo, the redox state is adjusted by expression and regulation of an oxidant and antioxidant enzyme.2 When suffering various harmful stimuli (such as a long-term high-fat diet), the body produces too much ROS and the antioxidant capacity decreases, which causes an increase in reactive oxygen and cellular oxidative damage in the body.3,4 Oxidative stress is defined as an imbalance between the production of oxygen-free radicals and their elimination by protective mechanisms.5 The level of oxidative stress may be the most important mediator to trigger low-grade inflammation in obesity, diabetes, and hypertension.6,7
Obesity has emerged since the late 1990s with a stable and increasing tendency and has affected millions of individuals around the world.8 High-fat diets and sedentary lifestyles have dramatically increased the incidence of obesity and associated disorders (dyslipidaemia, insulin resistance, diabetes, and hepatic steatosis), stressing the need for therapeutic and preventive measures.9 Numerous studies have demonstrated that obesity is generally considered chronic low-grade systemic inflammation and involves antioxidant injury.7,10–13 In this regard, recent research has revealed that obesity combined with weakening the body's defense is sufficient for the development of liver disease.9 In obese patients, the oxidative stress level was significantly higher and the plasma malondialdehyde (malonaldehyde, MDA) content that reacted during lipid peroxidation significantly increased; at the same time the GSH-Px and SOD activity decreased.14,15 A variety of programs and treatments including drug therapeutics, surgical intervention and dietary control for obesity management or prevention have been developed; however, these are often associated with safety issues. Therefore, the development of a safe and effective dietary supplement to assist with body weight management is essential.
Probiotics are live microorganisms that benefit the health of the host when ingested in adequate amounts.16 These benefits include antimicrobial, anticancer, antioxidant, and anti-allergy effects, reduction of blood lipids, enhancement of immune function, and are strain dependent. Lactobacilli and bifidobacteria are the most widely used probiotic species.17,18 Lactic acid bacteria (LAB) are Gram-positive bacteria, widely distributed in nature. Lately, some LAB strains have been found in other important biological functions, such as anti-ageing and antioxidant activities.19,20 Lactobacillus rhamnosus GG was found to inhibit lipid peroxidation in vitro due to iron chelation and a superoxide anion scavenging ability.21 Lactobacillus plantarum 7FM10 isolated from the traditional Japanese food narezushi exhibited DPPH and superoxide radical scavenging capacities.22
From the viewpoint of the above background, in this study, we firstly investigate the potential antioxidant activity of 3 Lactobacillus strains for their in vitro scavenging activity against hydroxyl and DPPH free radicals, and for their reducing power. To further confirm their antioxidant capability, these strains were administrated to high fat diet induced obese mice. We evaluated the effect of the probiotics on high fat diet-induced obesity, serum triglycerides (TG), total cholesterol (TC) and antioxidant enzyme activities of the liver.
2. Materials and methods
2.1 Bacterial strains
The three Lactobacillus strains used in this study, including L. paracasei subsp. paracasei M5 (M5), L. paracasei subsp. paracasei X12 (X12) and L. coryniformis subsp. torquens T3 (T3), were isolated from kumiss made by local households in Sinkiang, traditional cheese from northwestern China and traditional yaks' milk cheese from Lhasa, respectively. These strains were maintained as frozen (−80 °C) stocks in MRS broth supplemented with 20% (v/v) glycerol. They were transferred at least three times consecutively using a 2% (v/v) inoculum in MRS broth at 37 °C for 18 h before use.
2.2 In vitro determination of antioxidant activity of Lactobacillus strains
2.2.1 Preparation of cells and intracellular cell-free extracts. The three lactobacilli were grown in MRS broth at 37 °C for 18 h. The bacterial cells were harvested by centrifugation (10![[thin space (1/6-em)]](https://www.rsc.org/images/entities/char_2009.gif) 000g, 15 min, 4 °C), washed three times with 0.01 M PBS (pH 7.2) and resuspended in PBS. The bacterial counts in the cell were adjusted to 108 and 109 CFU mL−1. The intracellular cell-free extracts were prepared according to the method of Lin and Yen23 with minor modifications. The cells (108 or 109 CFU mL−1) were broken at 300 W for 10 minutes by sonication which was performed with five 1 min intervals in an ice bath (JY92-IIN, SCIENTZ Biotechnology CO,. LTD, Ningbo, China). After removing the cell debris by centrifugation (10000g, 10 min, 4 °C), the resulting supernatant was obtained as the intracellular cell-free extract of the Lactobacillus strains.
000g, 15 min, 4 °C), washed three times with 0.01 M PBS (pH 7.2) and resuspended in PBS. The bacterial counts in the cell were adjusted to 108 and 109 CFU mL−1. The intracellular cell-free extracts were prepared according to the method of Lin and Yen23 with minor modifications. The cells (108 or 109 CFU mL−1) were broken at 300 W for 10 minutes by sonication which was performed with five 1 min intervals in an ice bath (JY92-IIN, SCIENTZ Biotechnology CO,. LTD, Ningbo, China). After removing the cell debris by centrifugation (10000g, 10 min, 4 °C), the resulting supernatant was obtained as the intracellular cell-free extract of the Lactobacillus strains.
2.2.2 Scavenging of DPPH free radicals. The DPPH radical-scavenging capacity of Lactobacillus was determined according to the method described by Huang with some modifications.24 Briefly, 1.0 mL of the Lactobacillus intracellular cell-free extracts with 108 or 109 CFU mL−1 was added to a 1.0 mL ethanolic DPPH radical solution (0.1 mM). Ascorbic acid with a concentration of 12 μg mL−1 was used as a positive control. The mixture was mixed vigorously and incubated at room temperature in the dark for 30 min. DPPH solution with deionized water was used as a control. The cell-free extracts dispersed in ethanol were used as a blank. The absorbance of the resulting solution was measured in triplicate at 517 nm after centrifugation at 8000g for 10 min. The scavenging ability was defined as:
2.2.3 Scavenging of hydroxyl radicals. The hydroxyl radical scavenging assay was conducted using the Fenton reaction method.25 Briefly, a reaction mixture containing 1.0 mL of pH 7.4 PBS (0.05 mol L−1) and 0.5 mL of phenanthroline (6 mM) was mixed and then 0.5 mL of FeSO4 (6 mM) was added. An amount of 0.5 mL of H2O2 (0.1%, w/v) and 0.5 mL of the intracellular cell-free extract in different concentrations was added subsequently and incubated at 37 °C for 1 h, and the absorbance was measured at 536 nm. Ascorbic acid with a concentration of 150 μg mL−1 was used as a positive control. The absorbance changes of the reaction mixture indicated the scavenging ability of the Lactobacillus strains for the hydroxyl radicals. Hydroxyl radical scavenging activity is expressed as:
where As is the absorbance in the presence of the sample, A0 is the absorbance of the control in the absence of the sample, and A is the absorbance without the sample and H2O2.
2.2.4 Reducing power. The reducing power was measured according to Ng and Wang.26 Briefly, 1 mL of the Lactobacillus free-cell extracts was mixed well with phosphate buffer (0.2 M, pH 6.6, 0.5 mL) and potassium hexacyanoferrate solution (1% v/w, 0.5 mL) and then heated at 50 °C for 20 min. After cooling down to room temperature, 0.5 mL of 10% trichloroacetic acid was added. After centrifugation at 5000g for 10 min, an aliquot of 1 mL of the supernatant was mixed with 1 mL of distilled water and 0.5 mL of ferric chloride (0.1%), then the reaction was stood for 10 min. The absorbance of the reaction mixtures was measured at 700 nm. Ascorbic acid with a concentration of 0.03 mmol L−1 was used as a positive control. Increased absorbance indicates a higher reducing power.
2.3 In vivo assessment of antioxidant effects of Lactobacillus on high-fat-diet induced oxidative stress in mice
2.3.1 Preparation of Lactobacillus. Lactobacilli (M5, T3, X12) were transferred at least three times consecutively using a 2% (v/v) inoculum in MRS broth at 37 °C for 18 h before use. The cells were harvested by centrifugation at 8000g for 15 min, washed three times with fresh normal saline and then adjusted to 108 or 109 CFU mL−1.
2.3.2 Animals. Five week-old male BALB/c mice weighing 20 ± 2 g were obtained from the Animal Experimental Center of The 2nd Affiliated Hospital of Harbin Medical University (Harbin, Heilongjiang, China). The certification number was SCXK-(HEI) 2013-001. All of the animal experimental procedures followed the National Institutes of Health guidelines for the care and use of laboratory animals, and were evaluated and approved by local ethics committee of The 2nd Affiliated Hospital of Harbin Medical University. In order to induce oxidative stress, Balb/c mice received a high fat diet (HFD, protein with 20% kcal, carbohydrate with 35% kcal, fat with 45% kcal). The normal control group received a normal control diet (CD, protein with 20% kcal, carbohydrate with 70% kcal, fat with 10% kcal). The mice were separated into 8 groups with 10 individuals for each including CD, HFD, HFD + M5 (108 CFU mL−1), HFD + M5 (109 CFU mL−1), HFD + T3 (108 CFU mL−1), HFD + T3 (109 CFU mL−1), HFD + X12 (108 CFU mL−1) and HFD + X12 (109 CFU mL−1). The HFD-Lactobacillus (M5, T3, or X12) group was fed with an HFD diet for 6 weeks and simultaneously treated with Lactobacillus (M5, T3, or X12) (respectively at 108 or 109 CFU per mouse per day), which was orally administrated. All animals were maintained in a room with a 12 h light/dark cycle at 22 ± 2 °C. The weight and food intake of the mice were measured every week. Blood, adipose and liver tissue were collected after 6 weeks of treatment for further analysis.
2.3.3 Determination of serum triglycerides and total cholesterol. The mice were sacrificed on day 42 and blood was collected. Serum was separated by centrifugation at 3000g for 5 min. Serum triglycerides (TG) and total cholesterol (TC) were determined using commercially available assay kits (Nanjing Jiancheng Bioengineering Institute, China).
2.3.4 Measurement of in vivo antioxidant capacity. Malondialdehyde (MDA) levels, glutathione peroxidase (GSH-Px) activities, total antioxidant capacity (T-AOC), catalase (CAT) and total superoxide dismutase (T-SOD) activities in the liver were all determined spectrophotometrically using commercially available assay kits (Nanjing Jiancheng Bioengineering Institute, China). Enzyme activity was expressed as U mgprot−1.
2.4 Statistical analysis
Tests were carried out in triplicate for all experiments. All data are presented as mean ± standard deviation (S.D). Statistical comparisons were made using the statistical software package SPSS 19.0. Significant differences between the treatments were tested by analysis of variance (ANOVA) with levels of significance of p < 0.05 and p < 0.01.
3. Results
3.1 DPPH radical scavenging activity
The DPPH scavenging rate was higher at a dose of 109 CFU mL−1 than at a dose of 108 CFU mL−1 for all of the Lactobacillus strains generally as is shown in Fig. 1. T3 and M5 possessed a significantly higher activity at the high dose compared with X12, however T3 showed a remarkable high scavenging effect at the low dose among all of the strains. Overall, T3 exhibited the most prominent scavenging activity, followed by M5 and X12 sequentially.
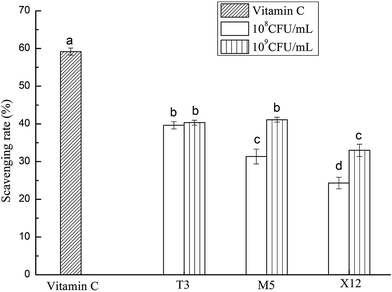 |
| | Fig. 1 Scavenging effect on the DPPH free radicals by different concentrations of the intracellular cell-free extracts of Lactobacillus incubated at 37 °C for 18 h. Each value is expressed as the mean ± S.D (n = 3). The different letters represent significant differences from each other, p < 0.05. | |
3.2 Scavenging activity on hydroxyl radicals
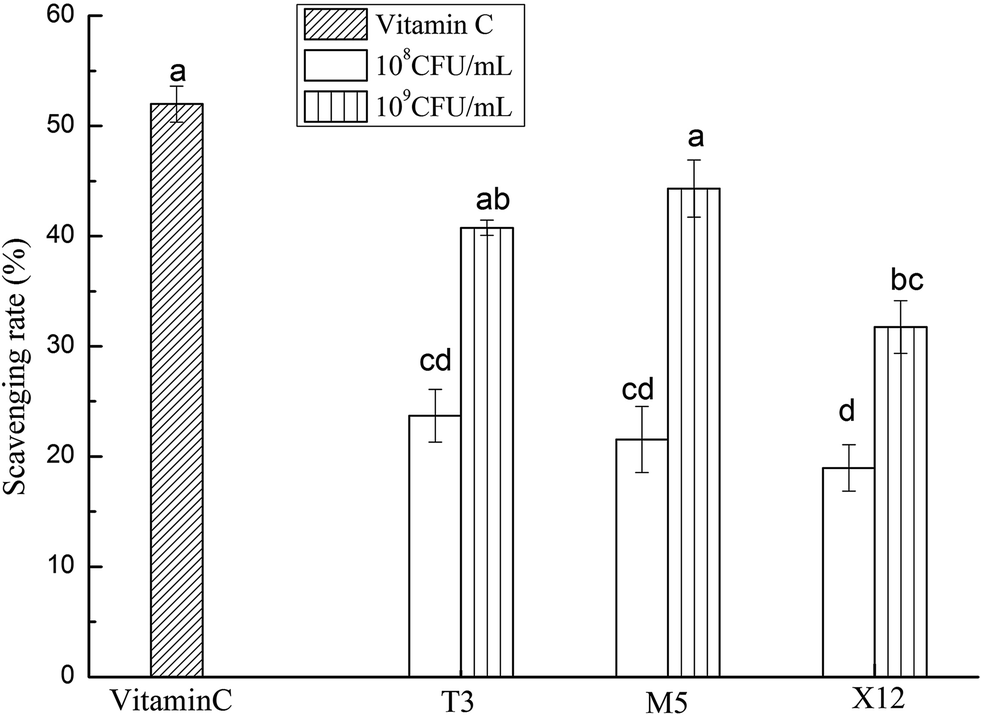
The scavenging activities on the hydroxyl radicals with the intracellular cell-free extracts of the three strains are shown in Fig. 2. All of the strains showed an increasing scavenging activity in a dose-dependent manner. M5 had a significantly higher scavenging ability with an inhibition rate of 41.33% at a dose of 109 CFU mL−1 (p < 0.05).
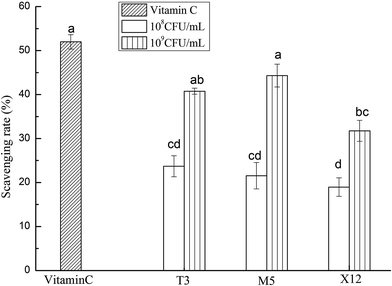 |
| | Fig. 2 Scavenging activities on the hydroxyl radicals using different concentrations of the intracellular cell-free extracts of Lactobacillus incubated at 37 °C for 18 h. Each value is expressed as the mean ± S.D (n = 3). The different letters represent significant differences from each other, p < 0.05. | |
3.3 Reducing power of intracellular cell-extracts
The reducing power of the intracellular cell-extracts ranged from 0.207 to 0.396 (OD700) as is shown in Fig. 3. The reducing power increased remarkably with the dose increment (p < 0.05). Compared to the other two lactobacilli, T3 showed the highest reducing power at a dose of 109 CFU mL−1 (p < 0.05), followed by M5 and X12 (Table 1).
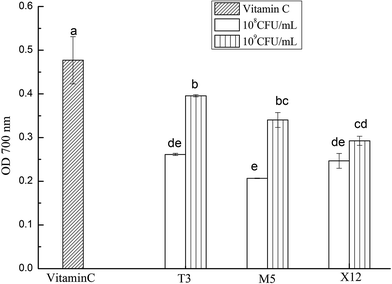 |
| | Fig. 3 Reducing powers of the different concentrations of intracellular cell-free extracts of Lactobacillus. The different letters represent significant differences from each other, p < 0.05. | |
Table 1 The Pearson correlation coefficient between time scale and body weighta
| Group |
Correlation coefficient |
| p = 0.01, significant correlation. |
| Normal control |
0.944 |
| HFD model |
0.976 |
| HFD + T3 (108 CFU mL−1) |
0.982 |
| HFD + T3 (109 CFU mL−1) |
0.969 |
| HFD + M5 (108 CFU mL−1) |
0.962 |
| HFD + M5 (109 CFU mL−1) |
0.968 |
| HFD + X12 (108 CFU mL−1) |
0.978 |
| HFD + X12 (109 CFU mL−1) |
0.976 |
3.4 Effect of Lactobacillus on body weight and organ index
During the 6 week study, body weight increased significantly in the mice of the HFD group compared with the CD + saline group as is shown in Fig. 4. Lactobacillus administration did not further increase the body weight of the mice consuming the HFD. The body weight of the M5 and T3 treated groups decreased effectively. The body weight of the HFD + M5 (109 CFU mL−1) group was the lowest on day 42 in the HFD-fed mice. Meanwhile, M5 and T3 also significantly decreased the adipose index and liver index of the mice consuming the HFD as is shown in Table 2.
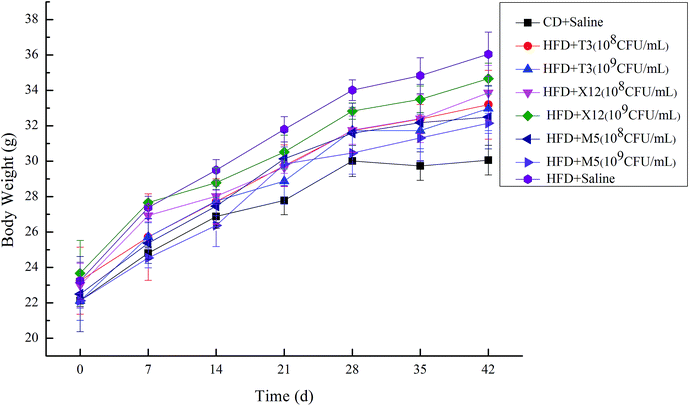 |
| | Fig. 4 Effect of M5, X12 and T3 on body weight. | |
Table 2 Effect of lactobacilli of M5, X12 and T3 on the adipose and liver indexa
| Group |
Adipose index (%) |
Liver index (%) |
| *p < 0.05 compared with the HFD model group. |
| Normal control |
1.97 ± 0.14 |
4.66 ± 0.44 |
| HFD model |
3.11 ± 0.24 |
5.62 ± 0.17 |
| HFD + T3 (108 CFU mL−1) |
2.63 ± 0.22* |
5.06 ± 0.47 |
| HFD + T3 (109 CFU mL−1) |
2.58 ± 0.32* |
5.09 ± 0.28 |
| HFD + M5 (108 CFU mL−1) |
2.47 ± 0.26* |
4.96 ± 0.18 |
| HFD + M5 (109 CFU mL−1) |
2.41 ± 0.24* |
4.71 ± 0.09* |
| HFD + X12 (108 CFU mL−1) |
3.09 ± 0.33 |
5.38 ± 0.30 |
| HFD + X12 (109 CFU mL−1) |
3.07 ± 0.16 |
5.44 ± 0.11 |
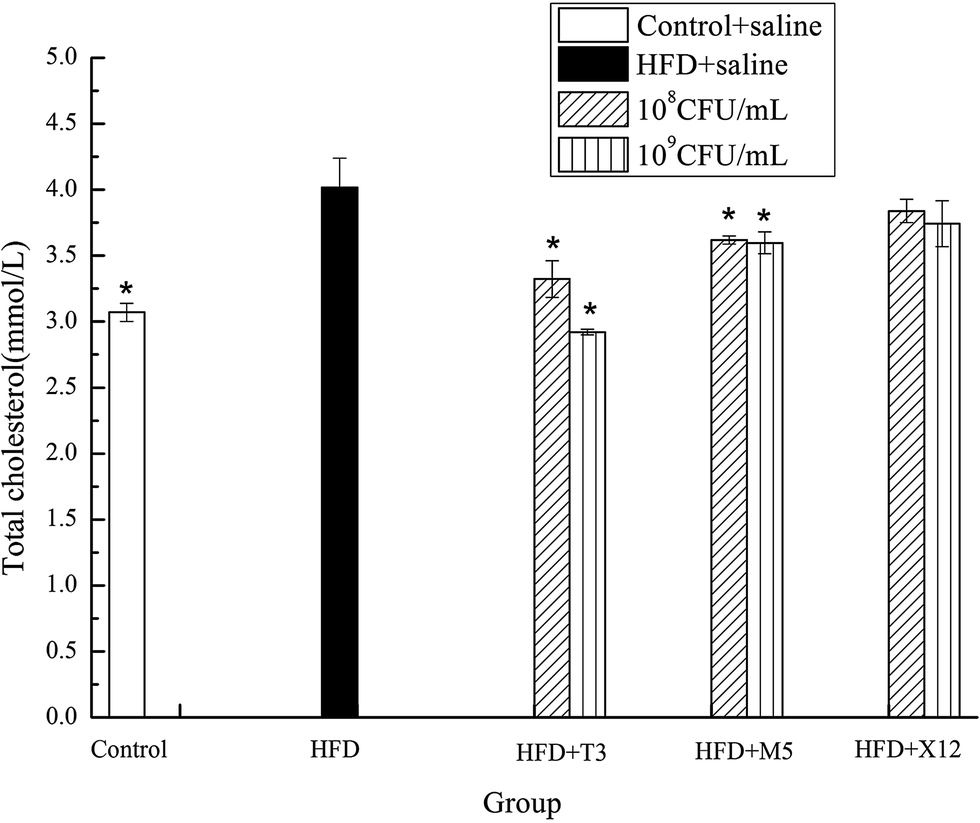
3.5 Total cholesterol and triglyceride concentrations in serum
The strains of T3 and M5 significantly reduced the triglyceride (TG) and total cholesterol (TCH) levels of the HFD induced obese mice (Fig. 5 and 6). Supplementation with M5 (108 and 109 CFU mL−1) and T3 (109 CFU mL−1) to the HFD-fed mice significantly decreased the concentration of TG (p < 0.05) compared with the HFD + saline group (Fig. 5). The administration of T3 and M5 at a high- and low-dose significantly decreased the total cholesterol level (p < 0.05) compared with the HFD + saline group, without reaching the values obtained in the control group (Fig. 6). Although the administration of X12 decreased the TG and TCH levels, there was no significant difference between the HFD + saline group and HFD + X12 group.
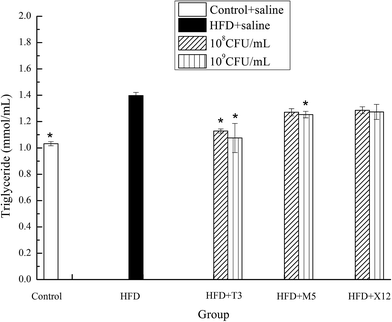 |
| | Fig. 5 Effects of Lactobacillus on triglyceride. The control represents normal diet-fed mice; HFD represents high-fat diet-fed mice; * represents significant differences compared with the HFD group, p < 0.05. | |
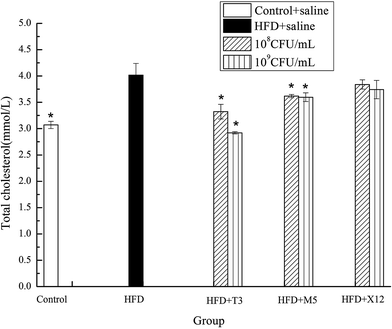 |
| | Fig. 6 Effects of Lactobacillus on total cholesterol. The control represents normal diet-fed mice; HFD represents high-fat diet-fed mice; * represents significant differences compared with the HFD group, p < 0.05. | |
3.6 Effect on antioxidant activity of HFD-induced obese mice
The effect of administration of the three Lactobacillus strains on the antioxidative status of the HFD induced obese mice is shown in Table 3. The MDA activities in the liver of the HFD model group mice increased significantly (p < 0.05) compared to the normal control group. Compared to the HFD model group, the MDA levels of the high-dose groups of T3 and M5 decreased significantly (p < 0.05) indicating that the two lactobacilli have successfully blocked lipid oxidation in the liver. The HFD induced obese mice experienced a severe decrease in GSH-Px activity, and the administration of T3 and M5 at a high dose and X12 attenuated the decrease of the antioxidative enzyme significantly, and further led to a subsequent recovery towards normality. Similarly, T3 and M5 were also able to increase the T-SOD activity in the liver compared to the HFD model (p < 0.05). The administration of T3 and M5 enhanced the T-AOC activities in a dose dependent manner when compared to the HFD model mice. It showed the highest level of T-AOC treated by M5 with a high dose (p < 0.01). It was found that T3 increased the CAT level significantly, however M5 and X12 didn't show a remarkable effect on CAT generation even at a high dose. Generally, T3 and M5 exhibited effective antioxidant activity on obese mice.
Table 3 Effect of M5, X12 and T3 on MDA level, GSH-Px and T-AOC and T-SOD activities in the liver of oxidative stress mice induced by high fat dietsa
| Group |
MDA (nmol mgprot−1) |
GSH-Px (U mgprot−1) |
T-SOD (U mgprot−1) |
T-AOC (U mgprot−1) |
CAT (U mgprot−1) |
| *p < 0.05 compared with the HFD model group. **p < 0.01 compared with the HFD model group. |
| Normal control |
3.92 ± 0.23 |
827.25 ± 37.27 |
226.96 ± 6.16 |
1.61 ± 0.02* |
49.71 ± 1.60 |
| HFD model |
4.38 ± 0.21 |
767.23 ± 29.33 |
218.78 ± 23.49 |
1.21 ± 0.31 |
43.24 ± 1.81 |
| HFD + T3 (108 CFU mL−1) |
3.81 ± 0.25 |
797.89 ± 54.12 |
227.78 ± 13.94 |
1.75 ± 0.17* |
57.99 ± 4.95** |
| HFD + T3 (109 CFU mL−1) |
3.52 ± 0.16* |
867.55 ± 58.57** |
251.54 ± 29.93* |
2.31 ± 0.57** |
52.45 ± 4.77* |
| HFD + M5 (108 CFU mL−1) |
3.72 ± 0.69 |
784.99 ± 75.73 |
227.35 ± 10.23 |
1.59 ± 0.39* |
45.66 ± 4.66 |
| HFD + M5 (109 CFU mL−1) |
3.31 ± 0.16* |
827.08 ± 46.61* |
249.31 ± 6.21* |
2.67 ± 0.37** |
49.35 ± 7.51 |
| HFD + X12 (108 CFU mL−1) |
3.76 ± 0.22 |
873.21 ± 75.47** |
219.60 ± 2.47 |
1.00 ± 0.34 |
45.56 ± 3.10 |
| HFD + X12 (109 CFU mL−1) |
3.70 ± 0.34 |
915.23 ± 119.36** |
227.31 ± 3.35 |
1.00 ± 0.02 |
56.66 ± 12.00** |
4. Discussion
The DPPH radical model is a widely used and relatively quick method for evaluating free radical-scavenging activity with noticeable color changes.27,28 Therefore, DPPH is often used as a substrate to evaluate antioxidant activity. In this study, the cell-free extracts of M5 and T3 showed a high DPPH scavenging activity at different concentrations (Fig. 1). The hydroxyl radical has been reported to be the most harmful ROS that is responsible for the oxidative injury of biomolecules.29 The Fenton reaction produces hydroxyl radicals in the presence of transition metals such as iron (Fe2+) and copper (Cu2+). Several LAB strains were reported to possess antioxidative activity by removing transition metal ions that might otherwise participate in hydroxyl-radical-generating Fenton-type reactions.30–32 In our study, the intracellular cell-free extracts of T3 and M5 showed strong hydroxyl radical scavenging activity at a dose of 109 CFU mL−1 (Fig. 2). Similar to that observed in the scavenging activity of DPPH and the hydroxyl radical, the intracellular cell-free extracts of T3 and M5 showed a high reducing activity among the three strains (Fig. 3). From the above results, we considered that the three lactobacilli have good antioxidant activity in vitro. Therefore, the probiotics were administrated to HFD-induced obese mice to investigate their anti-obesity and antioxidant activity in vivo.
An HFD-induced obesity mouse model was chosen since it was found that a prolonged high-fat diet may cause animal obesity associated with liver damage and elevated serum cholesterol.33,34 The beneficial effects of probiotic administration on the host metabolic state have been researched extensively, including protection from hepatic steatosis, obesity, and diabetes.35 Numerous papers have addressed the role of probiotics in the development of obesity.34,36,37 It is also known that obesity induces hepatomegaly by sinusoidal dilatation, microvesicular steatosis, or fibrosis.38,39 Lee demonstrated that after 8 weeks of feeding L. rhamnosus PL60, the probiotic reduced body weight without reducing energy intake, and caused a significant, specific reduction of white adipose tissue.40,41 Raoult stated that dietary supplements containing probiotics of the Firmicutes group, including Lactobacillus spp., Bifidobacterium spp., and Enterococcus spp., are frequently used to maintain the health and weight of livestock.42 Additionally, Pediococcus pentosaceus LP28, Lactobacillus plantarum 9-41-A or Lactobacillus fermentum M1-16 decrease body and fat pad weight gain, adipocyte size, and blood total cholesterol level.41,43 Several proposed mechanisms of the antiobesity action of probiotics have been illustrated including an increase of CLA production, increase of brown tissue thermogenesis, increase of fasting-induced adipose factor, decrease of leptin, decrease of absorption of lipid and altered activity in the appetite center.44 In our study, probiotic-treated HFD-fed mice saw a prevention of morphological alteration of the liver resulting from excess weight or obesity (Table 2). What's more, the oral administration of LAB including M5 and T3 may lower HFD-induced body weight gain, as well as blood triglyceride and total cholesterol levels (Fig. 4–6).
Oxidative stress may cause some damage and produce toxic substances, especially for patients with obesity.45,46 Antioxidant enzymes associated with diseases of the blood circulation system and tissues have been developed. Obesity could affect the oxidative stress level through multi-ways, such as energy metabolism, NADPH oxidase and the mitochondrial electron transport chain. Probiotics change the composition of intestinal flora, which affects the energy intake to decrease triglyceride and total cholesterol, meanwhile, it decreases the oxidative stress level.47 With supplementation of L. casei, Zhang greatly decreased MDA levels both in the serum and liver of hyperlipidemic rats.48 SOD and GSH-Px are intracellular antioxidant enzymes that protect against oxidative stress. Other studies showed that T-AOC, liver GPT and GOT levels and the enzymatic antioxidant activities of SOD, CAT and GSH-Px could also be used as indexes of oxidative damage.32,49 The increase of antioxidant enzyme activity in the liver is partly due to its high content of Lactobacillus. When the LAB cell is broken, intracellular enzymes will be obtained and contributed to the antioxidant system.50,51 MDA is accompanied by free radical-mediated lipid peroxidation, and its level is considered a good marker of oxidative stress.52,53 In our study, the administration of M5 or T3 was found to improve the antioxidant activity of obese mice in terms of T-SOD, GSH-Px, CAT and T-AOC in the liver (Table 2). We also found a significantly decreased level of liver MDA in the M5 and T3 groups with a high dose compared to the HFD group (p < 0.05, Table 2). The total antioxidant capacity (T-AOC) reflects the capacity of the non-enzymatic antioxidant defence system. Obvious improvements were observed in the T-AOC level while obese mice were supplemented with M5 or T3 and also showed a dose-dependent effect. Similar to our results, L. fermentum could keep normal pigs growing healthily through increasing antioxidant enzymes, including SOD, GSH-Px, and hepatic catalase.54 Besides, exopolysaccharide (EPS), which is produced by LAB, has been proven to possess manifold biological activities including anticancer, immuno modulation and antioxidant activity.53,55 Zhang et al. demonstrated that EPS from L. plantarum C88 has antioxidant effects that may involve the scavenging of reactive oxygen species (ROS), up-regulation of enzymatic and non-enzymatic antioxidant activities, and reduction of lipid peroxidation.56 Furthermore, certain cell-surface proteins are also regarded as crucial antioxidant compounds since the removal of these proteins could lead to a significant decrease of the DPPH free radical-scavenging capacity of the strain.57 Thus, these findings suggested that LAB treatment might ameliorate the synthesis of essential antioxidant enzymes.
5. Conclusions
In conclusion, T3 and M5 have higher hydroxyl and DPPH free radical scavenging activities and a higher reducing power than X12. What's more, M5 and T3 have effectively controlled body weight and hepatomegaly and significantly decreased blood triglyceride and total cholesterol levels with dose-dependence compared to the HFD model group. Besides, M5 and T3 show a favorable antioxidant capacity in the HFD-induced obese mice through the obvious improvement in antioxidative indexes including MDA levels, T-SOD, GSH-Px and T-AOC activities. T3 also showed a strong CAT activity in the liver of obese mice. Therefore L. coryniformis subsp. torquens T3 and L. paracasei ssp. paracasei M5 could be considered as potential anti-obesity and antioxidant probiotics.
Acknowledgements
This work was supported by the Youth Foundation of Natural Science Foundation of Heilongjiang Province of China (QC2016028), the project of Application Technology Research and Development of Harbin Science and Technology Bureau (2015RQQXJ055) and the project of Application Technology Research and Development of Heilongjiang Province (PC13S11). We thank the MIIT Key Laboratory of Critical Materials Technology for New Energy Conversion and Storage, School of Chemistry and Chemical Engineering, Harbin Institute of Technology, for the instruments that supported this research.
Notes and references
- P. D. Ray, B.-W. Huang and Y. Tsuji, Cell. Signalling, 2012, 24, 981–990 CrossRef CAS PubMed.
- T. H. Sanderson, C. A. Reynolds, R. Kumar, K. Przyklenk and M. Hüttemann, Mol. Neurobiol., 2013, 47, 9–23 CrossRef CAS PubMed.
- W. Liao, Z. Ning, L. Chen, Q. Wei, E. Yuan, J. Yang and J. Ren, J. Agric. Food Chem., 2014, 62, 8648–8654 CrossRef CAS PubMed.
- P. Sharma, A. B. Jha, R. S. Dubey and M. Pessarakli, J. Bot., 2012, 1–26 CrossRef CAS.
- M. Valko, K. Jomova, C. J. Rhodes, K. Kuča and K. Musílek, Arch. Toxicol., 2015, 1–37 Search PubMed.
- M. Van Greevenbroek, C. Schalkwijk and C. Stehouwer, Neth. J. Med., 2013, 71, 174–187 CAS.
- J. Tang, H. Yan and S. Zhuang, Int. J. Nephrol., 2012, 1–11 CrossRef PubMed.
- N. Rigby, Nutrients, 2013, 5, 4206–4210 CrossRef PubMed.
- J. K. Dowman, L. J. Hopkins, G. M. Reynolds, N. Nikolaou, M. J. Armstrong, J. C. Shaw, D. D. Houlihan, P. F. Lalor, J. W. Tomlinson and S. G. Hübscher, Am. J. Pathol., 2014, 184, 1550–1561 CrossRef CAS PubMed.
- K. Ohashi, R. Shibata, T. Murohara and N. Ouchi, Trends Endocrinol. Metab., 2014, 25, 348–355 CrossRef CAS PubMed.
- N. Das, K. Sikder, S. Ghosh, B. Fromenty and S. Dey, Indian J. Exp. Biol., 2012, 50, 404–412 Search PubMed.
- A. Dey and J. Lakshmanan, Food Funct., 2013, 4, 1148–1184 CAS.
- C. Wang, C. Shi, X. Yang, M. Yang, H. Sun and C. Wang, Eur. J. Pharmacol., 2014, 744, 52–58 CrossRef CAS PubMed.
- N. Karaouzene, H. Merzouk, M. Aribi, S. Merzouk, A. Y. Berrouiguet, C. Tessier and M. Narce, Nutr., Metab. Cardiovasc. Dis., 2011, 21, 792–799 CrossRef CAS PubMed.
- Y.-C. Niu, R.-N. Feng, Y. Hou, K. Li, Z. Kang, J. Wang, C.-H. Sun and Y. Li, Br. J. Nutr., 2012, 108, 57–61 CrossRef CAS PubMed.
- N. M. Delzenne, A. M. Neyrinck, F. Bäckhed and P. D. Cani, Nat. Rev. Endocrinol., 2011, 7, 639–646 CrossRef CAS PubMed.
- M. Le Barz, F. F. Anhe, T. V. Varin, Y. Desjardins, E. Levy, D. Roy, M. C. Urdaci and A. Marette, Diabetes Metab. J., 2015, 39, 291–303 CrossRef PubMed.
- N.-K. Lee, S.-Y. Kim, K. J. Han, S. J. Eom and H.-D. Paik, LWT--Food Sci. Technol., 2014, 58, 130–134 CrossRef CAS.
- F. A. Ayeni, B. Sánchez, B. A. Adeniyi, G. Clara, A. Margolles and P. Ruas-Madiedo, Int. J. Food Microbiol., 2011, 147, 97–104 CrossRef PubMed.
- T. Kuda, N. Kaneko, T. Yano and M. Mori, Food Chem., 2010, 120, 517–522 CrossRef CAS.
- M. Ahotupa, M. Saxelin and R. Korpela, Nutr. Today, 1996, 31, 51S CrossRef.
- T. Kanno, T. Kuda, C. An, H. Takahashi and B. Kimura, LWT--Food Sci. Technol., 2012, 47, 25–30 CrossRef CAS.
- M. Y. Lin and C. L. Yen, J. Agric. Food Chem., 1999, 47, 1460–1466 CrossRef CAS PubMed.
- Y.-H. Huang, Y.-J. Lai and C.-C. Chou, J. Biosci. Bioeng., 2011, 112, 49–53 CrossRef CAS PubMed.
- Z. He, H. Luo, C. Cao and Z. Cui, Am. J. Chin. Med., 2004, 6, 236–237 Search PubMed.
- C. C. Ng, C. Y. Wang, Y. P. Wang, W. S. Tzeng and Y. T. Shyu, J. Biosci. Bioeng., 2011, 111, 289–293 CrossRef CAS PubMed.
- J. B. L. Tan and Y. Y. Lim, Food Chem., 2015, 172, 814–822 CrossRef CAS PubMed.
- S. Harsha and K. Anilakumar, J. Food Sci. Technol., 2014, 51, 1533–1539 CrossRef CAS PubMed.
- V. Sasikala, S. Saravana and T. Parimelazhagan, J. Appl. Pharm. Sci., 2011, 1, 89–96 Search PubMed.
- H. Lee, H. Yoon, Y. Ji, H. Kim, H. Park, J. Lee, H. Shin and W. Holzapfel, Int. J. Food Microbiol., 2011, 145, 155–161 CrossRef CAS PubMed.
- B.-J. Lee, J.-S. Kim, Y. M. Kang, J.-H. Lim, Y.-M. Kim, M.-S. Lee, M.-H. Jeong, C.-B. Ahn and J.-Y. Je, Food Chem., 2010, 122, 271–276 CrossRef CAS.
- A. Amaretti, M. Di Nunzio, A. Pompei, S. Raimondi, M. Rossi and A. Bordoni, Appl. Microbiol. Biotechnol., 2013, 97, 809–817 CrossRef CAS PubMed.
- S. A. Noeman, H. E. Hamooda and A. A. Baalash, Diabetol. Metab. Syndr., 2011, 3, 17 CrossRef CAS PubMed.
- T. Arora, J. Anastasovska, G. Gibson, K. Tuohy, R. K. Sharma, J. Bell and G. Frost, Br. J. Nutr., 2012, 108, 1382–1389 CrossRef CAS PubMed.
- S.-W. Kim, K.-Y. Park, B. Kim, E. Kim and C.-K. Hyun, Biochem. Biophys. Res. Commun., 2013, 431, 258–263 CrossRef CAS PubMed.
- R. J. Gøbel, N. Larsen, M. Jakobsen, C. Mølgaard and K. F. Michaelsen, J. Pediatr. Gastroenterol. Nutr., 2012, 55, 673–678 CrossRef PubMed.
- S. R. Yoo, Y. J. Kim, D. Y. Park, U. J. Jung, S. M. Jeon, Y. T. Ahn, C. S. Huh, R. McGregor and M. S. Choi, Obesity, 2013, 21, 2571–2578 CrossRef CAS PubMed.
- Y. Maor and S. Malnick, Int. J. Hepatol., 2013, 1–8 CrossRef PubMed.
- X. R. Yang, E. Wat, Y. P. Wang, C. H. Ko, C. M. Koon, W. S. Siu, S. Gao, D. W. S. Cheung, C. B. S. Lau and C. X. Ye, J. Evidence-Based Complementary Altern. Med., 2013, 1–11 Search PubMed.
- H.-Y. Lee, J.-H. Park, S.-H. Seok, M.-W. Baek, D.-J. Kim, K.-E. Lee, K.-S. Paek, Y. Lee and J.-H. Park, Biochim. Biophys. Acta, Mol. Cell Biol. Lipids, 2006, 1761, 736–744 CrossRef CAS PubMed.
- X. Zhao, F. Higashikawa, M. Noda, Y. Kawamura, Y. Matoba, T. Kumagai and M. Sugiyama, PLoS One, 2012, 7(2), 1–8 Search PubMed.
- D. Raoult, Nat. Rev. Microbiol., 2009, 7, 616 CrossRef CAS PubMed.
- N. Xie, Y. Cui, Y.-N. Yin, X. Zhao, J.-W. Yang, Z.-G. Wang, N. Fu, Y. Tang, X.-H. Wang and X.-W. Liu, BMC Complementary Altern. Med., 2011, 11, 53 CrossRef CAS PubMed.
- K. Lee, K. Paek, H. Lee, J. H. Park and Y. Lee, J. Appl. Microbiol., 2007, 103, 1140–1146 CrossRef CAS PubMed.
- M. Matsuda and I. Shimomura, Obes. Res. Clin. Pract., 2013, 7, e330–e341 CrossRef PubMed.
- S. Saeidnia and M. Abdollahi, Toxicol. Appl. Pharmacol., 2013, 273, 442–455 CrossRef CAS PubMed.
- E. Esposito, A. Iacono, G. Bianco, G. Autore, S. Cuzzocrea, P. Vajro, R. B. Canani, A. Calignano, G. M. Raso and R. Meli, J. Nutr., 2009, 139, 905–911 CrossRef CAS PubMed.
- X. Zhang, D. Li, Y.-j. Zhao, C.-h. Niu and Z.-n. Yang, Food Sci., 2010, 31, 141–144 CAS.
- A. B. Hougaard, H. Pindstrup, N. Arneborg, M. L. Andersen and L. H. Skibsted, Food Res. Int., 2016, 79, 81–87 CrossRef CAS.
- T. Kullisaar, M. Zilmer, M. Mikelsaar, T. Vihalemm, H. Annuk, C. Kairane and A. Kilk, Int. J. Food Microbiol., 2002, 72, 215–224 CrossRef CAS PubMed.
- M.-Y. Lin and C.-L. Yen, J. Agric. Food Chem., 1999, 47, 1460–1466 CrossRef CAS PubMed.
- J. Xu, Y. T. Wang, X. Y. Wang, X. R. Li and Q. X. Dang, 2015, 1092, 1519–1524.
- Y. Guo, D. Pan, H. Li, Y. Sun, X. Zeng and B. Yan, Food Chem., 2013, 138, 84–89 CrossRef CAS PubMed.
- A. Wang, X. Yi, H. Yu, B. Dong and S. Qiao, J. Appl. Microbiol., 2009, 107, 1140–1148 CrossRef CAS PubMed.
- C. F. Liu, K. C. Tseng, S. S. Chiang, B. H. Lee, W. H. Hsu and T. M. Pan, J. Sci. Food Agric., 2011, 91, 2284–2291 CAS.
- L. Zhang, C. Liu, D. Li, Y. Zhao, X. Zhang, X. Zeng, Z. Yang and S. Li, Int. J. Biol. Macromol., 2013, 54, 270–275 CrossRef CAS PubMed.
- D. Pan and X. Mei, Carbohydr. Polym., 2010, 80, 908–914 CrossRef CAS.
Footnote |
| † The authors contributed equally to this work. |
|
| This journal is © The Royal Society of Chemistry 2016 |