 Open Access Article
Creative Commons Attribution 3.0 Unported Licence
Electrochemical detection of single micelles through ‘nano-impacts’†
H. S.
Toh
and
R. G.
Compton
*
Department of Chemistry, Physical and Theoretical Chemistry Laboratory, Oxford University, South Parks Road, Oxford, OX1 3QZ, UK. E-mail: Richard.Compton@chem.ox.ac.uk
First published on 18th June 2015
Abstract
A new class of ‘soft’ particles, micelles, is detected electrochemically via ‘nano-impacts’ for the first time. Short, sharp bursts of current are used to indicate the electrical contact of a single CTAB (cetyltrimethylammonium bromide) micelle with an electrode via the oxidation of the bromide content. The variation in CTAB concentration for such ‘nano-impact’ experiments shows that a significant number of ‘spikes’ are observed above the CMC (critical micelle concentration) and this is attributed to the formation of micelles. A comparison with dynamic light scattering is also reported.
Introduction
‘Nano-impact’ chronoamperometry is a novel method developed to analyse single particles.1 It works by recording the electrochemical signal generated when a single particle hits the electrode held at a suitable potential.2 For direct electrochemical detection, a redox reaction of the particle occurs upon electrical contact with the electrode, Faradaic current is generated and this results in a short increase in current (‘spike’) on the chronoamperogram.Typically, this is used to detect ‘hard’ metallic nanoparticles like silver,2–4 gold,5,6 nickel4,6 and mercury halides.7,8 However, ‘soft’ particles are also detectable through ‘nano-impacts’,9–13 starting with the work of Hasse et al. where lecithin liposomes were recorded through capacitative ‘spikes’.9 Recently, the direct oxidation of the encapsulated materials such as vitamin C10 and catecholamine hormones11 have been used to determine the presence of liposomes.
Hitherto, most ‘soft’ particles analysed by ‘nano-impacts’ are liposomes.9–13 These lipid vesicles are aqueous compartments enclosed by a lipid bilayer.14Scheme 1 illustrates their capability to capture a small volume of aqueous solution. Therefore, detection is often based on the redox active components encapsulated within.10–12 However, in the current study, the direct detection of micelles using ‘nano-impacts’ is explored. These are globular structures with polar head groups surrounded by water whilst their hydrocarbon tails are isolated inside, facing one another and away from the aqueous environment.14Scheme 1 shows the close packing of the hydrophobic groups of the micelle which confers thermodynamic stability.15 Within the digestive system, bile salts forms micelles to aid in the uptake of fat soluble vitamins (i.e. vitamin A, D, E and K).16 They are also often used as soap as they emulsify oil, allowing water to wash away oil-containing micelles.17
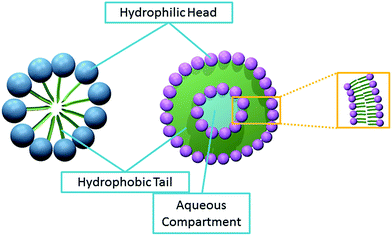 | ||
| Scheme 1 The structure of micelle (left) and liposome (right). The spheres represent the hydrophilic groups of the amphipathic molecule. The hydrophobic groups are represented by the green lines. | ||
In the present study, cetyltrimethylammonium bromide (CTAB) is used as the analyte to form the micelles for detection. As shown in Scheme 2, it is a cationic agent containing a quaternary ammonium cation and a bromide anion.18 CTAB forms micelles as it only has a single hydrocarbon chain;19 molecules with two hydrocarbon tails prefer to form liposomes due to their bulky hydrophobic groups.20 In addition, CTAB is a regular reagent for DNA extraction in plants.21–23 Due to its importance, the critical micelle concentration (CMC) of this standard micellar agent is well-studied.24–27
Herein, the detection of CTAB micelles is performed through the electrochemical method of ‘nano-impacts’. The electrochemical oxidation of CTAB was first studied on a macro electrode system and compared to the oxidation of free bromide ions in aqueous solution. Next, ‘nano-impacts’ were used to determine the potential onset of the ‘spikes’ and the influence of CTAB concentration on the chronoamperograms. Dynamic light scattering was also performed to analyse the size distribution of the CTAB micelles.
Results and discussion
First, a solution of CTAB was oxidised on a macro glassy carbon electrode via cyclic voltammetry to determine the oxidation potential arising from the bromide ion content. Next, the oxidation study of CTAB was performed on a carbon microdisc electrode to ensure that the data obtained on the two types of electrodes can be compared across both cyclic voltammetric and chronoamperometric data. Then, current–time transients were performed to observe the ‘spikes’ generated by the CTAB micelles impacting the microelectrode. The onset potential of the signals was determined by holding different potentials on the electrode during chronoamperometry. It is compared to the oxidation signal obtained in cyclic voltammetry to ensure the ‘spikes’ originated from the CTAB micelles. Next, the CTAB concentration was varied to determine its correlation to ‘spike’ frequency and magnitude. Last, dynamic light scattering was employed to determine the size distribution of the micelles and it is inferred that only the large CTAB micelles are detected via the ‘nano-impact’ method.Cyclic voltammetry studies
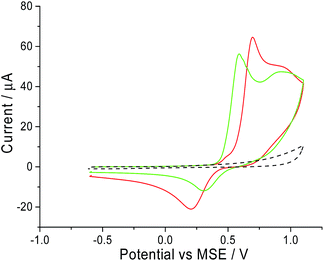
A freshly polished macro glassy carbon electrode was dipped into a solution containing 5.0 mM of CTAB and 0.10 M of sodium nitrate supporting electrolyte. A cyclic voltammetric scan started oxidatively from −0.6 V vs. MSE towards +1.1 V vs. MSE at a scan rate of 25 mV s−1. This experiment (red line in Fig. 1) gave two distinct peaks at +0.7 V and +0.9 V vs. MSE. In the absence of CTAB (black dashed line in Fig. 1), no oxidative signals are observed. To determine if the peaks arose from the bromide ion in CTAB, the same cyclic voltammetry experiment was performed with 5.0 mM of potassium bromide instead of CTAB. Two similar distinctive signals at +0.6 V and +0.9 V vs. MSE are recorded for potassium bromide (green line in Fig. 1). Overlaying the two voltammograms, the slight difference in oxidation potential can be attributed to the ion pairing present with CTAB. Thus, from literature, the two peaks correspond respectively to:28,29| 1st wave: 3Br− → Br−3 + 2e− | (1) |
| 2nd wave: 2Br− → Br2 + 2e− | (2) |
Since these signals are both observed in the voltammogram of CTAB and potassium bromide, it is highly likely that the electrochemical oxidation of CTAB involves its bromide counter ion.
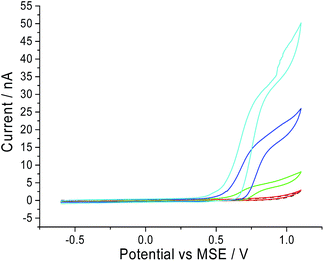
Next, the oxidation of CTAB on a carbon microdisc electrode was investigated to ensure that the mechanism remains similar to the one observed on a macro electrode. This is to provide a basis for chronoamperometric studies where a micro electrode was used to lower background noise. Thus, a carbon microdisc electrode was immersed in a solution of 0.10 M sodium nitrate electrolyte and various concentrations of CTAB. Cyclic voltammetry was performed with the same potential window of −0.6 V to +1.1 V vs. MSE at a scan rate of 10 mV s−1 and these voltammograms are summarised in Fig. 2. The increase in anodic current around +0.7 V vs. MSE is clearly noticeable at 1.0 mM, 5.0 mM and 10.0 mM of CTAB in Fig. 2 (green, blue and cyan line respectively). This corresponds to the first oxidation signal occurring on the macro glassy carbon electrode at +0.7 V vs. MSE in Fig. 1. In addition, at 10.0 mM CTAB, the voltammogram has a two-step increase in current at +0.7 V and +0.9 V vs. MSE which correlates to the two peaks (i.e. +0.7 V and +0.9 V vs. MSE) observed in Fig. 1. The slight difference in onset potential can be attributed to the common occurrence of finding reversible electrochemistry on a macro electrode appearing as less reversible on a microelectrode. Thus, there is no significant difference between the oxidation of CTAB on a macro glassy carbon electrode and a carbon microdisc electrode. At 100 μM of CTAB, no increase of anodic current is observed as the concentration has fallen below the detection limit of the cyclic voltammetric system.
Chronoamperometric studies
The ‘nano-impact’ method involves performing current–time transients with a carbon microdisc electrode held at a fixed potential.2,3 As a single micelle comes into contact with the oxidising electrode surface, the redox species (i.e. CTAB) is oxidised, generating a ‘spike’.Two different experiments were performed in this study to ensure that the signals are caused by CTAB micelles. First, multiple blank chronoamperometric scans were performed before the start of every ‘nano-impact’ experiment. The electrode was placed in 0.10 M sodium nitrate and held at a potential of +1 V vs. MSE for fifty seconds. No ‘spike’ was observed for blank scans in the absence of CTAB. ‘Spikes’ were only observed after an aliquot of CTAB is added into the solution.
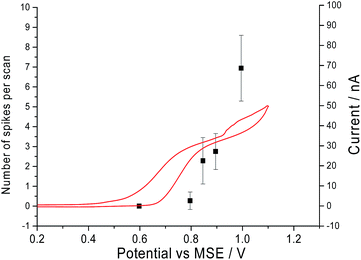
Second, it was determined that the onset potential for the ‘spikes’ matches the oxidation potential observed in the cyclic voltammograms. Current–time transients were performed in a solution of 10.0 mM of CTAB and 0.10 M sodium nitrate at different potentials ranging from +0.6 V to +1 V vs. MSE. In Fig. 3, the number of ‘spikes’ observed per scan is overlaid with the cyclic voltammogram of a solution containing 10.0 mM CTAB and 0.10 M sodium nitrate. At +0.6 V vs. MSE, no ‘spike’ is seen in the chronoamperograms and no oxidation is occurring in cyclic voltammogram. At +0.8 V vs. MSE, a clear increase in anodic current is seen in the cyclic voltammogram and 3 ‘spikes’ are seen in a total of 11 current–time transients. At +1 V vs. MSE, a total of 229 ‘spikes’ are counted from 33 chronoamperograms whilst CTAB is oxidised in the cyclic voltammograms. Thus, the onset potential of the ‘spikes’ has a slight overpotential compared to its cyclic voltammogram counterpart. The small overpotential is required to oxidise the bromide content in the stabilised micelles compared to the non-micellar bromide ions in solution. Hence, the comparison of the onset potential of the ‘spikes’ and the oxidation signal in cyclic voltammogram indicated that the ‘spikes’ are caused by CTAB micelles. The mechanism of oxidation of the micelles might occur either via electron hopping as described by Amatore et al. for the case of a dendrimer molecule or via coupled oxidation of bromide ions and loss of cationic surfactant molecules.30
Next, chronoamperometric scans were performed across different concentrations of CTAB (i.e. 0.01 mM to 20 mM) in 0.10 M sodium nitrate to determine effects of concentrations on ‘spikes’. All fifty second current–time transients were recorded at +1 V vs. MSE with a carbon microdisc electrode. The individual chronoamperograms at each concentration can be found in Fig. S1 in the ESI.† Examples of the ‘spikes’ observed in the chronoamperograms are displayed in Fig. S2 of the ESI.† The background current increases with CTAB concentration due to the increase in free CTAB molecules present in the solution. In Fig. 4, the number of ‘spikes’ observed per scan are plotted against the CTAB concentration. It is seen that with increasing amount of CTAB, the number of ‘spikes’ observed increases. The onset of signals (at least one ‘spike’ per scan) coincides with the CTAB CMC of 0.05 mM.24 This indicates that the significant number of ‘spikes’ recorded are attributed to the CTAB micelles formed above CMC. This could possibly provide a novel method for CMC determination instead of the traditional technique of surface tension measurement.
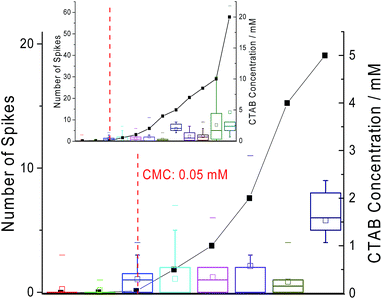 | ||
| Fig. 4 The close-up plot of the number of spikes observed per scan (box plot) and the concentration of CTAB at which the spikes are recorded (scatter plot). Inlay: the number of spikes seen per scan against the full range of CTAB concentration tested. Red dotted line: the critical micelle concentration of 0.05 mM from literature.24 The box reflects the 25th and 75th percentile. The short dash represents the maximum number of spikes observed per scan while the square represents the mean. | ||
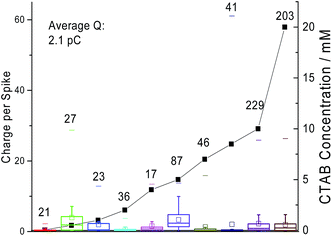
In Fig. 5, the average charge passed under a ‘spike’ is plotted against the amount of CTAB in solution with the standard deviations plotted as error bars. As observed in Fig. 5, there is no correlation between the amount of current passed and the CTAB concentration. The average charge measured per ‘spike’ across all concentrations of CTAB is 2.1 pC. If all the current measured is Faradaic, this corresponds to the oxidation of 1.3 × 10⁷ CTAB molecules given that CTAB oxidation is a one electron reaction. Thus, very large micelles must be responsible for the Faradaic charge measured. Additionally, there might be capacitive coupling whereby the Faradaic signal is amplified by the change in interfacial capacitance on impact. The possibility of ‘spikes’ originating only from a capacitative nature is ruled out because a control experiment was performed at negative potentials (i.e. −0.8 V to −1 V vs. MSE) and no ‘spikes’ were recorded.
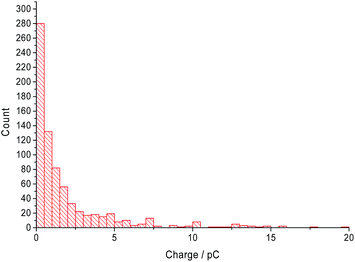
The distribution of the charge passed under each ‘spike’ across all CTAB concentrations are displayed in Fig. 6. Most of the recorded ‘spikes’ are small and 37% of them have a charge lower than 0.5 pC. In fact, 80% of all ‘spikes’ recorded contained less than 3 pC. From Fig. 6, the charge distribution resembles the tail of a log normal distribution. Thus, it is hypothesized that only the large CTAB micelles are recorded on the chronoamperograms under the assumption that the micelles follow a log normal size distribution. This hypothesis is supported by the data in Fig. 4 and 5. In Fig. 4, as the concentration of CTAB increases, the number of large micelles grows, thus leading to an increase in frequency of ‘spikes’. However, the average charge per ‘spike’ is independent of CTAB concentration (Fig. 5). This is because size differences among the larger micelles do not change the current measured significantly compared to micelles of a smaller size. Assuming a surface reaction, a 2% increase in current is observed when a particle changes from 100 nm to 101 nm while a 21% increase is seen as a particle changes from 10 nm to 11 nm. Therefore, to prove that the CTAB micelles follow a log normal size distribution, dynamic light scattering was next performed to support the hypothesis.
Dynamic light scattering studies
Dynamic light scattering was performed on a sample of 10.0 mM CTAB in 0.10 M sodium nitrate to measure the size distribution of the CTAB micelles. The intensity weighted size distribution is summarised in Fig. 7. The black line shows the CTAB micelle sample following a log normal distribution with an average hydrodynamic diameter of 41.2 nm and a mode of 56.7 nm. The sample has a polydispersity index of 0.245. This observation of a log normal size distribution strongly supports the hypothesis of ‘nano-impact’ method measuring only the larger micelles and the tail of the size distribution is detected through the chronoamperograms in Fig. 6.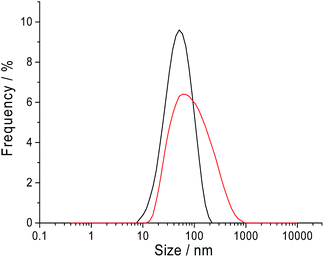 | ||
| Fig. 7 The intensity weighted hydrodynamic diameter of the CTAB micelles in sodium nitrate solution containing 10.0 mM CTAB at 25 °C. Black: 0.10 M sodium nitrate; red: 0.50 M sodium nitrate. | ||
To carry this hypothesis further, the electrolyte concentration was varied for the dynamic light scattering and ‘nano-impact’ experiments. From literature, it is known that smaller micelles are formed in the presence of a lower electrolyte concentration.24 From Table 1, it is observed that at 0.05 M sodium nitrate, the CTAB micelles has an average diameter of 11.7 nm compared to 41.2 nm (0.10 M sodium nitrate, black line in Fig. 7) and 61.7 nm (0.50 M sodium nitrate, red line in Fig. 7) at higher concentrations of electrolyte. The counterpart electrochemical control experiment was performed with 10.0 mM CTAB in a lower electrolyte concentration of 0.05 M sodium nitrate via ‘nano-impact’. No ‘spike’ was observed in the chronoamperograms. This is likely due to the absence of very large micelles in the lower electrolyte concentration environment. Thus, this further strengthens the hypothesis where ‘nano-impacts’ are detecting the large micelles present in the CTAB solution. It is to be taken note that dynamic light scattering was attempted with 0.05 M sodium nitrate in the current study. However, the polydispersity nature of the sample resulted in an unsuccessful measurement.
Despite the micelles having an average hydrodynamic diameter of 41.2 nm at 0.10 M sodium nitrate, most of smaller particles are not detected via ‘nano-impacts’. In the literature, silver nanoparticles of 6 nm diameter have been successfully analysed and sized.8 Comparing with a previous study where the exact same set-up and microcarbon electrode were utilised, silver nanoparticles of an average diameter of 24 nm were detected.3 The silver nanoparticles gave an average charge of 0.66 pC with a background noise level of 6 pA. In the current study, the average charge measured was 2.1 pC. As mentioned previously, the background current increases with the CTAB concentration in Fig. S1.† It is also observed that the variation of CTAB concentration resulted in different background noise of 6 pA (0.5 mM CTAB), 20 pA (4.0 mM CTAB) and 40 pA (20.0 mM CTAB). Thus, the magnitude of the background noise correlated directly with the amount of CTAB present in the solution. With a higher noise, there is a greater difficulty to differentiate the signals from the background noise. Hence, the rest of the smaller micelles remain undetected as the ‘spikes’ they generate cannot be resolved from the background noise. Therefore, ‘nano-impacts’ has detected the larger single CTAB micelles towards the tail of the size distribution.
Experimental
Chemicals
Cetyltrimethylammonium bromide (95%, ((C16H33)N(CH3)3Br)) and ethanol (≥99.8%, C2H5OH) was purchased from Sigma-Aldrich, Dorset, UK. Sodium nitrate (>99.5%, NaNO3) was supplied from Fisons Scientific Equipment, Loughborough, UK. Ultrapure water from Millipore with resistivity no less than 18.2 MΩ cm at 25 °C was used to prepare all solutions.Electrochemical apparatus
A μAutolab II (Metrohm-Autolab BV, Utrecht, The Netherlands) was used to control the electrochemical experiments with the software of NOVA 1.10. All electrochemistry experiments were performed in a Faraday cage with a three electrode system. For cyclic voltammetry experiments, a glassy carbon electrode (CH instruments, Austin, USA) of 3.0 mm diameter was used. It was polished on diamond spray (Kemet, Kent, UK) in the size sequence of 3.0 μm, 1.0 μm and 0.1 μm to a mirror finish. For chronoamperometric experiments, a carbon microdisc working electrode (BASi, West Lafayette, USA) of radius 4.9 μm was used. It was polished on alumina powder (Buehler, Coventry, UK) in the size sequence of 1.0 μm, 0.3 μm and 0.05 μm before experiments. The reference electrode was a standard MSE (mercury/mercurous sulphate reference electrode [Hg/Hg2SO4, K2SO4 (saturated)], +0.62 V vs. standard hydrogen electrode) (BASi, West Lafayette, USA).31 The counter electrode was a platinum mesh (99.99%) (Goodfellow Cambridge Ltd, Huntingdon, UK). All electrochemical measurements were thermostated at 25 ± 1 °C.Chronoamperometric experiments
Prior to every chronoamperometric experiments, the electrochemical cell was cleaned by sonication in a mixture of ethanol and water (1![[thin space (1/6-em)]](https://www.rsc.org/images/entities/char_2009.gif) :
:![[thin space (1/6-em)]](https://www.rsc.org/images/entities/char_2009.gif) 1 ratio) for at least 30 minutes to avoid any contamination by leftover CTAB. All electrodes were rinsed with ethanol and ultrapure water to ensure no CTAB is carried over from previous experiments. Fifty seconds long chronoamperometric scans with a sampling time of 0.0005 seconds were recorded. The number and magnitude of the ‘spikes’ were determined by the software of SignalCounter. The software SignalCounter was developed by Dr Dario Omanović from Division for Marine and Environmental Research, Ruđer Bošković Institutue, Zagreb, Croatia for in-house use as a part of a collaboration.32,33 This software is programmed to pick up ‘spikes’ of a minimum intensity of 5 pA height. A linear baseline was taken and the charge underneath the peak calculated. The baseline was taken at the midpoint of the average noise to minimize the amount of background taken as signal. All signals were further checked manually to differentiate actual ‘spikes’ from noise through the signal shape.
1 ratio) for at least 30 minutes to avoid any contamination by leftover CTAB. All electrodes were rinsed with ethanol and ultrapure water to ensure no CTAB is carried over from previous experiments. Fifty seconds long chronoamperometric scans with a sampling time of 0.0005 seconds were recorded. The number and magnitude of the ‘spikes’ were determined by the software of SignalCounter. The software SignalCounter was developed by Dr Dario Omanović from Division for Marine and Environmental Research, Ruđer Bošković Institutue, Zagreb, Croatia for in-house use as a part of a collaboration.32,33 This software is programmed to pick up ‘spikes’ of a minimum intensity of 5 pA height. A linear baseline was taken and the charge underneath the peak calculated. The baseline was taken at the midpoint of the average noise to minimize the amount of background taken as signal. All signals were further checked manually to differentiate actual ‘spikes’ from noise through the signal shape.
Dynamic light scattering
Dynamic light scattering (Zetasizer NanoZS, Malvern Instruments Ltd, Malvern, UK) was used as a technique to characterise the CTAB micelles in the solution at 25 °C. A red laser of 633 nm was used to determine the size of the micelles in 10 mM CTAB solution with various concentration of electrolyte.Conclusions
This work reports for the first time, ‘nano-impacts’ to be a novel method for the detection of large CTAB micelles. From the cyclic voltammetric experiments, it is found that CTAB oxidation is attributed to the oxidation of its bromide ion. This one electron oxidation is responsible for the Faradaic current to generate ‘spikes’ in ‘nano-impact’. In the chronoamperometric scans, the onset potential of the ‘spikes’ matches the oxidation potential of CTAB in the cyclic voltammogram. Hence, the signals are attributed to the CTAB micelles present in the solution. By varying the concentration of CTAB, it is found that the number of ‘spikes’ per scan increases with concentration as more CTAB micelles are formed. Comparing the charge distribution of the ‘spikes’ and dynamic light scattering data, it is concluded that large CTAB micelles are detectable by ‘nano-impacts’. This represents an entirely new class of ‘soft’ particles that can be studied via this means.Acknowledgements
HST is supported by the National Research Foundation Singapore under its National Research Foundation (NRF) Environmental and Water Technologies (EWT) PhD Scholarship Programme and administered by the Environment and Water Industry Programme Office (EWI). The research leading to these results has received partial funding (RGC) from the European Research Council under the European Union's Seventh Framework Programme (FP/2007–2013)/ERC Grant Agreement no. [320403].References
- N. V. Rees, Electrochem. Commun., 2014, 43, 83–86 CrossRef CAS PubMed.
- Y.-G. Zhou, N. V. Rees and R. G. Compton, Angew. Chem., Int. Ed., 2011, 50, 4219–4221 CrossRef CAS PubMed.
- H. S. Toh, K. Jurkschat and R. G. Compton, Chem.–Eur. J., 2015, 21, 2998–3004 CrossRef CAS PubMed.
- E. J. E. Stuart, Y.-G. Zhou, N. V. Rees and R. G. Compton, RSC Adv., 2012, 2, 6879–6884 RSC.
- Y.-G. Zhou, N. V. Rees, J. Pillay, R. Tshikhudo, S. Vilakazi and R. G. Compton, Chem. Commun., 2012, 48, 224–226 RSC.
- Y.-G. Zhou, E. J. E. Stuart, J. Pillay, S. Vilakazi, R. Tshikhudo, N. V. Rees and R. G. Compton, Chem. Phys. Lett., 2012, 551, 68–71 CrossRef CAS PubMed.
- T. R. Bartlett, C. Batchelor-McAuley, K. Tschulik, K. Jurkschat and R. G. Compton, ChemElectroChem, 2015, 2, 522–528 CrossRef CAS PubMed.
- C. Batchelor-McAuley, J. Ellison, K. Tschulik, P. L. Hurst, R. Boldt and R. G. Compton, Analyst, 2015 10.1039/C5AN00474H.
- D. Hellberg, F. Scholz, F. Schauer and W. Weitschies, Electrochem. Commun., 2002, 4, 305–309 CrossRef CAS.
- W. Cheng and R. G. Compton, Angew. Chem., Int. Ed., 2014, 53, 13928–13930 CrossRef CAS PubMed.
- J. Dunevall, H. Fathali, N. Najafinobar, J. Lovric, J. Wigstrom, A. S. Cans and A. G. Ewing, J. Am. Chem. Soc., 2015, 137, 4344–4346 CrossRef CAS PubMed.
- B. K. Kim, J. Kim and A. J. Bard, J. Am. Chem. Soc., 2015, 137, 2343–2349 CrossRef CAS PubMed.
- A. Oleinick, F. Lemaître, M. G. Collignon, I. Svir and C. Amatore, Faraday Discuss., 2013, 164, 33–55 RSC.
- L. Stryer, Biochemistry, W. H. Freeman and Company, New York, US, 1995 Search PubMed.
- G. Taddei, Colloid Polym. Sci., 1994, 272, 1300–1305 CAS.
- G. R. Thompson, J. Clin. Pathol., Suppl., 1971, 5, 85–89 CrossRef PubMed.
- H. Hart, C. M. Hadad, L. Craine and D. J. Hart, Organic Chemistry: A Short Course, Brooks/Cole, Belmont, US, 13th edn, 2012 Search PubMed.
- Electrokinetic Chromatography: Theory, Instrumentation and Applications, ed. U. Pyell, John Wiley & Sons, Ltd, Chichester, UK, 2006 Search PubMed.
- S. Svenson, Reactions And Synthesis In Surfactant Systems, Marcel Dekker, Inc., New York, US, 2001 Search PubMed.
- P. Atkins and J. de Paula, Physical Chemistry for the Life Sciences, Oxford University Press, Oxford, UK, 2nd edn, 2011 Search PubMed.
- S. Porebski, L. G. Bailey and B. R. Baum, Plant Mol. Biol. Rep., 1997, 15, 8–15 CrossRef CAS.
- S. O. Rogers and A. J. Bendich, Plant Mol. Biol., 1985, 5, 69–76 CrossRef CAS PubMed.
- M. A. Lodhi, G.-N. Ye, N. F. Weeden and B. I. Reisch, Plant Mol. Biol. Rep., 1994, 12, 6–13 CrossRef CAS.
- K. Kuperkar, L. Abezgauz, K. Prasad and P. Bahadur, J. Surfactants Deterg., 2010, 13, 293–303 CrossRef CAS.
- M. Khamis, B. Bulos, F. Jumean, A. Manassra and M. Dakiky, Dyes Pigm., 2005, 66, 179–183 CrossRef CAS PubMed.
- A. Chatterjee, S. Maiti, S. K. Sanyal and S. P. Moulik, Langmuir, 2002, 18, 2998–3004 CrossRef CAS.
- M. J. Blandamer, P. M. Cullis, L. G. Soldi, K. Chowdoji Rao and M. C. S. Subha, J. Therm. Anal., 1996, 46, 1583–1588 CrossRef CAS.
- G. D. Allen, M. C. Buzzeo, C. Villagrán, C. Hardacre and R. G. Compton, J. Electroanal. Chem., 2005, 575, 311–320 CrossRef CAS PubMed.
- V. Livshits, A. Ulus and E. Peled, Electrochem. Commun., 2006, 8, 1358–1362 CrossRef CAS PubMed.
- C. Amatore, Y. Bouret, E. Maisonhaute, J. I. Goldsmith and H. D. Abruña, Chem.–Eur. J., 2001, 7, 2206–2226 CrossRef CAS.
- CRC Handbook of Chemistry and Physics 2012-2013, ed. W. M. Haynes, CRC Press, Florida, 93rd edn, 2012 Search PubMed.
- E. J. E. Stuart, K. Tschulik, D. Omanović, J. T. Cullen, K. Jurkschat, A. Crossley and R. G. Compton, Nanotechnology, 2013, 24, 444002 CrossRef CAS PubMed.
- J. Ellison, K. Tschulik, E. J. Stuart, K. Jurkschat, D. Omanović, M. Uhlemann, A. Crossley and R. G. Compton, ChemistryOpen, 2013, 2, 69–75 CrossRef CAS PubMed.
Footnote |
| † Electronic supplementary information (ESI) available. See DOI: 10.1039/c5sc01635e |
| This journal is © The Royal Society of Chemistry 2015 |


