Cell-based sensors for quantifying the physiological impact of microsystems†
Salil P.
Desai
and
Joel
Voldman
*
Department of Electrical Engineering and Computer Science, Massachusetts Institute of Technology, 50 Vassar Street, Cambridge, MA 02139. E-mail: voldman@mit.edu; Fax: +1 617 258 5846; Tel: +1 617 253 2094
First published on 15th October 2010
Abstract
Microsystems are increasingly used in the manipulation, patterning and sorting of cells. Critical to the widespread adoption of these new technologies is development of an understanding of their impact on cellular physiology. Here we show the integration of a cell-based sensor, a microfabricated electrical screening platform, and quantitative imaging to enable the first large-scale physiological screens of the impact of microsystems on cells. To perform physiological screening, we developed a cell-based sensor that reports on stress-mediated transcription (via Heat Shock Factor 1 induced expression of GFP). This cell-based sensor was quantitatively characterized using automated imaging. The integration of this quantitative physiological sensor with a microfabricated system enabled the execution of multiplexed screens across electric field strength, frequency, and application duration. Voltage sweeps indicate increasing physiological stress with increasing voltage due to Joule heating, while frequency sweeps indicate increased stress at lower frequencies (<500 kHz) compared with higher frequencies (>1 MHz) due to generation of reactive species at lower frequencies. Combined voltage and frequency sweeps enable the generation of complex maps of physiological state.
Insight, innovation, integrationThis work presents the integration of a cell-based sensor, a microfabricated electrical screening platform, and quantitative imaging techniques to achieve the first large-scale physiological screens of the impact of microsystems on cells. This integrated platform and methodology provides biological insight into the cellular stress response, studying—for the first time at the molecular level—stress induced through the application of electric fields. The construction of a new microfabricated system for the screening of multiple electric field conditions (across field strength, frequency and application duration) represents a key technological innovation enabling multiplexed physiological screening. In all, this platform comprises the seamless integration of a biological system with microtechnology to yield quantitative information about cell physiology in electric fields. |
Introduction
Unraveling the complexity of cellular processes at the single-cell level is a central challenge in biology. Microsystems (or equivalently micro-scale technologies) present unique opportunities in addressing this challenge in their ability to manipulate, measure, culture and separate single cells.1–5 Important to the design and adoption of these microsystems is an understanding of how they may alter cellular state and behavior. Microsystem designers are thus compelled to engineer systems that minimize impact on cellular physiology, and microsystem users are required to determine whether microsystem effects can confound biological results. These requirements for both designers and users necessitate sensitive assays for quantifying physiological impact. However, assays of cellular physiology are challenging to perform in microsystems, which are typically designed to process small populations of cells (typically ranging from 10s to 1000s of cells), and are not always amenable to reagent introduction and washes required for complex, multi-step assays. As a result, assays to quantify the impact of microsystems on cellular physiology are typically limited to studying gross indicators of cellular function such as morphology, proliferation and viability.6,7 In particular, a more detailed picture of how microsystems affect cells has been hindered by the lack of experimental systems in which cell physiology can be effectively quantified.Cell-based sensors provide an attractive experimental system for quantifying cell state in microsystems. Cell-based sensors have proven to be effective tools for many fields of biology, including identifying pathogens,8 for performing toxicology studies9 and in enabling drug discovery.10 Such sensors typically build upon inherent sensitivity to environmental factors by coupling optically- or enzymatically-active proteins to gene transcription, thereby “reporting” on cellular state. While such transcriptional reporters of cell state are routinely used by the biological community, they have seen limited application in the microsystems community. Cell-based sensors are ideally suited to microsystems as they can be assayed using optical techniques (e.g.fluorescence microscopy) without the need for biochemical analysis. This provides the flexibility to either perform assays within the microsystem (in the case of systems for long-term assays) or on collection from the output of the microsystem (in the case of flow-through systems). Here we show the construction, characterization, and first application of a cell-based stress sensor in quantifying physiological conditions in a microfabricated platform.
In developing a cell-based sensor, one must choose the specificity of the sensor, namely, the set of stresses to which it will be responsive. Microsystems manipulate cells using a wide range of phenomena, including optical, mechanical, acoustic, and electrical forces, each imparting overlapping but distinct stresses on cells. Of these force transduction mechanisms electrical techniques have gained considerable attention in large part due to the ability to fabricate complex electrical systems on biocompatible substrates. In particular, electric-field-based manipulation has been used for over 30 years for positioning,11,12patterning,6,13 and separating5,14cells. Electric fields ranging in frequency from DC to GHz and in strengths from 10 V m−1 to greater than 105 V m−1 can be used to act on a cell’s charge (electrophoresis), polarization (dielectrophoresis), or on the surrounding fluid (electroosmosis). Despite the wide applicability of electric fields to cell manipulation, the impact of electric fields on cells in the kHz–MHz range of frequencies is poorly characterized. Electric fields will induce temperature excursions around the cell, create reactive species at the electrode-electrolyte interface, and result in direct cell-field interactions at the plasma membrane, all of which can lead to alterations in phenotype. Although prior work has examined the gross effects (e.g., viability, proliferation) of electric fields on cells,15–17 the field conditions were limited and specific geometries prevented generalization. More fundamentally, though, such gross assays do not provide information as to whether there are subtler effects (such as the activation of signaling pathways) that mask or alter particular phenotypes of interest.
By integrating a cell-based sensor reporting on activation of the stress response with an electric-field-based microsystem, we have performed the first large-scale screen of the quantitative effects of electric fields on stress activation in cultured cells, encompassing measurements across >140 field conditions on >200![[thin space (1/6-em)]](https://www.rsc.org/images/entities/char_2009.gif) 000 cells. To perform this screen, we took advantage of the multiplexing capabilities of the microsystem and its compatibility with quantitative fluorescence microscopy to screen across field strength, frequency and application duration. The information from this screen has been consolidated into maps of physiological state that are able to better inform the design of electrical manipulation systems and further elucidate the coupling of electric fields with cell physiology.
000 cells. To perform this screen, we took advantage of the multiplexing capabilities of the microsystem and its compatibility with quantitative fluorescence microscopy to screen across field strength, frequency and application duration. The information from this screen has been consolidated into maps of physiological state that are able to better inform the design of electrical manipulation systems and further elucidate the coupling of electric fields with cell physiology.
Results
Stress-reporting cell sensor
The ideal sensor for investigating the effects of microsystems on cells would have single-cell resolution, a quantitative readout, and be straightforward to visualize with minimal downstream processing. This led us to transcriptional reporters, which provide facile assessment of whole-cell fluorescence, report on a cell-by-cell basis, and are amenable to assays with limited numbers of cells.Electric fields in the conductive media can induce appreciable temperature rises and generate a stressful environment around cells by electrically loading the plasma membrane and generating reactive species. To capture the effects of diverse classes of stresses, we constructed a transcriptional reporter based on the heat-shock response of the cell. The heat-shock—or more generally the stress response—pathway of the cell is associated with cell survival during adverse physiological conditions.18 The stress response pathway is mediated by the transcription factor HSF1 and chaperone protein HSP70.19HSP70 is responsible for maintaining protein homeostasis and assists in the folding of misfolded proteins. Importantly, the HSF1-mediated upregulation of stress response genes is a hallmark of the stress response.20 This pathway is especially relevant for our needs in that it is capable of sensing multiple stressful conditions including heat, radiation and radical damage, and is highly conserved across organisms, enabling generalization across cell lines.
We engineered a mouse fibroblast-based reporter cell line by co-transfecting NIH3T3 cells with a constitutive DsRed-expressing plasmid and a plasmid containing HSF1-regulated EGFP. The constitutive DsRed expression allows identification of all cells in the sample, while the EGFP reports on stress activation. Imaging before and after activation shows activation of the reporter following exposure to the chemical stressor sodium arsenite (Fig. 1A), and flow cytometry showed upregulation of EGFP ∼ 50× (Fig. S1†). Upon knockdown of Hsf1 with short-hairpin interfering RNAs, reporter expression was abrogated, indicating that the reporter responds directly to Hsf1-mediated transcription (Fig. S2†).
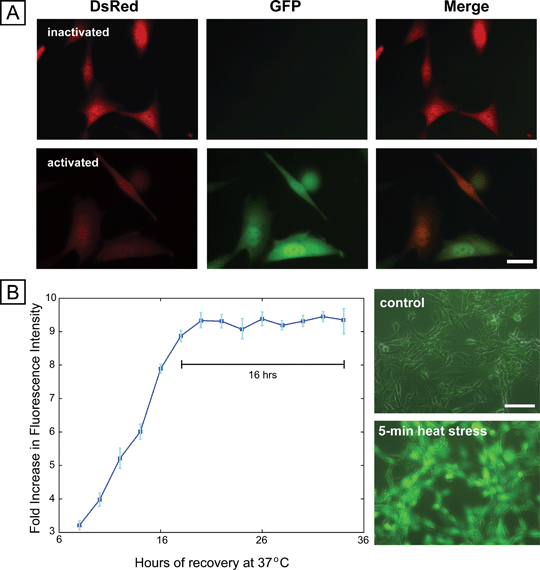 | ||
| Fig. 1 Cell -based stress sensor. (A) Fluorescence microscopy images of cells before and after stress activation using sodium arsenite, showing constitutive expression of DsRed and inducible expression of EGFP. Scale bar 25 μm. (B) Dynamics of expression of sensor after removal of sodium arsenite stressor, showing stable EGFP expression for 16 h (left panel). Right panel shows the response of the sensor to short duration (5 min) heat stress, with robust expression of EGFP. | ||
To enable exploration of a large parameter space, we developed a microsystem capable of exposing cells to 16 individual stimulation conditions with local temperature sensors while permitting imaging through a transparent indium tin oxide substrate (Fig. 2). We used automated imaging (Fig. S3, S4†) to quantify the response of these transcriptional reporters. We created a thresholding mask from constitutive DsRed expression to identify single cells using a series of heuristics. Average reporter EGFP fluorescence intensity from each masked cell was normalized to the on-chip negative controls, enabling extraction of quantitative information from single stress-reporter cells and providing a route to multiplexed, multi-parameter experiments.
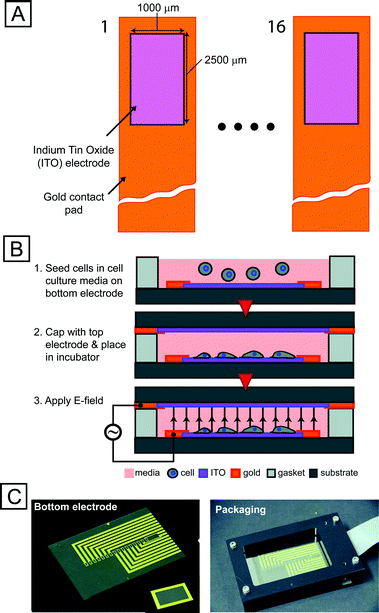 | ||
| Fig. 2 Integrated microfabricated platform. (A) Schematic (not to scale) of top-view of an array of 16 electrode sites. Transparent conductor (ITO) allows for imaging cells using conventional fluorescence microscopy. (B) Technique for seeding electrode sites with cells and preparing device for screen. (C) Images of electrode chip (left), top electrode (inset) and packaging setup (right). | ||
Because the stress-reporting cell line reports on HSF1 transcriptional activity, it does not provide an immediate response to stress. The dynamics of activation indicate a steady increase 8 h after stress application and then a stable period of expression at 8–16 h after stress (Fig. 1B). This period of stable expression enables the readout of a number of exposures at the same time, and, provided readout is performed at this time of peak stable expression, comparisons can be made across exposure conditions. Importantly, the stress-reporter responds to stressful conditions of durations as short as 5 min. (Fig. 1B), which was the shortest time tested. This fast sensitivity is particularly relevant to the study of electric-field-based manipulation techniques, which often expose cells to electric fields for short durations.5,13,21 Finally, the stress response was repeatable (4.2% deviation) across subsequent passages, demonstrating stability over time (Fig. S5†). In all, these measurements demonstrate that the reporter cell line is a sensitive tool for the quantification of stress activation.
Stress across electric field intensity and duration
We first investigated stress activation across varying voltage (up to 15 V, corresponding to 1.2 × 10⁵ V m−1). Each assay had internal negative (0 V) and positive (15 V) controls on-chip to allow comparison between both stimulation sites and experiments. We observe that stress activation increases with increasing voltage (Fig. 3A), saturating above ∼9 V, likely due to negative feedback in the HSP70 pathway regulating expression.19,22 Similar trends were obtained with an MCF10A human mammary epithelial cell-based reporter (Fig. S6 and ESI text†).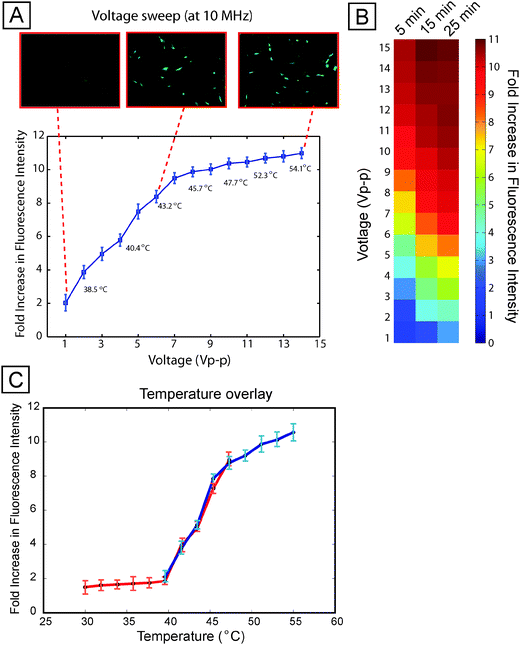 | ||
| Fig. 3 Voltage sweep. (A) Average per-cell fluorescence intensity (normalized to unexposed controls) across varying voltage, at 10 MHz and 15 min stimulation duration, showing that stress activation increases with applied voltage. Numbers in the plot correspond to measured temperatures in each chamber. Images show representative GFP fluorescence at low, medium, and high voltage. Error bars represent standard deviation across three independent experiments. A 1 V exposure corresponds to a field of 8 × 10³ V m−1. (B) A heat map showing a voltage sweep for different durations of field exposure. Longer durations of exposure show increased cellular stress levels. (C) Temperature overlay. Plots of temperature correlated to fluorescence intensity for voltage sweeps performed at 37 °C (blue line) and 30 °C (red line). Error bars represent standard deviation across three independent experiments. | ||
This trend of increasing stress with increasing voltage was observed across different durations of electric field application (Fig. 3B). Increasing duration tended to increase stress for a given applied voltage, resulting in a trade-off between applied electric field magnitude and duration, i.e. a 7 Vpp application for 5 min exhibited the same quantitative activation as 4 Vpp for 25 min.
Resistors placed at each stimulation site recorded the local temperature (Fig. S7†). As expected, increasing voltage resulted in increasing temperature rise due to Joule heating of the media. Given that heat shock assays are typically performed at 42–45 °C, it is not surprising that voltages ≥5 V—leading to temperature rises of ≥6.5 °C—result in significant reporter expression (p-value < 0.05). More interestingly, even modest voltages of 1–2 V, resulting in local temperatures of 37.8–38.9 °C, resulted in reporter activation 2–4× above background (p-value < 0.05), suggesting that even brief and modest temperature excursions can impact cell physiology.
To better understand whether temperature rises are the primary mechanism by which increasing voltage increases reporter activation, we performed a temperature-shift assay where we cooled the incubator down to 30 °C and performed the same voltage sweep experiment. If temperature is the key determinant of stress activation, then higher voltages would be necessary to induce activation in the cooled system. Indeed, when we plotted results from voltage sweeps at 30 °C and 37 °C with temperature as the independent variable, we observed similar responses (Fig. 3C), demonstrating that temperature rises are the predominant mechanism by which electric fields in our system activate stress.
Stress across electric field frequency
We next investigated how stress activation varied across frequency (Fig. 4A). The frequency sweep shows a slight increase (∼20%) in activation from 50 MHz down to 1 MHz, and then a steeper increase (∼25%) from 1 MHz down to 250 kHz (also observed with MCF10A-based reporter cell line, Fig. S6B and ESI text†). This general trend of relatively flat high-frequency response and a sharp increase at low frequencies repeated itself at different activation voltages (Fig. 4B). Joule heating is independent of frequency, supported by the constant temperatures measured at different frequencies (Fig. 4A). Electrode polarization can induce a frequency dependence to the electric field in the liquid, resulting in frequency-dependent heating, but electrode polarization would result in less heating at lower frequency, and impedance analysis showed constant impedance (<10% change in impedance across 0.1–10 MHz, see Fig. S8†).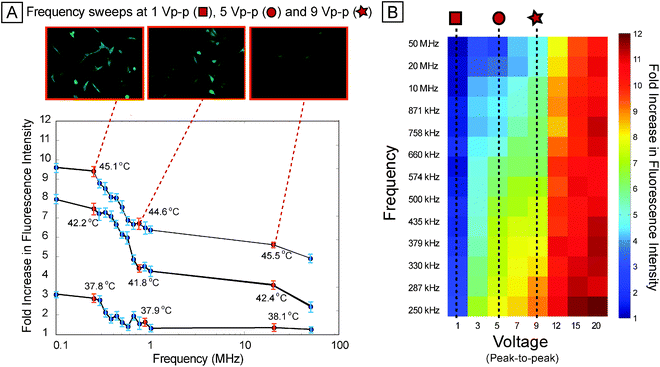 | ||
| Fig. 4 Frequency sweep. (A) Per-cell fluorescence intensity of reporter as frequency is swept, for 9 Vpp, 5 Vpp, and 1 Vpp (all at 15 min exposure duration), showing increased stress activation at low frequencies (less than ∼500 kHz) compared to higher frequencies (greater than ∼1 MHz). Top panel shows fluorescence images of representative scan points at 9 Vpp. (B) Heat map showing average per-cell fluorescence across 8 voltages (from 1 Vpp through 20 Vpp) and 13 frequencies (from 250 kHz to 50 MHz). Sweeps across frequency (at different voltages) show similar trends with increased stress at lower frequencies. | ||
Electric fields are known to generate reactive oxygen species at the electrode-electrolyte interface, which are generally known to stress cells.17 To investigate whether reactive oxygen species played a role in the observed variations of stress with frequency, we first tested for the presence of reactive oxygen species (ROS) in cell-free media exposed to electric fields. Results showed that ROS were indeed being generated in the media in a frequency dependent manner (Fig. 5A), with a significant increase (p-value < 0.05) in ROS below 1 MHz, consistent with the stress activation response observed in the reporter cells (Fig. 4A). When the oxygen scavenger catalase was added to the media, peroxidase activity decreased (Fig. 5A), confirming that oxygen radicals were the dominant reactive species. Adding catalase to our stress reporter cells greatly reduced the frequency-dependent increase in reporter activation, confirming the central role of ROS in the frequency-dependent stress activation (Fig. 5B). To further investigate the role of ROS in the stress response, we performed a ROS dose-response assay (Fig. 5C). Results indicate that the ROS dose response has an analogous trend to the voltage dependent response (Fig. 2A) where increasing stress results in increasing fluorescence signal. Moreover, this is consistent with the ability of the cell-based sensor to provide a graded (and quantifiable) response to various stressing factors.
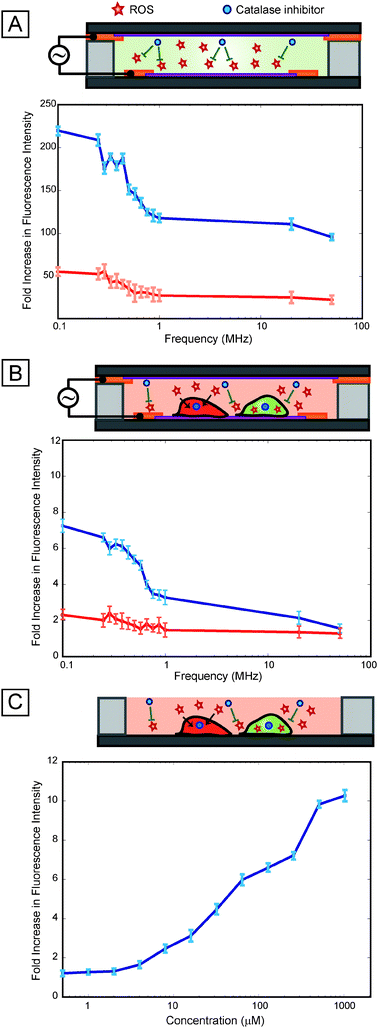 | ||
| Fig. 5 Role of ROS. (A) Cell-free assay performed at 4 Vpp using ROS-responsive dyes show increasing ROS activation at low frequencies (below 1 MHz) and relatively low ROS activation at higher frequencies (blue line). The addition of an oxygen scavenger, catalase (which catalyzes the reduction of hydrogen peroxide to water and oxygen) results in an ∼5× attenuation of activation (red line) suggesting that oxygen species are the most dominant radicals generated. (B) Results of frequency sweep (at 4 Vpp) with our cell-based sensor indicate that response to ROS is resulting in low frequency activation (blue line) as the trend is considerably attenuated with addition of catalase (red line) resulting in a near flat line response (solely due to heating effects). (C) Dose response of ROS (using tert-butyl hydroperoxide), indicating that the cell-based sensor has a similar graded response to chemical stressors as well as thermal stressors (as shown Fig. 3). | ||
Discussion
Every assay affects cell phenotype, from phototoxicity induced by conventional light microscopy23 to culture of cell monolayers on polystyrene.24 Thus, it is imperative to determine how any assay affects phenotype and use that information to design appropriate controls. As with other assays, microsystems that manipulate cells will also affect cell state. Although there are at least a few examples of molecular-level assays of the effects of microsystems on cellular physiology,25,26 such assays can prove extremely challenging due to the small numbers of cells typically processed and limited access to cells in microsystems. Although multi-step staining/labeling within microsystems is possible,27 it is rarely performed due to its complexity. The cell-based stress sensor described here provides a sensitive and compelling sensor for use in microsystems, enabling assays of phenotype at a molecular level without the need for reagent delivery or physical access to cells.While stress-reporting cell sensors have been previously described, they have been limited by the use of proprietary expression constructs,28 transient transfection techniques,29 or uncommon parental cell lineages.30 Additionally, these cell sensors have neither been used in a microsystem setting nor to assay physiological impact of cell manipulation. In contrast our cell line is based on readily-available plasmid constructs and has been well characterized enabling its adoption by both the microsystems design and end-user communities. This cell line forms both the crux of our integrated microsystem platform for performing physiological screens and a powerful generalizable tool for studying cell–microsystem interactions.
The results obtained using the electric-field-based microsystem provide insight in to the interactions of kilohertz–megahertz electric fields with cells. Voltage is seen as the main contributor to stress activation, primarily through heating of the media. Even moderate temperature excursions of ∼2 °C above physiological result in significant stress activation. This implies that electric-field-based microsystems or other microsystems that induce temperature rises, for example optical heating31 and acoustic fields32 should stay at or below 37 °C to avoid stress activation. The trends of stress across frequency point to the importance of reactive-oxygen species in electric-field-based microsystems. Because most electrical cell manipulation occurs in the 100 kHz range or higher frequencies, where ROS are less-likely to be generated, the stress activation at low frequencies can be avoided. Alternatively, adding oxygen scavengers to the media can permit operation at lower frequencies. Importantly, the response to reactive oxygen species points to the ability of our cell-based sensor to respond to and integrate physiochemical stressors in the microenvironment, providing an accurate map of physiological conditions within microsystems. Moreover, this additional dose-dependent response to highly reactive species, along with chemicals and heat suggest the broad applicability of our cell-based sensor to a variety of microsystems and microenvironments.
Our observed temperature-duration tradeoff suggests that larger temperature excursions can be better tolerated if they are applied for short durations. For electric fields that manipulate cells using dielectrophoresis, where the force scales with V2 and the distance traveled by a cell is linear in time (assuming Stokes drag), the lower voltage for longer durations is preferred. For instance, assuming the distance traveled dep ∼ V2t, and 7 V for 5 min provides similar stress as 4 V for 25 min (Fig. 3B), the latter condition will result in ∼2× longer cell travel. The mechanism for the observed tradeoff between voltage (or temperature) and duration in terms of stress activation is at present unclear, but this tradeoff has been observed using both heat and chemical stress.33 The question remains as to whether the observed strength-duration relationship holds for even shorter duration exposures, which could be investigated using this system, as it can effect temperature rises on the time scale of seconds.
Heat stress damages a variety of cellular structures and metabolic processes34 where both the magnitude and duration of the stress determine the amount of damage.35 The magnitude of heat stress is typically categorized as mild (38–40 °C), moderate (41–44 °C) and severe (45 °C and above) with significant reduction in protein translation at temperatures above 45 °C.35 Based on our temperature and duration experiments, a ∼10× increase in fluorescence is observed at temperatures higher than 45 °C, with significant differences with ∼6× increase in fluorescence at moderate shock (p-value, 0.05) and ∼4× increase in fluorescence at mild shocks (p-value, 0.05). This indicates a 9× (or greater) increase in fluorescence in our cell-based sensor as a point beyond which users should be concerned that cell stress can significantly affect biological findings and a 3× (or lesser) increase in fluorescence as an acceptable level of stress. Increases in fluorescence between 3–9× would constitute significant stress levels and have to be considered as such, with users verifying that their biological findings are not significantly perturbed by their respective manipulation techniques. Therefore, a 3× (or lesser) increase in fluorescence would be an important figure of merit for the use of our cell-based sensor in a given microsystems-based assay.
Full applicability of the system described here requires the ability to port the method to different microsystems, cells, and stresses. The cell-based sensor and imaging approach have been explicitly developed to be easily transferrable to other microsystems, the primary requirement being that the microsystem must either be transparent (to allow for imaging) or the cells must be able to be retrieved from the microsystem (to allow imaging off-chip). Transferring the sensor into other cells requires those cells to be able to be easily molecularly manipulated and cloned, essentially eliminating the ability to use this approach with primary cells. For cell lines, one would desire cells that grow as monolayers to ease imaging. Cells that either require high density or grow as epithelial sheets would require more sophisticated (but readily available) cell segmentation algorithms. Alternatively, one could perform analyses at the single colony level rather than the single cell level. In either case, it would be important to seed the cells at a density low enough to prevent significant screening of the electric field. We also note that since the stress response is strongly conserved across organisms, understanding how a system stresses one particular cell type would be informative of how that system affects other cell types. Finally, extending the system to be responsive to other stresses requires identification of how those stresses affect transcriptional responses.
Taken together, the results obtained with our integrated platform present a significant advancement in the understanding of microsystem effects on cell physiology, providing a map for optimal operation regimes when using such technological platforms. Indeed, one could generalize the cell-based sensor to a suite of cell-based sensors with complementary specificity, providing significant insight into the effects of microsystems on cellular state and function.
Conclusions
We have demonstrated a sensitive, microscale platform that integrates a cell-based sensor for studying the impact of microsystems on cellular physiology. We have characterized the response of this cell-based sensor across a diverse range of electric-field conditions using the multiplexed microsystem platform. The results of our screen indicate that minimizing stress activation due to electric fields can be accomplished by avoiding hyperthermic temperatures and using high frequencies to avoid generation of reactive-oxygen species. The results obtained with these physiological screens enable the generation of complex maps of cellular behavior in externally applied electric fields.Materials and methods
Cell culture
We cultured NIH3T3 cells (obtained from ATCC) cultured in DMEM supplemented with 10% (v/v) bovine calf serum, 1% (v/v) L-glutamine, and 2% (v/v) penicillin-streptomycin.Cell-based stress sensor
Plasmids pDsRed.T436 and pY9 (based on the pHOT-MCS)37 were provided courtesy of the Lindquist Lab. We co-transfected NIH3T3 cells with a mixture of both plasmids using Fugene 6 (Roche Diagnostics GmbH), placed them under selection for 2 weeks with 1 mg ml−1 genetecin (G418, Invitrogen), sorted them using FACS (top 25% in DsRed expression), and finally isolated single-cell clones using limiting dilution cloning in 96-well plates. After defining wells containing single clones, we performed a cellular stress assay (using 100 μg ml−1arsenite) to discern the level of reporter expression. We used automated microscopy to determine the three highest expressing clones (and further expanded them).Cellular stress assays
We performed cellular stress assays using the chemical stressor sodium (meta)arsenite at 100–250 μg ml−1 in cell-culture media for 30 min (at 37 °C) and then aspirated the media, following it with 2× PBS washes to ensure trace stressors were removed. We then performed cellular assays 12–14 h after incubation at 37 °C.Microfabrication & packaging
We fabricated devices from indium tin oxide (ITO) coated glass slides (resistivity of 5–8 Ω/□, SPI Supplies, Inc.). We first patterned the ITO-coated slides and etched them in dilute (1:1) hydrochloric acid (20 min), and then patterned 10 nm/100 nm Ti/Au electrodesvia liftoff. We fabricated top electrode slides without the ITO etching step (because of the large feature sizes). We fabricated silicone spacers (125-μm thick) using a laser-cutting process. The fabricated devices were then clamped between plastic frames (Fig. 2C) and electrically connected to a flex cable (ERCDA, Samtec Corp.) via push-pin connectors (0908, Mill Max Corp.) and printed-circuit boards. We then assembled the device and package aseptically, pipetted 150 μl of cell solution (at 104cells ml−1) into each well, and then capped the wells with the top electrode. After assembly, we placed the device in an incubator and connected it to the stimulation system.
Electrical stimulation
We performed electrical stimulation via a switchbox consisting of reed relays (PRMA1A05B, Digikey Corporation) on a custom-designed printed circuit board for routing the stimulation signals (generated via waveform generator, Agilent Technologies) to the appropriate electrode sites (Fig. S9†). We autonomously controlled the entire system by software that determines when each site is stimulated and the particular stimulation parameters for that site.Automated microscopy and imaging
To perform microscopy we removed the package from the incubator and placed it on an automated microscope (AxioImager, Carl Zeiss), aligned the device and camera axes, and then scanned the device without further manual intervention. We collected images using differential interference contrast, green fluorescence (EGFP, Set 38, Carl Zeiss) and red fluorescence (DsRed, 31000 and 31002, Chroma Technology) at each scan point using an ImagerQE camera (LaVision) with 12-bit resolution. To perform quantitative single-cell imaging of the reporter cells, we thresholded the DsRed-image and applied a series of heuristics to identify single cells. We then multiplied the EGFP-image with the masked image to correctly identify the cells in the image (Fig. S3, S4†), normalized the identified cells to cell area, and finally normalized to the average of on-chip negative controls. To facilitate quantitative comparisons we ensured that all images were recorded with identical acquisition parameters (exposure time, camera gain/gamma control and microscope aperture settings). Control assays indicated that insignificant cell loss occurred from to cell death due to exposure, and that cells proliferated following field exposure (Fig. S11†).Statistics
We performed statistical T-tests in MATLAB using the Statistics Toolbox and obtained p-values for significance directly from MATLAB. In general, experiments were performed in triplicate, with the results for each data point representing ∼100 cells per experiment per condition (∼300 cells total/condition), with the error bars representing one standard deviation. For the three replicates for any condition, typically the same chip was used (after ultrasonic cleaning and autoclaving) and the cells were within 1–2 passages of each other (i.e. the first and third replicate varied by at most two passages).Reactive oxygen species (ROS) assays
To perform cell-free assays we added 100 μM 10-acetyl-3,7-dihydroxyphenoxazine (Amplex Red, A22188, Invitrogen) in each well of the platform, stimulated electrically, and performed quantitative microscopy (as described in the previous sub-section). Where indicated, we dissolved 100 μg ml−1 of catalase (C1345, Sigma-Aldrich) in Amplex Red solution prior to loading the solution in to the wells. To perform a dose response of ROS, we plated stress-reporting cells in glass bottom 96-well plates (P96G-1.5-5-F, MatTek Corporation) and adjusted the concentration of tert-butyl hydroperoxide (TBHP, Invitrogen) from 500 nM to 1 mM. The cells were left in TBHP-spiked media for 30 min (the stressing media was then removed), the cells were washed 3× in PBS, replenished with standard cell culture media and allowed to recover for 16 h. Image acquisition was performed on an automated inverted microscope (Axiovert 200M, Carl Zeiss) using an ImagerQE camera and fluorescence filter sets. Image analysis was performed as described in the previous sub-section.Additional methods information is provided in the ESI.†
Acknowledgements
We thank Sandro Santagata and Simon Alberti for providing plasmids, Luke Whitesell for assistance with molecular biology assays, and Brooke Bevis, Bruce Bean, David Clapham and Frank McKeon for helpful discussions. We thank the Microsystems Technology Laboratories for assistance with microfabrication. This work was supported by NIH grants RR199652 and EB005753.References
- D. Di Carlo, L. Y. Wu and L. P. Lee, Lab Chip, 2006, 6, 1445 RSC.
- W. Gu, X. Zhu, N. Futai, B. S. Cho and S. Takayama, Proc. Natl. Acad. Sci. U. S. A., 2004, 101(45), 15861 CrossRef CAS.
- T. P. Burg, M. M. Godin, S. M. Knudsen, W. Shen, G. Carlson, J. S. Foster, K. Babcock and S. R. Manalis, Nature, 2007, 446, 1066 CrossRef CAS.
- J. L. Tan, J. Tien, D. M. Pirone, D. S. Gray, K. Bhadriraju and C. Chen, Proc. Natl. Acad. Sci. U. S. A., 2003, 100(4), 1484 CrossRef CAS.
- M. D. Vahey and J. Voldman, Anal. Chem., 2008, 80(9), 3135 CrossRef CAS.
- D. R. Albrecht, G. H. Underhill, T. B. Wassermann, R. L. Sah and S. N. Bhatia, Nat. Methods, 2006, 3(5), 369 CrossRef CAS.
- M. Chabert and J.-L. Viovy, Proc. Natl. Acad. Sci. U. S. A., 2008, 105(9), 3191 CrossRef CAS.
- T. H. Rider, M. S. Petrovick, F. E. Nargi, J. D. Harper, E. D. Schwoebel, R. H. Mathews, D. J. Blanchard, L. T. Bortolin, A. M. Young, J. Chen and M. A. Hollis, Science, 2003, 301(5630), 213 CrossRef CAS.
- R. C. Onderwater, J. N. Commandeur and N. P. Vermeulen, Toxicology, 2004, 197(2), 80 CrossRef.
- Z. E. Perlman, M. D. Slack, Y. Feng, T. J. Mitchison, L. F. Wu and S. J. Altschuler, Science, 2004, 306(5699), 1194 CrossRef CAS.
- J. Suehiro and R. Pethig, J. Phys. D: Appl. Phys., 1998, 31(22), 3298 CrossRef CAS.
- B. M. Taff and J. Voldman, Anal. Chem., 2005, 77, 7976 CrossRef CAS.
- T. Matsue, N. Matsumoto and I. Uchida, Electrochim. Acta, 1997, 42(20–22), 3251 CrossRef CAS.
- P. R. C. Gascoyne, X.-B. Wang, Y. Huang and F. F. Becker, IEEE Trans. Ind. Appl., 1997, 33(3), 670 CrossRef.
- G. Fuhr, H. Glasser, T. Muller and T. Schnelle, Biochim. Biophys. Acta, Gen. Subj., 1994, 1201, 353 CrossRef CAS.
- H. Glasser and G. Fuhr, Bioelectrochem. Bioenerg., 1998, 47, 301 CrossRef CAS.
- X. J. Wang, J. Yang and P. R. C. Gascoyne, Biochim. Biophys. Acta, Gen. Subj., 1999, 1426(1), 53 CrossRef CAS.
- S. Lindquist, Annu. Rev. Biochem., 1986, 55, 1151 CrossRef CAS.
- K. Abravaya, M. P. Myers, S. P. Murphy and R. I. Morimoto, Genes Dev., 1992, 6, 1153 CrossRef CAS.
- R. I. Morimoto, Science, 1993, 259, 1409 CrossRef CAS.
- D. R. Albrecht, G. H. Underhill, T. B. Wassermann, R. L. Sah and S. N. Bhatia, Nat. Methods, 2006, 3(5), 369 CrossRef CAS.
- K. Abravaya, B. Phillips and R. I. Morimoto, Genes Dev., 1991, 5, 2117 CrossRef CAS.
- S. L. Shaw, E. Yeh, K. Bloom and E. D. Salmon, Curr. Biol., 1997, 7, 701 CrossRef CAS.
- J. A and K. M. Yamada Green, Adv. Drug Delivery Rev., 2007, 59, 1293 CrossRef.
- A. L and D. J. Beebe Paguirigan, Integr. Biol., 2009, 1, 182 RSC.
- J. El-Ali, S. Gaudet, A. Gunther, P. K. Sorger and K. F. Jensen, Anal. Chem., 2005, 77(11), 3629 CrossRef CAS.
- A. Khademhosseini, J. Yeh, S. Jon, G. Eng, K. Y. Suh, J. A. Burdick and R. Langer, Lab Chip, 2004, 4, 425 RSC.
- S. Mitra, E. M. Goren, J. G. Frelinger and T. H. Foster, Photochem. Photobiol., 2003, 78(6), 615 CrossRef CAS.
- X.-C. Zeng, S. Bhasin, X. Wu, J.-G. Lee, S. Maffi, C. J. Nichols, K. J. Lee, J. P. Taylor, L. E. Greene and E. Eisenberg, J. Cell Sci., 2004, 117(21), 4991 CrossRef CAS.
- A. Molina, R. Carpeaux, J. A. Martial and M. Muller, Toxicol. in Vitro, 2002, 16, 201 CrossRef CAS.
- Y. Liu, D. Cheng, G. Sonek, M. Berns, C. Chapman and B. Tromberg, Biophys. J., 1995, 68(5), 2137 CrossRef CAS.
- J. Wu, J. Acoust. Soc. Am., 1991, 89, 2140 CrossRef CAS.
- M. E. Feder and G. E. Hoffman, Annu. Rev. Physiol., 1999, 61, 243 CrossRef CAS.
- A. Laszlo, Cell Proliferation, 1992, 25, 59 CrossRef CAS.
- D. A. Parsell and S. L. Lindquist, in The Biology of Heat Shock Proteins and Molecular Chaperones, ed. R. I. Morimoto, A. Tissieres and C. Georgopoulos, Cold Spring Habor Press, 1994, pp. 457 Search PubMed.
- B. J. Bevis and B. S. Glick, Nat. Biotechnol., 2002, 20(1), 83 CrossRef CAS.
- F. H. Vasanawala, T. Tsang, A. Fellah, P. Yorgin and D. T. Harris, Gene Ther. Mol. Biol., 2000, 5, 1 Search PubMed.
Footnote |
| † Electronic supplementary information (ESI) available: Supporting results, materials and methods, Fig. S1–S11. See DOI: 10.1039/c0ib00067a |
| This journal is © The Royal Society of Chemistry 2011 |