Sedimentation and depletion attraction directing glass and liquid crystal formation in aqueous platelet/sphere mixtures
Dzina
Kleshchanok
*a,
Janne-Mieke
Meijer
a,
Andrei V.
Petukhov
a,
Giuseppe
Portale
b and
Henk N. W.
Lekkerkerker
a
aVan 't Hoff Laboratory, Debye Institute for Nanomaterials Science, Utrecht University, The Netherlands. E-mail: D.Kleshchanok@uu.nl
bDutch Organization for Scientific Research (NWO), DUBBLE-CRG, European Synchrotron Radiation Facility (ESRF), France
First published on 4th November 2011
Abstract
We present an experimental study on mixtures of the gibbsite platelets and silica nanospheres of the same charge sign. In these mixtures the spheres act as depletants changing the phase behaviour of the platelet system, for which two very different time scales can be distinguished. At short times as a result of a strong depletion attraction in the system a kinetically arrested phase was split off. Subsequently, on a time scale of months the top phase separated in an isotropic and a columnar phase on top of the arrested phase. We rationalize this gravity induced liquid crystal formation in terms of a platelet sedimentation and a strong depletion attraction. The sedimentation driven columnar phase is highly ordered as we show by microradian X-ray diffraction experiments.
I. Introduction
Today the phase behaviour of platelets is well established by experiments,1 simulations2 and theory.3Platelet suspensions show formation of nematic and columnar liquid crystalline phases. By adding a depletion agent the phase behaviour of platelets can be enriched with liquid crystalline phases appearing at lower platelet concentrations4,5 even though no new phase is induced. In conjunction with gravity multiphase coexistence was found in mixtures of platelets and polymeric depletants experimentally.5,6 The theory for sedimenting platelets experiencing depletion attraction predicts these surprising multiphase coexistences over a large concentration range of platelets.7 Gravity, amplified by centrifugation or simply reflected in sedimentation, can be experimentally employed to obtain the liquid crystalline nematic8–10 and columnar8,11 phases in originally isotropic platelet suspensions. Furthermore, sedimentation is often used as a method to grow colloidal crystals of good quality.11–14 Gravity in a competition with phase transition may lead to unexpected phenomena in colloidal suspensions, such as to smaller spheres settling faster than large ones.15Here we explore the role of gravity in a system of colloidal platelets with a strong depletion attraction. We use gibbsite platelets and silica nanospheres of the same charge sign, which induce a strong depletion attraction. Previously, we reported on the formation of a kinetically arrested state in this system on a short time scale.16 The system was unable to access the equilibrium liquid crystalline phases and an attractive glass was formed instead. This paper is dedicated to the long time scale behaviour of the gibbsite/silica mixtures. Over a period of months due to the gravity gibbsite platelets phase separate into an isotropic and a columnar phase on top of the arrested phase. Due to the interplay between the sedimentation and a strong depletion attraction the gibbsite/silica system evolves towards its final state in a highly nontrivial way. Nevertheless, this behaviour can be rationalized theoretically due to the significant difference in the time scales of the glass and liquid crystal formation. Interestingly, while the pure gibbsite suspensions are able to build both a nematic and a columnar phase, the nematic phase is skipped in the gibbsite/sphere mixtures. The sedimentation driven columnar phase possesses a very long positional order and contains large crystal domains, whose sizes depend on the depletants concentration in the system.
In this paper we first discuss the phase behaviour of the pure and attractive gibbsite suspensions on the time scale of platelet sedimentation. It is followed by a detailed study of the liquid crystalline columnar phase using microradian X-ray diffraction measurements. At the end, we present a schematic phase diagram of the gibbsite/silica mixtures on long time scales and discuss the role of the depletion attraction and the platelet sedimentation on the liquid crystal formation in the system.
II. Materials and methods
Experimental system
The synthesis of colloidal gibbsite platelets used in this study has been described in detail elsewhere.16 To induce depletion attraction between the platelets silica Ludox CL spheres were added. The surface of Ludox CL is coated by the manufacturer (Sigma-Aldrich Co) with aluminium oxide, which converts the charge of the particles from negative to positive. As a result the surfaces of gibbsite platelets and silica spheres have the same charge sign. Both the gibbsite platelets and silica spheres are stable in aqueous solutions due to the electrostatic repulsion between them. All particles are suspended in a 10−4 M NaCl solution.The average particle diameter, 〈D〉, and the standard deviation, σ, were determined from transmission electron microscopy images. Atomic force microscopy was used to obtain the thickness of the gibbsite platelets, 〈L〉. The particle's characteristics are listed in Table 1.
| 〈D〉/nm | σD /nm | 〈L〉/nm | σL /nm | ||
|---|---|---|---|---|---|
| Gibbsite | 232.5 | 34.0 | 8.4 | 2.8 | L/D = 0.04 |
| Silica | 16.8 | 1.7 | — | — | D gibbsite/Dsilica = 13.8 |
The gravitational length of colloids can be calculated as Lg = kBT/mg, where kBT is the thermal energy, m is the buoyant mass, and g is the gravitational acceleration. For the gibbsite platelets used in this study Lg is 1.0 mm. The filling height of the test tubes was always at least 50 Lg. Theoretical calculations7 show that sedimentation enables platelets to scan a large density range within the vessel height of above 10 Lg. Thus, in our study we expect a significant influence of platelet sedimentation on the experimental phase diagram. The gravitational length of the silica spheres is much larger than that of the platelets and the height of the vessels, Lg = 9.4 m. Therefore, we can assume that the silica spheres in our study do not sediment.
Sample preparation
Samples were prepared by mixing the stock suspensions of gibbsite and silica with solvent such that the desired colloid concentrations were obtained. Two series of mixed gibbsite/silica suspensions were made with constant volume percent of gibbsite (4 and 8 vol%), and a varying amount of silica, ϕsilica, from 2 to 8 vol%. Additionally a series of pure gibbsite suspensions were prepared with a varied platelet concentration, from 4 to 14 vol%.As already mentioned silica spheres were added to the gibbsite suspensions to cause depletion attraction:
 | (1) |
At silica concentrations used in this study a strong depletion attraction between the platelets with contact values varying between 5.2 and 19.0 kBT is induced.
For visual observations the mixtures were put into flat glass capillaries (1.0 × 10.0 mm cross-section, Vitrotubes, VitroCom Inc.) that were flame sealed. Suspensions for microradian X-ray diffraction (μradXRD) experiments were placed into round Mark tubes (2 mm diameter, 10 μm wall thickness, W. Müller, Berlin). All samples were stored vertically at 20 °C. The samples liquid crystallinity was checked with crossed polarisers. Here the isotropic phase appears black, while nematic and columnar phases show birefringence. The columnar phase will additionally show colourful Bragg reflections under white light illumination. Additional microradian X-ray diffraction experiments (μradXRD) provided the symmetries, lattice constants, and domain sizes of the liquid crystalline phases.
Microradian X-ray diffraction
X-Ray scattering experiments were performed at the European Synchrotron Radiation Facility (ESRF) in Grenoble, France, at the Dutch–Belgian beam line BM-26.16 A μradXRD setup was used and described in detail elsewhere.4,17 This setup provided a range of scattering vector, q, values of 0.011 nm−1 ≤ q ≤ 0.370 nm−1. The modulus of the scattering vector is determined by the scattering angle 2θ as q = 4π sin θ/λ.The hexagonal lattice spacing of the columnar phase, aD, was obtained by plotting qhkl values of the Bragg peaks vs. . The aD spacing was determined from the slope, γ, of this straight line using the following equation:
 | (2) |
The face-to-face aL lattice spacings in the columnar phase were calculated from the q001 values as
| aL = 2π/q(001) | (3) |
Crystal domain sizes, t, were calculated using the Debye–Scherrer equation:18
 | (4) |
III. Experimental results
Liquid crystal formation in suspensions of pure platelets
On short time scales, when the sedimentation does not play a dominant role, the pure gibbsite suspensions were found to be isotropic (I) up to 11 vol% of platelets. Upon increasing the amount of platelets, we observed an isotropic/nematic (I/N) phase coexistence, then a nematic (N) phase followed by a nematic/columnar (N/C) phase coexistence. The observed phase behaviour of pure gibbsite suspensions complies well with the previous experimentally studied gibbsite system19 and is in accordance with theory.3The phase behaviour of these suspensions is strongly affected by sedimentation. One year after the sample preparation all samples showed the I/N/C phase coexistence (Fig. 1). In originally isotropic suspensions sedimentation led to an increased platelet concentration at the bottom of the capillaries and resulted in the formation of nematic and columnar phases. In samples originally showing liquid crystals the nematic phase at the top became depleted of platelets such that an isotropic phase developed. Table 2 summarizes the phases found in all samples after a day and a year of equilibration.
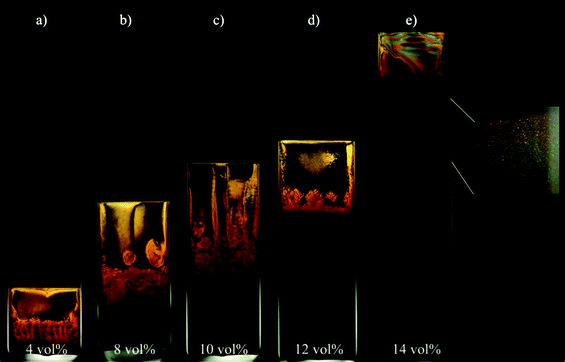 | ||
| Fig. 1 Aqueous gibbsite suspensions observed between crossed polarisers. Pictures were taken one year after the sample preparation. Concentrations of gibbsite are listed at the lower end of the picture. All samples show the I/N/C phase coexistence. Inset of (e) shows an example of the Bragg reflections in white light illumination indicating the presence of the columnar phase. | ||
| Period of equilibration | Gibbsite 4 vol% | Gibbsite 8 vol% | Gibbsite 10 vol% | Gibbsite 12 vol% | Gibbsite 14 vol% |
|---|---|---|---|---|---|
| 1 Day | I | I | I | N | N/C |
| 1 Year | I/N/C | I/N/C | I/N/C | I/N/C | I/N/C |
The presence of the three phase coexistence (I/N/C) can be theoretically explained by taking into account gravity and hence sedimentation of platelets, leading to a density gradient in a capillary of sufficient height.7
Arrest and liquid crystal formation in platelet/sphere mixtures
Spherical silica depletants were added to the initially isotropic gibbsite suspensions (4 and 8 vol%) in order to manipulate their phase behaviour. As a result, on very short time scales (<1 hour) an arrested state formed in the mixed samples at the bottom of the capillaries and coexisted with an isotropic phase above. The top phase of all samples did not show birefringence between crossed polarisers, which indicated its isotropic structure. It is important to notice that the isotropic phase in suspensions with >7 vol% of silica appeared totally transparent after the arrested state formation, indicating a complete absence of gibbsite platelets there.In a previous publication we identified the nature of the arrested state in these mixed suspensions as being a glass.16 It had formed due to the short-ranged and very strong (up to 19 kBT) depletion attraction induced by the silica spheres. With an increasing silica concentration the time needed for a sample to form the glass decreased from an hour to only minutes for the samples with the highest sphere concentrations. Thus, the mixed samples did simply not have enough time to form an equilibrium liquid-crystalline phase and became arrested at the glass transition line.
On a time scale of months sedimentation of gibbsite platelets played a significant role in the phase behaviour of mixed platelet/sphere suspensions. One month after the sample preparation a columnar phase has formed on top of the glass phase in samples with low sphere concentrations, <7 vol% silica. As evident from the Bragg colours seen in the samples under white light illumination (Fig. 2a–c and f–h), no nematic phase in any of the samples is observed between crossed polarisers. The amount of the columnar phase in the suspensions decreased with increasing sphere concentration for a constant concentration of gibbsite, as shown in Fig. 3 for the 4 and 8 vol% gibbsite suspensions. It has to be noted that the concentration of platelets in the isotropic phase has decreased due to the splitting off of the kinetically arrested phase, where platelets are irreversibly stuck. The higher is the concentration of spheres, the lower is the amount of the columnar phase. In the samples with the largest silica concentrations (>7 vol%) a columnar phase is not formed even a year after the sample preparation due to the fact that there are no platelets left over after a splitting off of the arrested state (Fig. 2d, e, i and j).
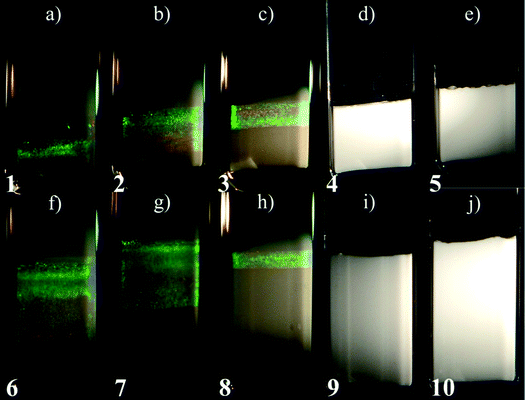 | ||
| Fig. 2 Mixed gibbsite/silica suspensions observed in white light illumination one year after the sample preparation with, from (a) to (e), 4 vol% of gibbsite and 2, 3, 5, 7, and 8 vol% of silica spheres; from (f) to (j), 8 vol% of gibbsite and 2, 3, 5, 7, and 8 vol% of silica spheres. White turbid layer at the bottom of the capillaries is the glass phase formed within one hour after the sample preparation. The columnar phase on top of it slowly formed during the next month and is identified by pronounced Bragg reflections in (a)–(c) and (f)–(h). Numbers at the bottom of the capillaries label the sample positions in the experimental phase diagram (Fig. 7a). Photographs of the mixtures were taken under different exposure times to bring out the iridescent colours of the columnar phase. | ||
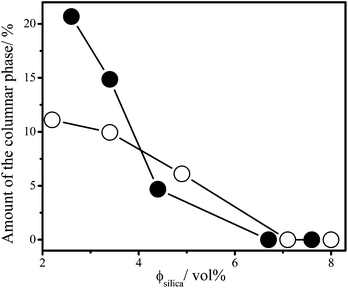 | ||
| Fig. 3 Amount of the columnar phase on top of the arrested phase layer in mixtures of gibbsite platelets and silica spheres as a function of the silica concentration in mixed samples with 4 vol% (open circles) and 8 vol% (filled circles) of gibbsite one year after the sample preparation. Lines are guides for the eyes. | ||
Characteristics of the columnar phase formed due to the sedimentation
Here we in detail characterize the columnar phase formed due to platelet sedimentation in mixed platelet/sphere suspensions. We used μradXRD measurements to obtain quantitative information about the lattice space parameters and the domain sizes.Fig. 4a shows a typical 2D μradXRD scattering pattern obtained from the columnar phase in sample 7, which contains 8 vol% of gibbsite and 3 vol% of silica (Fig. 2g). A corresponding average scattering intensity profile is plotted in Fig. 4b, in which five sharp peaks can be seen. The scattering data are indexed as shown in the inset of Fig. 4b. The straight fit line passing through the origin indicates the hexagonal structure of the phase,20,21 which is built up by stacks of gibbsite platelets and the aD spacing was determined to be 266.6 nm. The average intracolumnar spacing, aL, revealing face-to-face positional correlations between platelets in columns, was calculated according to eqn (3) and equals 29.3 nm. Both of these values are more than 10% larger than those from the glass layer in the same sample,16 where platelets are so tightly pushed together that they almost touch each other with their sides. Clearly the columnar phase is less compressed.
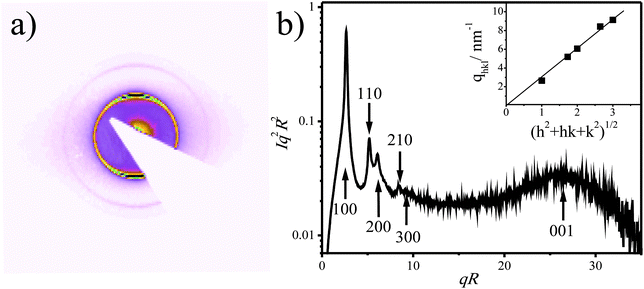 | ||
Fig. 4 The 2D μradXRD scattering pattern (a) and the average intensity profile (b) obtained from the columnar phase of sample 7. The inset in (b) depicts the q vectors of the Bragg reflections vs. . The straight line indicates a very good fit of the scattering reflections to the hexagonal structure. . The straight line indicates a very good fit of the scattering reflections to the hexagonal structure. | ||
Fig. 5a shows that the values of the aD hexagonal spacing increase from the bottom to the top of the columnar phase. This increase becomes less pronounced in samples with a rising sphere concentration. Furthermore, the value of the aD spacing decreases with an increasing amount of spheres. Both these facts indicate a more compressed columnar phase in samples with higher sphere concentration. On the other hand, the aL spacings do not change through the length of the columnar phase (Fig. 5b). It shows that this liquid crystalline phase is compressed more along the vertical axis than the horizontal, and complies well with the previous studies on crystals build-up by sedimenting colloidal spheres.22
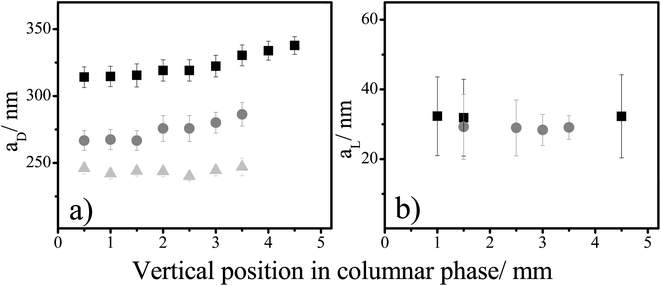 | ||
| Fig. 5 The side-to-side, aD, and the face-to-face, aL, correlation distances vs. a vertical position in the columnar phase for suspensions with 8 vol% of gibbsite and varied silica concentrations. Squares, circles, and triangles are the spacings of samples 6, 7, and 8 (Fig. 2), with an increasing silica concentration in them. | ||
Using the Debye–Scherrer equation (eqn (4)) we calculated the domain sizes in the columnar phase for the different silica concentrations (Fig. 6). First of all, it can be noticed that the columnar phase has a very long positional order. The platelets are ordered over distances larger than at least 10 of their diameters. Further, the domain size decreases with an increasing attraction in the mixtures. This is because the speed of the liquid crystal nucleation increases with the attraction. In the mixtures with higher depletant concentration more nuclei are formed, which leads to smaller domain sizes in the columnar phase.
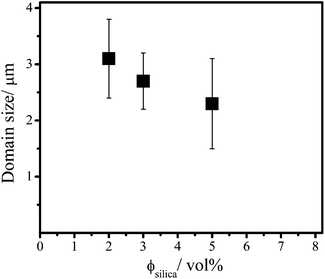 | ||
| Fig. 6 The domain size in the columnar phase as a function of the silica concentration in mixed samples with an initial concentration of 8 vol% of gibbsite. | ||
IV. Discussion
Adding silica spheres to the gibbsite suspensions led to a fast non-equilibrium process, i.e. formation of an arrested state. Within months the upper isotropic phase separates into a columnar and a more diluted isotropic phase on top of the arrested state due to sedimentation. The non-trivial behaviour of gibbsite/silica mixtures on two time scales can be rationalized theoretically due to the significant difference between them. Our analysis is based on the idea that the arrested state acts as a spectator phase, while being physically present in the system it does not interfere with the phase behaviour at long time scales, as indicated by the absence of columnar phase formation in samples with ≥7 vol% silica. Fig. 7a schematically shows how the volume fraction of silica and gibbsite changes in a sample during the time frame of the experiment. After rapid formation of an attractive glass in the mixtures, the upper isotropic phase becomes depleted in gibbsite platelets and rich in silica spheres in comparison to the original system, thus increasing the depletion attraction strength. Furthermore, due to the sedimentation of platelets a concentration gradient is established over a period of months in the isotropic phase, resulting in an increased concentration of platelets in the lower part of the sample. As a result, the system is first moved to higher silica concentration and then slowly quenched from its position at the phase boundary into the coexisting isotropic–columnar phase region. Since sedimentation causes a slow increase in the platelet concentration, the new phase separation is also induced slowly. Therefore, the attractive gibbsite platelets are now able to form a liquid crystalline phase instead of becoming arrested. Further sedimentation leads to a continuous increase of platelet concentration in the lower part of the isotropic phase and hence to formation of the columnar phase. This will continue until the system finally reaches a steady state, where sedimentation is counterbalanced by the osmotic pressure gradient due to the platelet concentration profile. As mentioned before, the amount of the columnar phase in mixtures decreases with an increased initial concentration of spheres. This is due to the fact that the amount of platelets in the isotropic phase will be smaller in samples with higher depletant concentration, because the amount of glass formed at the initial stage is linearly proportional to the depletant concentration.16 This effectively reduces the number of platelets available for the formation of a sedimentation profile and hence the formation of the columnar phase. Therefore samples with high depletant concentrations will reach a steady state much earlier.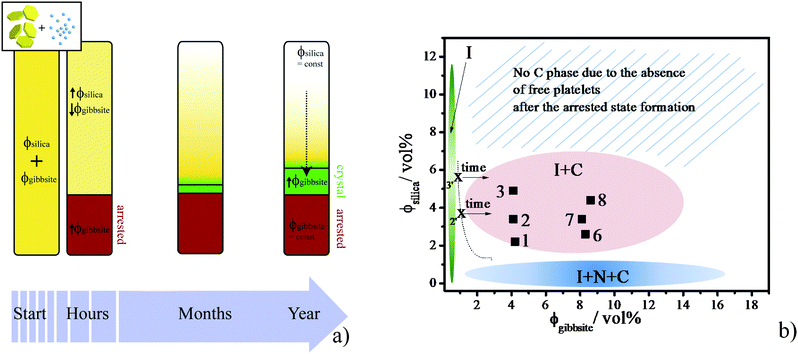 | ||
| Fig. 7 (a) Scheme showing how the volume fractions of silica spheres and gibbsite platelets change in a sample over time. First a split off of arrested state with a high concentration of platelets occurs, after which the isotropic top phase slowly evolves due to the sediments into an isotropic/columnar coexistence region. (b) Experimental phase diagram of aqueous gibbsite/silica suspensions on the time scale of a year with (green) I phase, (pink) the I/C phase coexistence and (blue) the I/N/C phase coexistence. Dashed line is an approximate boundary between the I phase and the I/C phase coexistence. Numbers label the samples as presented in Fig. 2 at their initial volume fractions. The arrows schematically represent the change of gibbsite vol% of the top phase after formation of the arrested phase, as it gets quenched from the I phase to the I/C coexistence region due to gravity. | ||
We summarize the visual observations on the pure gibbsite and gibbsite/silica suspensions on the time scale of one year in the schematic phase diagram presented in Fig. 7b, where sample points are placed at the initial used volume fractions, as it is hard to estimate these after the formation of the arrested state.
In the studied systems of mixed gibbsite/sphere suspensions the only liquid crystalline phase observed is a columnar phase in coexistence with an isotropic phase (I + C). Interestingly, the pure gibbsite systems in our study are able to form a nematic phase, both on short time scales and upon sedimentation (I + N + C). The strong depletion attraction in the mixtures prevents the formation of a gravity induced nematic phase. This fact is explained by theoretical calculations for mixtures of hard discs with small polymers7,23 and repulsive platelets with spheres,3 which predict a significant broadening of the I/C coexistence region at large depletant concentrations. The initial silica sphere concentration in our mixed suspensions is high enough to induce attractions between 5 and 19 kBT. Additionally, due to the glass formation partitioning of the colloids takes place in the mixtures, which makes the silica concentration in the upper phase even higher than the overall initial one. At such strong attractions sedimentation of platelets could only lead to a transition from an I to a C phase without the intervention of a N phase.7
V. Conclusions
We studied aqueous gibbsite platelet suspensions to which silica spheres were added in order to induce depletion attraction. As a result of the short range and the large strength of this interaction, the glass state was formed in the mixtures at the initial stage. However, on the time scale of months, due to the sedimentation of platelets an isotropic/columnar phase coexistence was established on top of it. On this time scale formation of the columnar phase instead of the arrested state in concentrated platelet suspensions was possible, because the sedimentation enabled a slow quench into the isotropic/columnar two phase coexistence region in the phase diagram of attractive platelets.We used μradXRD to obtain detailed information about the structure of the columnar phase formed due to platelet sedimentation in their mixtures with spheres. It showed that the structure of the columnar phase is less compressed than the structure of the glass formed in the same samples. Furthermore, the liquid crystalline domains were found to become smaller with an increasing sphere concentration in the mixtures, because the number of nuclei of the columnar phase is proportional to the attraction strength in the system.
Acknowledgements
We thank Mark Vis for his help with the AFM measurements. Peter Holmqvist is thanked for many fruitful discussions and a careful reading of the manuscript. The team of BM-26 is thanked for the technical assistance during the synchrotron experiments. This work is part of the research program of the Foundation for Fundamental Research on Matter (FOM), which is part of the Netherlands Organization for Scientific Research (NWO). The beam time was kindly provided by NWO.Notes and references
- P. Davidson and J.-C. P. Gabriel, Curr. Opin. Colloid Interface Sci., 2005, 9, 377–383 CrossRef CAS.
- J. A. C. Veerman and D. Frenkel, Phys. Rev. A: At., Mol., Opt. Phys., 1992, 45, 5632–5648 CrossRef.
- S. D. Peroukidis, A. G. Vanakaras and D. J. Photinos, J. Mater. Chem., 2010, 20, 10495 RSC.
- D. Kleshchanok, A. V. Petukhov, P. Holmqvist, D. V. Byelov and H. N. W. Lekkerkerker, Langmuir, 2010, 26, 13614–13621 CrossRef CAS.
- F. M. van der Kooij, M. Vogel and H. N. W. Lekkerkerker, Phys. Rev. E: Stat. Phys., Plasmas, Fluids, Relat. Interdiscip. Top., 2000, 62, 5397 CrossRef CAS.
- L. Luan, W. Li, S. Liu and D. Sun, Langmuir, 2009, 25, 6349–6356 CrossRef CAS.
- H. H. Wensink and H. N. W. Lekkerkerker, Europhys. Lett., 2004, 66, 125 CrossRef CAS.
- D. van der Beek, T. Schilling and H. N. W. Lekkerkerker, J. Chem. Phys., 2004, 121, 5423–5426 CrossRef CAS.
- J. Zhang, L. Y. Luan, W. X. Zhu, S. Y. Liu and D. J. Sun, Langmuir, 2007, 23, 5331–5337 CrossRef CAS.
- H. Hemmen, N. I. Ringdal, E. N. De Azevedo, M. Engelsberg, E. L. Hansen, Y. Meheust, J. O. Fossum and K. D. Knudsen, Langmuir, 2009, 25, 12507–12515 CrossRef CAS.
- D. van der Beek, P. B. Radstake, A. V. Petukhov and H. N. W. Lekkerkerker, Langmuir, 2007, 23, 11343–11346 CrossRef CAS.
- M. Holgado, F. Garcia-Santamaria, A. Blanco, M. Ibisate, A. Cintas, H. Miguez, C. J. Serna, C. Molpeceres, J. Requena, A. Mifsud, F. Meseguer and C. Lopez, Langmuir, 1999, 15, 4701–4704 CrossRef CAS.
- A. Blanco, E. Chomski, S. Grabtchak, M. Ibisate, S. John, S. W. Leonard, C. Lopez, F. Meseguer, H. Miguez, J. P. Mondia, G. A. Ozin, O. Toader and H. M. van Driel, Nature, 2000, 405, 437–440 CrossRef CAS.
- A. van Blaaderen, R. Ruel and P. Wiltzius, Nature, 1997, 385, 321–324 CrossRef CAS.
- M. Leocmach, C. P. Royall and H. Tanaka, Europhys. Lett., 2010, 89, 38006 CrossRef.
- D. Kleshchanok, J. M. Meijer, A. V. Petukhov, G. Portale and H. N. W. Lekkerkerker, Soft Matter, 2011, 7, 2832 RSC.
- A. V. Petukhov, J. H. J. Thijssen, D. C. 't Hart, A. Imhof, A. van Blaaderen, I. P. Dolbnya, A. Snigirev, A. Moussaid and I. Snigireva, J. Appl. Crystallogr., 2006, 39, 137–144 CrossRef CAS.
- B. E. Warren, The X-Ray Diffraction, Dover Publications, New York, 1990 Search PubMed.
- D. van der Beek and H. N. W. Lekkerkerker, Langmuir, 2004, 20, 8582–8586 CrossRef CAS.
- T. Hahn, International Tables for Crystallography, Reidel, Dortrecht, 1983 Search PubMed.
- P. Holmqvist, P. Alexandridis and B. Lindman, Langmuir, 1997, 13, 2471–2479 CrossRef CAS.
- B. J. Ackerson, S. E. Paulin, B. Johnson, W. van Megen and S. Underwood, Phys. Rev. E: Stat. Phys., Plasmas, Fluids, Relat. Interdiscip. Top., 1999, 59, 6903–6913 CrossRef CAS.
- S. D. Zhang, P. A. Reynolds and J. S. svan Duijneveldt, J. Chem. Phys., 2002, 117, 9947–9958 CrossRef CAS.
| This journal is © The Royal Society of Chemistry 2012 |
