Designing mechano-responsive microcapsules that undergo self-propelled motion
German V.
Kolmakov
a,
Alexander
Schaefer
b,
Igor
Aranson
c and
Anna C.
Balazs
*d
aChemistry Department and Center for Simulation and Modeling, University of Pittsburgh, Pittsburgh, PA 15260, USA
bElectrical and Computer Engineering Department, University of Pittsburgh, Pittsburgh, PA 15261, USA
cMaterials Science Division, Argonne National Laboratory, 9700 South Cass Avenue, Argonne, IL 60439, USA
dChemical Engineering Department, University of Pittsburgh, Pittsburgh, PA 15261, USA. E-mail: balazs@pitt.edu
First published on 18th November 2011
Abstract
Biological cells are capable of sensing mechanical cues and responding to these signals by undergoing morphological changes and directed motion. A significant challenge is creating cell-like objects that can translate mechanical stimuli into analogous behavior. Herein, we use computational modeling to design a simple mechanosensitive “cell” that responds to mechanical deformation through a shape change that allows it to undergo self-sustained, directed movement. Our cellular object is formed from a nanoparticle-filled microcapsule that is located on an adhesive substrate in solution. In response to a locally applied force, the deformed capsule releases nanoparticles that bind to the surface and dynamically create adhesion gradients. Due to the self-generated gradients, the capsule moves autonomously from regions of less adhesion to greater adhesion. During the capsule's motion, new nanoparticles are released that both sustain and propagate the adhesion gradients and thus, the capsule sustains autonomous movement along its path (until it is depleted of nanoparticles). The self-sustained motion occurs only if the permeability of the capsule's shell depends on mechanical deformation. We isolate critical parameters that control the dynamic behavior of this mechano-responsive capsule. Our findings can facilitate the fabrication of devices that are powered by the autonomous movement of microscopic synthetic cells. Additionally, the capsules could serve as sensors for mechanical strain, indicating the presence of strain fields by their spontaneous motion and release of nanoparticles; the latter behavior could be exploited in the fabrication of self-healing materials.
I. Introduction
Biological cells harness a complex biochemical machinery to sense both chemical and mechanical cues. Via a dynamic cascade of intracellular processes, cells can recognize chemical gradients and move in response to these gradients. For example, in the process known as haptotaxis, cells move towards higher concentrations of chemo-attractants along a surface. Cells can also exhibit mechanotaxis, undergoing directed motion due to mechanical variations in their environment. For instance, endothelial cells migrate in the direction of an applied fluidic shear stress1 and fibroblasts have been shown to preferentially migrate from soft to harder surfaces.2 One of the challenges in designing artificial cells that are fabricated from purely synthetic components is imbuing these inanimate objects with the extraordinary sensory capabilities of the biological counterparts.In addressing the above challenge, researchers have devised a number of nano- and microscopic particles that can undergo directed motion in response to chemical gradients, as well as external fields;3–9 a recent review3 provides a detailed description of these various systems. To the best of our knowledge, there have, however, been few attempts to create cell-like objects that exhibit a biomimetic response to mechanical stimuli, or mechanotaxis. Herein, we use computational modeling to design a biomimetic particle that undergoes self-sustained motion due to a mechanical signal. In particular, this synthetic cell effectively runs away from an applied force and keeps “running” even after the force is removed. In the most general sense, this synthetic system exhibits one of the hallmarks of living systems: the ability to flee from adverse conditions.
Our synthetic cell is created from a fluid-filled, polymeric microcapsule. Specifically, our simulations capture salient features of microcapsules fabricated by the sequential deposition of polyelectrolytes, using a technique referred to as the layer-by-layer (LbL) method,10 or “polymersomes” fabricated from block copolymers.11 The shells of these micro-carriers are sufficiently robust to act as a protective barrier, and adequately permeable for the controlled exchange of reagents with an external solution.12 Furthermore, the permselectivity of the shells can be readily tuned.13–17 By functionalizing the shell's outer surface, these capsules can bind to an underlying substrate.13 Moreover, the LbL microcapsules can encapsulate and controllably release various nanoparticles.16–18 Of particular relevance to this study, researchers have recently demonstrated that mechanical deformation can be harnessed to control the release of the encapsulated species.19
We exploit several of the above features to formulate a new design concept: deformation-controlled mobility of soft, microscopic particles. Specifically, our compliant capsule encases nanoparticles within its fluid-filled core and is localized on an adhesive substrate in a host fluid. As detailed below, we apply an initial mechanical deformation to the capsule and harness this force to increase the permeability of the capsule's shell19 and thereby drive the release of the encapsulated nanoparticles. The released nanoparticles can bind to the substrate and modify the adhesive properties of the surface, creating an adhesion gradient in the vicinity of the capsule. Due to this chemical gradient, a previously stationary capsule exhibits a transition to self-sustained motion. Notably, the chemical gradient persists after the mechanical deformation is lifted and thus, this synthetic cell sustains its motion even when the perturbation is removed.
It is noteworthy that these responsive microcapsules mimic features of the behavior of keratocyte cells;20 namely, both alter their shapes in response to a local perturbation and subsequently undergo sustained motion. Moreover, both objects respond to chemical gradients as they undergo this movement. Finally, for both the keratocyte cell and microcapsule, the direction of motion is dictated by the initial shape deformation.
To model the three-dimensional behavior of the fluid-filled, compliant capsule in solution, we integrate the lattice Boltzmann method (LBM) for fluid dynamics with the lattice spring model (LSM) for the mechanical behavior of elastic solids. Our hybrid “LBM/LSM” simulations reveal that the velocity of the self-propelled capsules is controlled by the shell permeability and degree of curvature. The simulations also reveal the existence of a minimal velocity of self-propulsion: reducing the shell curvature below a certain threshold leads to an abrupt termination of the self-sustained motion.
In addition to the LBM/LSM simulations, we utilize a distinct coarse-grained approach to model the system. Namely, we develop a simple two-component phase-field model that couples the nanoparticle concentration dynamics with the phase field describing the microcapsule's shape. Via this model, we can show that the capsule's velocity is also dependent on the nanoparticle release rate. As described below, we find qualitative agreement between these two complementary descriptions and thereby demonstrate the robustness of the observed behavior.
The findings from these studies can facilitate the development of a new generation of devices21–23 (e.g., sensors, actuators, microfluidic mixers) that are powered by motile, artificial cells. Our mechano-responsive capsules can also play a vital role within artificial microvascular networks that are embedded in materials and intended to deliver healing agents to the system.24 In particular, when the material is sufficiently stressed, the capsules would initiate their motion within the network and could deliver nanoparticles to nanoscopic cracks in the surfaces, thereby mending the material.25 On a more fundamental level, our results provide design rules for using synthetic components to create “cell-like” objects, which can mimic elemental behavior exhibited by biological cells.
We describe the two complementary approaches we use to model the deformable capsules in the Methodology section. Using these models, we determine conditions for which a single microcapsule on a substrate undergoes sustained, self-propelled motion in response to an initial mechanical deformation. Finally, we consider a specific scenario involving the encounter of two mechano-responsive capsules. This example illustrates the complex dynamics that can be achieved through the mutual interactions of the self-propelled capsules.
II. Methodology
A. LBM/LSM simulations
The fluid-structure interactions between the solution and the compliant capsule are solved using our recently developed hybrid approach,26–33 which we refer to as the “LBM/LSM”. In this method, the lattice spring model (LSM) is used to construct the capsule's solid, elastic shell, which is composed of a triangular network of harmonic springs that connect regularly spaced mass points, or nodes.27–30 The spring force Fs on node ri is equal to | (1) |
The capsule's spherical shell is formed from two concentric layers of the LSM nodes; the capsule contains a total of N = 224 nodes. These two layers are separated by a distance of ΔxLSM = 1.5 Δx, where ΔxLSM is the lattice spacing between nearest nodes in the LSM and Δx is the spacing in the LBM. The outer radius of the shell was taken to be R = 5 Δx. For small deformations, the LSM system obeys linear elasticity theory and results in a Young's modulus of E = 5kj /2ΔxLSM.34,35
The dynamics of the host and encapsulated fluids is described by the lattice Boltzmann model (LBM),36 which is an effective solver for the Navier–Stokes equation. The host and internal fluids interact with the solid shell through appropriate boundary conditions.27,30 In particular, the shell imposes its momentum on the surrounding fluids through the corresponding velocity distribution in the LBM. In turns, the capsule experiences the forces due to the fluid pressure and viscous stress at the interface.
To capture the diffusion of nanoparticles within the encapsulated and host fluids, we use a Brownian dynamics model for the particles.28,37,38 The nanoparticle trajectories obey a stochastic differential equation
 | (2) |
To capture the fact that a capsule having a diameter of roughly 10 μm can enclose a very large number of nanoparticles, we assume that the nanoparticle concentration is not depleted during the time scale of our simulations.41 Note that this approximation is valid if the time scale of the nanoparticles release, τs = R/3P, is much larger than the characteristic time of the microcapsule motion.42 Here R is the capsule radius and P is the permeability of the capsule's shell. The value of τs can range from 103 s–105 s, depending on the size of the nanoparticles being released from the capsule and the thickness of the capsule shell.13,43–45 Given that the velocity of the capsule in the simulations ranges from V = 0.1–20 μm s−1 (see Comparison between simulation parameters and physical values below), the characteristic time required for the capsule to move over the distance equal to its radius is τR = R/V ≈ 2.5–50 s. The latter values yield τs /τR ≫ 1, and hence validate our assumption. We also note that at the onset of the simulation, the capsule encases Np = 104nanoparticles.
The diffusing nanoparticles bind to the surface and thereby modify the capsule–surface interaction.46 This interaction between a site on the external shell of the capsule and a site on the surface is modeled via a non-specific Morse potential:
 | (3) |
In the simulations, the diffusing nanoparticles that bind to the surface act to decrease the strength of the capsule-surface interaction. Thus, εs in eqn (3) is written as
| εs = ε(1 − θ) | (4) |
We simulate the chemisorption of nanoparticles on the surface by assigning a probability wdep for a nanoparticle that hits the surface to bind onto this surface site in a given time step Δt. This probability has the form:40,46
| wdep = kΔt(1 − θ). | (5) |
In accordance with recent experimental studies,19 we assume that the permeability of capsule's shell, P, is affected by mechanical deformation of the capsule. In particular, we specify that P is proportional to the local curvature of the shell. We model the dependence of P at a point r on the surface of the shell by the following smoothed step function:
 | (6) |
The curvature of the capsule's shell at an LSM node i located at ri was calculated as49,50
| Ki = A−1iΔϕi | (7) |
 is the “angle defect” at the node i, i.e., the difference between the circular angle 2π and the sum of interior angles ϕj at ri of the neighboring triangular elements j at the capsule surface that meet at ri, and Ai is the Voronoi area around the node i. (Note that for a flat surface,
  and hence, the curvature in eqn (7) is zero.)
It is worth noting that in our simulations, the capsule's shell undergoes an elastic deformation and thus, the capsule can regain its equilibrium shape after the externally applied force is removed (see further below). A plastic deformation of the capsule's shell can be taken into account in the lattice spring model by using the approach described in ref. 35.
B. Comparison between simulation parameters and physical values
We characterize our system by specifying the dimensionless capillary number Ca = Vμ/Eh, where V is the capsule velocity, μ is the fluid viscosity, E is the modulus of the shell, and h is the shell thickness.27,51 The capillary number represents the relative importance of the viscous stress in the surrounding fluids and the elastic stress in the capsule's shell. In the simulations, we specifically consider cases where the capillary number for the moving capsule is small, 10−5 ≤ Ca ≤ 10−3. To put this value of Ca in context, we can consider LbL microcapsules that are propelled by an applied shear in a microchannel. We take the fluid to be an aqueous solution whose viscosity is μ ≈ 10−3 kg/sm and density is ρ ≈ 103 kg m−3. The elasticity of the microcapsule's shell is on the order of 0.1–1GPa,52–57 and these elastic properties are found to be independent of the speed of deformation.54 In typical flow experiments within a microchannel, the shear rate can be up to![[small gamma, Greek, dot above]](https://www.rsc.org/images/entities/char_e0a2.gif) ≈ 103–104 s−1.58 If we take experimentally realistic values of the membrane thickness h to be about 50 nm for a 50 μm capsule,53 we then obtain Ca ∼ 10−4, which is in the range considered in the simulations.
≈ 103–104 s−1.58 If we take experimentally realistic values of the membrane thickness h to be about 50 nm for a 50 μm capsule,53 we then obtain Ca ∼ 10−4, which is in the range considered in the simulations.
It is noteworthy that our approach is also appropriate for modeling the interaction between leukocytes and a substrate. Leukocytes have a cytoskeleton that serves to maintain the spherical shape of the cell, and these cells have in fact been modeled as fluid-filled elastic shells. In the latter modeling studies, researchers typically use an effective membrane stiffness that lies in the range 0.01–0.3 N m−1.59–61 For leukocytes with radii of the order of 5 μm moving in an aqueous solution, one obtains typical values of the capillary number Ca∼10−4, which is again in the range of our simulations. The latter range also applies to the motion of keratocytes on a surface. Keratocytes that are roughly 3–5 μm in size move at a speed of 0.3–0.5 μm s−1 and the relevant surface tension62 can be estimated as 1 pN; consequently, this system is characterized by a capillary number of Ca ∼ 2 × 10⁻³.
We also introduce a dimensionless interaction strength27,51 Φ = εN/EΔxLSMκ2, where ε and κ characterize the respective strength and range of the interaction potential. Additionally, N is the number of nodes in the capsule's shell and ΔxLSM is the lattice spacing in the LSM. The parameter Φ represents the ratio of the interaction strength with the substrate to the membrane stiffness. For Φ≫1, the interaction leads to significant deformation of the capsule, while for Φ≪1, the effect on the capsule's shape is small. Here, we set Φ = 2.44, which corresponds to an experimentally realistic value for polyelectrolyte microcapsules.27
The motion of a capsule along a substrate can be described by the Reynolds number, Re = VR/μ, which characterizes the relative importance of the inertial and viscous effects. Our simulations are limited to low Reynolds number flow, where the influence of inertial effects can be neglected; in particular, during the sustained motion of a capsule Re ≈ 1.5 × 10⁻³, which is in the range of typical values for leukocytes with radii of the order of 5 μm in an aqueous solution.59–61 The motion of the nanoparticles can be characterized by the Peclet number, Pe = VR/D0, which represents the importance of convection relative to that of diffusion. A low Peclet number indicates a situation where diffusion dominates the motion of the nanoparticles and, conversely, a high Peclet number indicates a scenario where convection dominates. In our simulations, the Peclet number varies in the range of Pe ≈ 10−3–10−2. Low Peclet numbers Pe ≪ 1 are characteristic for the diffusion of nanometre sized particles in an aqueous solution.26
The haptotactic motility of living cells has been studied experimentally by measuring the velocity vH of cell migration on a surface that encompasses a gradient of chemo-attractant.63–65 It has been observed that vH = H∇(C/(kd + C)), where H is the haptotactic motility, C is the attractant concentration on the surface, and kd is the dissociation constant of the cell-attractant bond. The experimentally determined value of H depends on the type of cell and can vary from 10−10 to 10−6 cm2 s−1.63–65 In our simulations, we find the capsule's motility to be H∼10−7–10−6 cm2 s−1 (given a microcapsule diameter of 10 μm), which is comparable to the value for rolling leukocytes.64 In our model, the motility of the capsules can be varied by changing the interaction strength ε between the capsule and the substrate. We note that the velocities of the capsules obtained in our simulations, V ∼ 0.1–2 μm s−1, are close to those observed in experiments on the haptotactic motion of vesicles surfing on a lipid bilayer, where the velocities were in the range of 1–5 μm s−1.66
C. Phase-field model
To obtain further insight into the phenomenon of self-propulsion, we developed a two-component phase-field model that couples the nanoparticle concentration to the phase field describing the microcapsule shape. The approach is a generalization of the phase-field model that is widely used in the simulation of nonlinear dynamics in complex fluids67 and fluid-solid interfaces, granular materials, and crack propagation in brittle solids.68,69 While our specific formulation is significantly simpler than a recent model for cell morphodynamics,62 it nonetheless captures the phenomenological behavior observed in our LBM/LSM simulations.In this phase-field approximation, the system is described by two two-dimensional coupled fields, ρ(x,y,t) and c(x,y,t), which represent the respective phase field proportional to the microcapsule's mass density and the spatial distribution of the nanoparticles. The phase field ρ is set to zero outside the capsule and to ρ ≈ 1 inside the capsule and changes smoothly across the interface. The equations of motion of the system are
 | (8) |
 | (9) |
The domain size was chosen from 100 × 100 or 240 × 240 units, and the number of mesh points from 256 × 256 to 512 × 512, respectively. Integration of eqn (8)–(9) was performed in a periodic square domain. In the majority of our simulations, the model parameters were set to the following values: α = 0.4, β = −1, Dρ = 4, Dc = 0.2, η = 0.5, λ = 0.1, and the parameter γ, which characterizes the rate of nanoparticle release, was varied in the range 0 < γ < 0.07.
The initial conditions for eqn (8) were taken to be of the form ρ(r,0) = ρ0θ(r0–r), c(r,0) = c0(x − x0)θ(r0–r),62i.e., we impose an initial concentration gradient; here ρ0 = 1 and c0 = 3, and θ is a step function. Similar results were obtained with different initial conditions, (such as an initial shape deformation). The above system of equations are solved numerically using the pseudo-spectral method.70 We consider the case where the effective capillary number for the system described by eqn (8)–(9) is Caeff = Vτ1/2ρ/D1/2ρ∼8 × 10−3, which lies in the range of the LBM/LSM simulations (here, τρ = 1 is the characteristic relaxation time for the phase field).
Using the above models, we specifically consider two cases. In the first case, the deformation of the capsule is due solely to its adhesive interaction with the surface; in the second case, we apply an external force to one side of the capsule. The capsules are fixed in position for a finite time, which we specify as tdef. During t ≤ tdef, the released nanoparticles can bind to the surface and modify the adhesive properties in the vicinity of the stationary capsules. At t > tdef, we lift the constraint on the position of the capsules and allow them to move in response to the adhesion gradients created by the adsorbed nanoparticles. As we show in the following section, the two types of capsules exhibit very different behavior. We then build on these findings to consider the interaction between two mechano-responsive capsules.
III. Results and discussion
A. Modeling the behavior of a single capsulevia the LBM/LSM
Fig. 1 shows the graphical output from the “LBM/LSM” simulations for stationary, compliant capsules on an adhesive surface. In the absence of an external force, the shape of the capsules is determined by its adhesive interaction with the substrate. As seen in Fig. 1a, at the value of Φ = 2.44 considered here, the bottom of the capsule is flattened by its relatively strong attraction to the surface and consequently, the entire object assumes an almost hemispherical shape. The color bar in the figure indicates the curvature of the capsule; the dark shades correspond to regions of low curvature, while yellow marks regions of high curvature. A dark blue area is visible at the bottom of the capsule.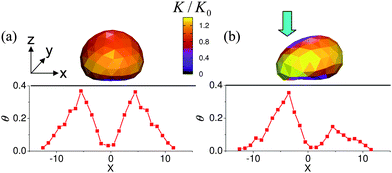 | ||
| Fig. 1 Upper row: (a) equilibrium and (b) deformed shape of the microcapsule on an adhesive surface. Color shows the local curvature of the capsule's shell computed viaeqn (7). Bottom row: Slice in the (x,z) plane of the fractional coverage of the surface by the nanoparticles calculated at t = 2 × 10⁵ time steps (in LBM units) for the capsules shown in the upper row. In these images, the center of the capsule is located at (x,y,z) = (0,0,5.7Δx)). | ||
In the case of the capsule in Fig. 1b, we apply a steady force to the left side of the shell (see arrow) for a time period tdef. Due to this force, the curvature on the left part of the capsule is higher than that on the right, as is clearly visible from the figure.
For both of the above cases, the positions of the capsules are held fixed for the time tdef, so that the capsules remain stationary during this time interval. The encased nanoparticles can diffuse through the permeable shells of the immobilized microcapsules and into surrounding solution. As indicated by eqn (6), the permeability P(r) is dependent on the local curvature of the shell. The shape of the capsule in Fig. 1a is symmetric with respect to the center-of-mass x-coordinate Xc = 0; thus, the permeability of the shell is also symmetric in the (x,y) plane with respect to the capsule's center. The fractional coverage of the surface by the nanoparticles, θ, is plotted as a function of x beneath the image of the capsule. The data is taken at y = 0 and represents a slice through the x − z plane; additionally, the data is averaged over six independent runs and was collected for tdef = 2 × 10⁵ time steps. (Both the coordinates and time are expressed in lattice Boltzmann units.)
Due to flatness of the bottom of the shell in Fig. 1a, the permeability in this region is relatively low. On the other hand, the curvature, and hence the permeability, of the sides of the capsule are relatively high. This asymmetry in permeability gives rise to a high concentration of particles at the edge of the capsule and fewer particles near the center (see Fig. 1a). Viewed from the top, the deposited nanoparticles form a symmetric ring around this capsule.
We now consider the behavior of the capsule in Fig. 1a at time t > tdef, when we remove the constraint on the position of capsule and it can potentially move on the surface. Due to the symmetric ring of nanoparticles deposited during t ≤ tdef, the adhesion profile about the capsule's center is also symmetric. Consequently, there is no driving force for a single capsule to move either to the left or the right, and the capsule remains fixed in space even at time t > tdef. (Note that we consider regimes where the viscous forces are sufficiently strong that they prevent spontaneous capsule motion that can be caused by adhesion fluctuations due to an uneven deposition of nanoparticles.)
In the case of the mechanically deformed capsule in Fig. 1b, the structural asymmetry leads to an asymmetry in the permeability. (Note that in the simulations, a stationary capsule is deformed by pressing the left side of the capsule.) The permeability of the most deformed part of the shell (shown in yellow in Fig. 1b) was P ≈ 1.5P0, where P0 is the permeability of an undeformed, spherical shell. The minimal permeability of the shell, P ≈ 0.5P0, is reached at the least curved regions of the shell (top and bottom parts of the capsule, shown in violet). This asymmetry in the permeability in turn yields a non-symmetric distribution of nanoparticles around the capsule. As can be seen in the plot of θ vs. x for this case, the concentration of nanoparticles is higher on the left side of the capsule than on the right. Recall that the deposited nanoparticles make the surfaces less adhesive and thus, the surface is more adhesive on the right side of the capsule. As we show below, this adhesion gradient, which was formed at t ≤ tdef, initiates the directed motion of the capsule from the less adhesive region toward the stickier area. At later times t > tdef, the capsule continues to release nanoparticles and sustains the self-propelled motion (as explained below). Furthermore, the capsule maintains the direction of its initial path.
To characterize the asymmetry of the nanoparticle density on the surface and thus, the adhesion gradients around the immobilized, deformed capsule in Fig.1b, we calculate the total number of nanoparticles deposited on the left, Nleft, and the right, Nright, from the microcapsule's center-of-mass x-coordinate Xc = 0 during the t ≤ tdef = 2 × 10⁵ time steps. The demarcation between the left and right is shown in the inset in Fig. 2. The dependence of Nleft and Nright on time t is shown in the main plot in Fig. 2. We find that at all times t > 6 × 10³, the total number of nanoparticles deposited on the surface at x < 0 is higher than that at x > 0, in agreement with the plot in Fig.1b. In particular, the difference between Nleft and Nright at late times is approximately 1000 particles.
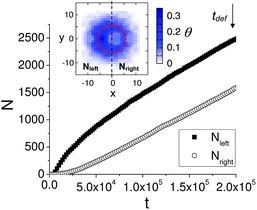 | ||
| Fig. 2 Main plot: Time dependence of the total number of nanoparticles deposited on the left from the capsule's center-of-mass X coordinate, Nleft, and on the right from the capsule's center-of-mass X coordinate, Nleft. The data is computed for t ≤ tdef. Inset shows the distribution of the deposited nanoparticles in the (x,z) plane calculated at t = tdef. | ||
After the time tdef = 2 × 10⁵, we remove the external force on the capsule in Fig. 1b and lift the constraint on the position of the capsule. Due to the spring forces between the nodes (see Methodology), the capsule equilibrates to a new, more symmetric structure. This process can be seen in Fig. 3b,c, which shows the evolution of the capsule's shape as the external force is removed. Since the surface underneath the capsule is more adhesive on the right, some deformation of the capsule persists when the applied force is lifted. But, the more dramatic consequence of the removing the constraints on the capsule is the spontaneous motion that the capsule initiates in response to the adhesion gradients created during the time t ≤ tdef.
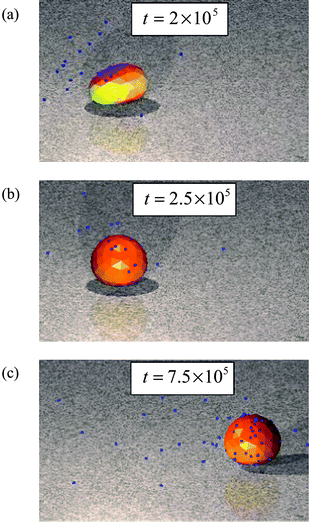 | ||
| Fig. 3 (a) Initially deformed capsule, (b) the capsule shape at t = 2.5 × 10⁵ time steps and (c) a moving capsules at t = 7.5 × 10⁵ time steps. | ||
Fig. 4a–c depicts the motion of this microcapsule and the evolution of the adhesion profile on the surface at t > tdef. The gradients in the nanoparticle distribution on the surface formed by the time tdef result in a net adhesion force directed along the x axis that initiates the microcapsule's motion. At later times (Fig. 4b,c), the microcapsule continues to move in the direction of the initial “push”. The latter behavior can be explained as follows. Consider that the nanoparticles released from the moving capsule in Fig. 4b form a symmetric cloud around the capsule. Nonetheless, particles newly deposited on the left will increase the already high surface coverage on the left and thus, contribute to the existing gradient. Driven by this gradient, the capsule again moves to the sticker region on the right. With each move to the right, newly released nanoparticles not only adsorb on the region ahead of the capsule, but also deposit behind the capsule and thus, continue to build up the asymmetry that was initiated by the mechanical deformation. In effect, subsequent particle depositions on the left act to amplify the initial asymmetry at time t = tdef. In this manner, the particles sustain and propagate the gradient on the substrate and thereby provide a continuous driving force for the directed movement of the capsule. (The behavior occurs until the capsule is ultimately depleted of nanoparticles.) Fig. 4d clearly shows that θ and hence the adhesion profile around the microcapsule remains asymmetric at later times.
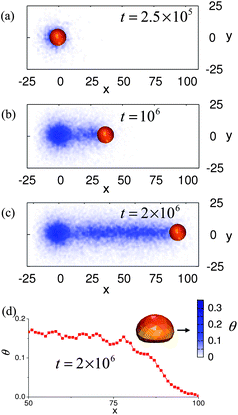 | ||
| Fig. 4 (a–c) Top down view of the moving capsule. Time is marked in the frames. The color bar indicates the density of the nanoparticles deposited on the substrate. (d) Slice in the (x,z) plane showing the fractional coverage of the surface by the nanoparticles calculated at t = 2 × 10⁶ time steps for the capsules shown in (c). | ||
It is worth noting that the conditions for sustained motion of the microcapsules and those required for initiation of the motion are different: the maximum gradients of the nanoparticle density on the surface are n′ = nmaxdθ/dx ≈ 10 particles/μm at the moment just before the pressing force was removed (Fig. 1b) and n′ ≈ 0.8 particles/μm in the course of the sustained motion (Fig. 4d). (Note that n′ refers to the gradient in nanoparticles, not the total number of nanoparticles; the latter numbers are shown in Fig. 2.) The main reason for this difference is that the adhesion profile on the surface at the initial stage (red curve on Fig. 1b) is not monotonic and hence, the capsule must overcome a potential barrier (the right maximum of the adhesion density) in order to initiate motion. For the moving microcapsule, the adhesion profile is smooth and therefore, smaller nanoparticle density gradients are enough to sustain motion.
To characterize the microcapsule motion, we plot the dependence of the capsule center-of-mass velocity as a function of time in Fig. 5 (for a single run). During the initial period of the motion, the velocity exhibits transient oscillations. This is due to the initial acceleration of the just “liberated” capsule as it traverses the nanoparticles that were deposited during its deformation. Eventually, however, the capsule attains a relatively constant velocity as it reacts to the newly deposited particles. In particular, at t > 106 time steps, the capsule undergoes a sustained motion with the velocity slightly fluctuating around the constant value V ≈ 6 × 10⁻⁴Δx/Δt (where Δx is one LBM lattice spacing and Δt is one LBM time step).
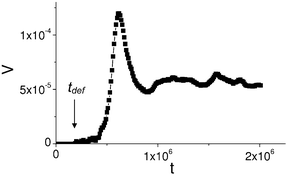 | ||
| Fig. 5 Dependence of the capsule velocity (in lattice Boltzmann units, Δx/Δt) on time. The moment of time when the capsule is freed, tdef is labeled by an arrow. | ||
Fig. 6 delineates the different regimes in the system. It shows that the behavior of the mechanically deformed capsule depends on both the threshold curvature Kthresh (see eqn (6)) and tdef. The region of parameter space where the initially deformed capsule travels along the surface is labeled by open circles, and the regions where it remains fixed in space is labeled by crosses. It can be seen on the map that at high Kthresh > 1.35K0 (where K0 is the curvature of a spherical capsule of the same radius), the capsule does not move. In this regime, the permeability of the capsule's shell is relatively low and hence, it releases relatively few nanoparticles. As a result, the density of nanoparticles that become bound to the surface at the initial stage t ≤ tdef is not sufficiently high to produce a strong adhesion gradient, and the capsule remains at its initial position at all times t > tdef.
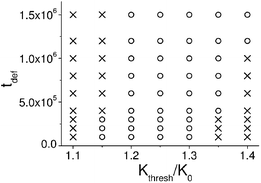 | ||
| Fig. 6 Phase map of the system showing the different regimes of motion. The region of parameters where an initially deformed capsule travels along the surface is marked by open circles; the region where the capsule remains fixed in space is marked by crosses. Three independent simulations were carried out for each data point. | ||
On the other hand, at low threshold values of Kthresh < 1.15K0, the release rate of the nanoparticles depends only weakly on the deformation of the capsule's shell and hence, the distribution of the released nanoparticles in the solution is close to symmetric. In effect, a sufficiently asymmetric adhesion gradient does not form on the surface, and the capsule does not move at t > tdef. From the diagram in Fig. 6, it follows that there are optimal conditions for the capsule's self-propelled motion: the threshold curvature should be approximately 20–30% higher than the curvature of a spherical capsule of the same radius.
B. Using the phase field model to simulate the behavior of a single capsule
As noted in the Methodology, we supplement the above “LBM/LSM” simulations with our two-component phase-field model, which is characterized by eqn (8) and (9). In this model, the encased nanoparticles diffuse out of the capsule and the phase-field density field ρ(x,y) evolves in response to the gradients of the nanoparticle concentration c(x,y). To provide the initial asymmetry, the capsule was “kicked” into motion with an initial asymmetric deformation of the shape or initial concentration gradient leading to an initial positive velocity V0 ≈ 10−2 in the x direction.Results obtained by numerical solution of eqn (8) and (9) are shown in Fig. 7 and 8. In particular, Fig. 7a and b illustrate the respective two-dimensional phase field ρ and concentration c at time t = 400 τρ for a self-propelled capsule, where τρ is the characteristic relaxation time of the phase field. Fig. 7c and d, in turn, depict the time evolution of the phase field and the concentration of the nanoparticles for three consecutive moments of time; the data are taken along the x axis and through the capsule's center of mass.
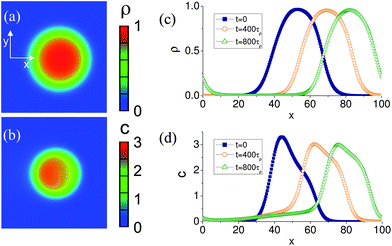 | ||
| Fig. 7 Graphical representation of the spatial distribution of: (a) the capsule's phase field (mass density), ρ, and (b) the nanoparticle concentration, c, computed in the phase field model. (c,d): Temporal evolution of the capsule's mass density and nanoparticles concentration. Periodic boundary conditions were applied to the simulation domain. | ||
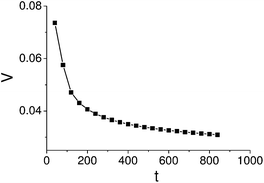 | ||
| Fig. 8 Time dependence of the microcapsule velocity computed via the phase field model. | ||
It is clearly seen that at t > 0, the capsule travels in the direction of the initial push. The asymmetry of the nanoparticle concentration around the center of the capsule at t = 400 τρ is seen in Fig. 7d (see also the color plot in 7b) and is maintained in the course of motion. The concentration distribution of nanoparticles is consistent with LBM/LSM simulations: for self-propelled capsules, the concentration is depleted at the front edge and enriched at the rear, as can be seen by comparing Fig. 2 and Fig. 7d. In contrast, asymmetry in the shape of the order parameter field is less pronounced. (The non-zero values of the phase field ρ at x ≈ 0 at later time t ≈ 800 τρ in Fig. 7c are caused by periodic boundary conditions at the boundaries of the simulation domain: when the capsule crosses the right boundary of the integration domain it reappears on the left side.)
The dependence of the capsule velocity on time (Fig. 8) is similar to that obtained via the LBM/LSM simulation (Fig. 5); in particular, the plot in Fig. 8 shows a sharp increase of the velocity from zero at the moment of the initial “push” and a subsequent relaxation to the steady-state value. Hence, this simplified model shows qualitative agreement with the three-dimension LBM/LSM simulation. Furthermore, the model confirms that the nanoparticle-releasing capsule not only exhibits sustained motion, but also maintains the path set by the initial “push” or perturbation.
The computational efficiency of the phase-field model allowed us to readily investigate the effect of the nanoparticle release rate on the self-sustained motion of the microcapsule. To simulate variations in the particle release rate using our phase-field approach, we systematically varied the parameter γ (see eqn (9)). As can be seen from Fig. 9, the dependence of the microcapsule's speed on the release rate is non-monotonic: the speed increases initially with an increase of γ, then reaches a maximum and falls off with further increases in γ. This non-trivial behavior can be understood from the following arguments. Small increases of the release rate result in an increase of the adhesion gradient, which is determined by the concentration gradient. For very large release rates, however, the concentration (and, accordingly, the adhesion) gradient levels off due to saturation (described by the term ∼η in eqn (9)), and the velocity decreases.
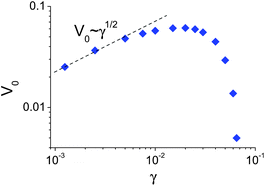 | ||
| Fig. 9 Dependence of the microcapsule steady-state velocity, V0, on the nanoparticle release rate, γ. | ||
For small γ values, a numerical fit to the microcapsule's velocity V0 indicates the following power law: V0 ∼ γ1/2. This dependence can be qualitatively understood as follows. The microcapsule velocity is proportional to the concentration gradient averaged over the area of microcapsule: V0 ∼ 〈∇c〉. In turn, integrating eqn (9) in the frame moving with the speed V0 over the area of the capsule, we obtain V0〈∇c〉 ≈ γS, where S is the total area of the capsule. Given the proportionality of V0 to the concentration gradient, we can rewrite the latter expression as V20∼γ![[thin space (1/6-em)]](https://www.rsc.org/images/entities/char_2009.gif) S and thus obtain the estimate that V0 ∼ γ1/2. It is noteworthy that we obtained the same qualitative relationship between the velocity of a capsule and the release rate in an earlier study that utilized both analytical theory and the LBM/LSM approach to model the haptotactic motion of microcapsules26
S and thus obtain the estimate that V0 ∼ γ1/2. It is noteworthy that we obtained the same qualitative relationship between the velocity of a capsule and the release rate in an earlier study that utilized both analytical theory and the LBM/LSM approach to model the haptotactic motion of microcapsules26
C. Behavior of two mechano-responsive capsules
Given the above findings, we were led to consider what would happen when two moving capsules approach each other “head on” so that each effectively blocks the path of the other. (There is an excluded volume interaction between the capsules that is modeled through the repulsive part of the Morse potential.) In particular, how would the capsules renegotiate their movements? Below, we examine this specific scenario via the LBM/LSM simulations. The observed behavior would also characterize a system with a very low concentration of capsules on the surface, such that a single micro-carrier typically encounters only one other carrier at a given instant of time.Fig. 10a shows the initial setup involving the two nanoparticle-filled micro-carriers; the separation between the centers of mass of the capsules is 10R, where R is the capsule's radius. The capsule on left was deformed in the same way as shown in Fig. 1. The capsule on the right was deformed in an analogous manner, with the external force being applied to the right side of the carrier. Thus, in the deformed state, the two capsules form mirror images of each other (with respect to the (y,z) plane).
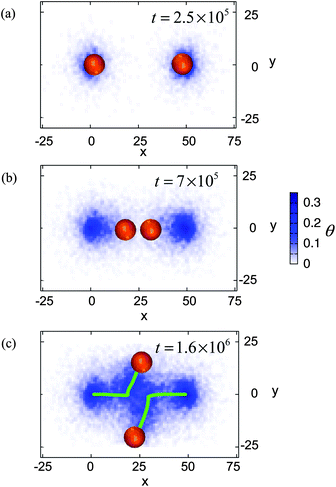 | ||
| Fig. 10 Top down view of two moving capsules. The initial distance between the centers of mass of the capsules is 10R. Time is marked in the frames. The color bar indicates the density of the nanoparticles deposited on the substrate. Green lines in (c) indicate the motion of the centers of mass of the capsules. | ||
When the applied forces are removed (at t = tdef = 2 × 10⁵), the capsule on the left moves to the right and the capsule on the right moves to the left; that is, the two capsules move towards each other. At time t ≈ 7 × 10⁵, the capsules are in close contact, as seen in Fig. 10b. Each capsule is now blocked from moving along its previously directed path. In their attempt to continue moving after t ≈ 7 × 10⁵, the capsules do not retrace their steps because the area behind them is less adhesive than the region between them (see color bar in Fig. 10). Rather, as can be seen in the movie in the Supplementary Information, the pair rotates about a central point until they are each at an angle to their original path. Then, they each move in the direction of greater adhesion, i.e., a relatively bare part of the surface. In effect, the particles swerve out of each other's way and move onto more adhesive regions on the surface. The green lines in Fig. 10c mark the trajectory of their paths. Notably, after t = 1.6 × 10⁶, each capsule moves in a directed manner along this new course.
The above example illustrates that two deformed capsules can adjust their paths due to their mutual interactions. It is worth briefly noting the behavior in the case where one of the capsules (e.g., the capsule on the right) does not contain or does not release nanoparticles, and thus is stationary. In that case, the self-propelled capsule coming from the left approaches the “passive” one, and then, pushes this capsule in front of it. This situation, however, is unstable and eventually, the pair decouples. The self-propelled capsule keeps moving along and the empty capsule remains at rest.
IV. Conclusions
We used computational modeling to design a capsule or synthetic “cell” that responds to mechanical stimulation by undergoing spontaneous motion. Furthermore, the capsule maintains its directed motion by responding to self-generated chemical changes in the environment. Namely, this capsule created its own adhesion gradient on the surface and carried out the appropriate haptotactic motion (moving along the chemical gradient on the substrate). The fundamental system considered here, a nanoparticle-releasing micro-carrier, can be readily fabricated13–18 and the mechanically induced release of the nanoparticles can also be experimentally achieved.19 Thus, the building blocks for creating this system are already in place. Our findings revealed that this purely synthetic system is capable of basic cellular behavior: (1) changing its environment, (2) sensing this change and (3) responding to the change by initiation of self-sustained motion.This synthetic system also captured salient features of specific biological cells, the keratocytes. In particular, both systems change from symmetric to asymmetric morphologies in response to external cues, and pursue a directed path that is dictated by this asymmetric shape. Furthermore, both the biological cells and synthetic capsules sense chemical signals in the environment and move in response to those signals.
Our findings revealed two particularly notable features of the self-propelled capsules. First, the capsules continued to move in the direction that was imposed by the initial mechanical deformation or chemical stimuli. Though the released nanoparticles are undergoing stochastic motion, the original “push” that set the capsule in motion is sufficient to establish its trajectory. This behavior is due to the fact that the newly released nanoparticles reinforce and propagate the adhesion gradient created by the initial perturbation and thus, provide a continuous driving force for the capsule to move in a directed path.
Also notable is the observation that both tdef, the length of time during which the capsule is deformed, and Kthresh, the threshold curvature, control the dynamic behavior of the capsules. The phase map in Fig. 6 pinpoints how the system responds to changes in these parameters and thus, provides useful guidelines for tailoring the performance of the system.
It is noteworthy that a phase-field model, which couples the mass density of the capsules and the concentration of the nanoparticles, can capture the salient features of simulations of three-dimensional capsules in solution. Taken together, the results can facilitate the fabrication of microscopic objects that can be used in a range of applications within microfluidic devices, where the self-sustained motion could be exploited to transport cargo in the microchambers or act as microscale actuators. The capsules could also serve as sensors for mechanical strain, indicating the presence of strain fields by their spontaneous motion and can be used, for example, in self-healing materials capable of delivering healing agents to damaged areas via a three-dimensional microvascular network.
Finally, we showed an illustrative example indicating that two capsules can effectively interact with each other through the trail of deposited nanoparticles. In future studies, we will consider other scenarios involving multiple mechano-responsive capsules.
Acknowledgements
ACB gratefully acknowledges financial support from DOE. This research was supported in part by the National Science Foundation through TeraGrid resources provided by NCSA under grant number TG-DMR100027 and by the Center of Simulation and Modeling of the University of Pittsburgh. The work of I.S.A. was supported by the U.S. Department of Energy, Office of Basic Energy Sciences, Division of Materials Science and Engineering, under Contract DEAC02-06CH11357.References
- S. Li, P. Butler, Y. Wang, Y. Hu, D. C. Han, S. Usami, J. L. Guan and S. Chien, Proc. Natl. Acad. Sci. U. S. A., 2002, 99, 3546–3551 CrossRef CAS.
- C. M. Lo, H. B. Wang, M. Dembo and Y. L. Wang, Biophys. J., 2000, 79, 144–152 CrossRef CAS.
- S. J. Ebbens and J. R. Howse, Soft Matter, 2010, 6, 726–738 RSC.
- A. Snezhko, M. Belkin, I. S. Aranson and W. K. Kwok, Phys. Rev. Lett., 2009, 102, 118103 CrossRef CAS.
- R. F. Ismagilov, A. Schwartz, N. Bowden and G. M. Whitesides, Angew. Chem., Int. Ed., 2002, 41, 652–654 CrossRef CAS.
- R. Dreyfus, J. Baudry, M. L. Roper, M. Fermigier, H. A. Stone and J. Bibette, Nature, 2005, 437, 862–865 CrossRef CAS.
- T. Toyota, N. Maru, M. M. Hanczyc, T. Ikegami and T. Sugawara, J. Am. Chem. Soc., 2009, 131, 5012–5013 CrossRef CAS.
- A. Snezhko, E. Ben Jacob and I. S. Aranson, New J. Phys., 2008, 10, 043034 Search PubMed.
- G. V. Kolmakov, V. V. Yashin, S. P. Levitan and A. C. Balazs, Proc. Natl. Acad. Sci. U. S. A., 2010, 107, 12417–12422 CrossRef CAS.
- C. S. Peyratout and L. Dähne, Angew. Chem., Int. Ed., 2004, 43, 3762–3783 CrossRef.
- B. M. Discher, Y. Y. Won, D. S. Ege, J. C. M. Lee, F. S. Bates, D. E. Discher and D. A. Hammer, Science, 1999, 284, 1143–1146 CrossRef.
- R. A. L. Jones, Nat. Mater., 2004, 3, 209–210 CrossRef CAS.
- D. A. Hammer, G. P. Robbins, J. B. Haun, J. J. Lin, W. Qi, L. A. Smith, P. P. Ghoroghchian, M. J. Therien and F. S. Bates, Faraday Discuss., 2008, 139, 129–141 RSC.
- E. G. Bellomo, M. D. Wyrsta, L. Pakstis, D. J. Pochan and T. J. Deming, Nat. Mater., 2004, 3, 244–248 CrossRef CAS.
- Y. J. Ma, W. F. Dong, M. A. Hempenius, H. Mohwald and G. J. Vancso, Nat. Mater., 2006, 5, 724–729 CrossRef CAS.
- G. B. Sukhorukov, A. A. Antipov, A. Voigt, E. Donath and H. Mohwald, Macromol. Rapid Commun., 2001, 22, 44–46 CrossRef CAS.
- D. G. Shchukin, M. Zheludkevich, K. Yasakau, S. Lamaka, M. G. S. Ferreira and H. Mohwald, Adv. Mater., 2006, 18, 1672–1678 CrossRef CAS.
- M. L. Zheludkevich, D. G. Shchukin, K. A. Yasakau, H. Mohwald and M. G. S. Ferreira, Chem. Mater., 2007, 19, 402–411 CrossRef CAS.
- P. A. L. Fernandes, M. Delcea, A. G. Skirtach, H. Möhwald and A. Fery, Soft Matter, 2010, 6, 1879–1883 RSC.
- K. Keren, Z. Pincus, G. M. Allen, E. L. Barnhart, G. Marriott, A. Mogilner and J. A. Theriot, Nature, 2008, 453, 475–480 CrossRef CAS.
- A. Sokolov, M. M. Apodaca, B. A. Grzybowski and I. S. Aranson, Proc. Natl. Acad. Sci. U. S. A., 2010, 107, 969–974 CrossRef CAS.
- G. Mahmud, C. J. Campbell, K. J. M. Bishop, Y. A. Komarova, O. Chaga, S. Soh, S. Huda, K. Kandere-Grzybowska and B. A. Grzybowski, Nat. Phys., 2009, 5, 606–612 CrossRef CAS.
- Y. Hiratsuka, M. Miyata, T. Tada and T. Q. P. Uyeda, Proc. Natl. Acad. Sci. U. S. A., 2006, 103, 13618–13623 CrossRef CAS.
- K. S. Toohey, N. R. Sottos, J. A. Lewis, J. S. Moore and S. R. White, Nat. Mater., 2007, 6, 581–585 CrossRef CAS.
- G. V. Kolmakov, R. Revanur, R. Tangirala, T. Emrick, T. P. Russell, A. J. Crosby and A. C. Balazs, ACS Nano, 2010, 4, 1115–1123 CrossRef CAS.
- A. Bhattacharya, O. B. Usta, V. V. Yashin and A. C. Balazs, Langmuir, 2009, 25, 9644–9647 CrossRef CAS.
- A. Alexeev, R. Verberg and A. C. Balazs, Macromolecules, 2005, 38, 10244–10260 CrossRef CAS.
- R. Verberg, A. T. Dale, P. Kumar, A. Alexeev and A. C. Balazs, J. R. Soc. Interface, 2007, 4, 349–357 CrossRef CAS.
- G. A. Buxton, R. Verberg, D. Jasnow and A. C. Balazs, Phys. Rev. E, 2005, 71, 056707 CrossRef.
- A. Alexeev, R. Verberg and A. C. Balazs, Phys. Rev. Lett., 2006, 96, 148103 CrossRef.
- A. Alexeev and A. C. Balazs, Soft Matter, 2007, 3, 1500–1505 RSC.
- O. B. Usta, A. Alexeev and A. C. Balazs, Langmuir, 2007, 23, 10887–10890 CrossRef CAS.
- A. Alexeev, R. Verberg and A. C. Balazs, Langmuir, 2007, 23, 983–987 CrossRef CAS.
- A. J. C. Ladd, J. H. Kinney and T. M. Breunig, Phys. Rev. E, 1997, 55, 3271–3275 Search PubMed.
- G. A. Buxton, C. M. Care and D. J. Cleaver, Modell. Simul. Mater. Sci. Eng., 2001, 9, 485–497 CrossRef.
- S. Succi, The Lattice Boltzmann Equation for Fluid Dynamics and Beyond, Clarendon Press, Oxford, 2001 Search PubMed.
- R. Verberg, A. Alexeev and A. C. Balazs, J. Chem. Phys., 2006, 125, 224712 CrossRef.
- R. Verberg, J. M. Yeomans and A. C. Balazs, J. Chem. Phys., 2005, 123, 224706 CrossRef.
- P. Szymczak and A. J. C. Ladd, Phys. Rev. E, 2003, 68, 036704 CrossRef CAS.
- H. C. Ottinger, Stochastic Processes in Polymeric Fluids, Springer: Berlin, 1996 Search PubMed.
- To this end, at each time step Δt, we add ΔNp = 500 × Pnanoparticles to the interior of the capsules, where P is the permeability of the capsule's shell.
- A. Bhattacharya and A. C. Balazs, Phys. Rev. E, 2010, 82, 021801 CrossRef.
- A. A. Antipov, G. B. Sukhorukov, E. Donath and H. Mohwald, J. Phys. Chem. B, 2001, 105, 2281–2284 CrossRef CAS.
- H. Ai, S. A. Jones, M. M. de Villiers and Y. M. Lvov, J. Controlled Release, 2003, 86, 59–68 CrossRef CAS.
- X. Qiu, S. Leporatti, E. Donath and H. Mohwald, Langmuir, 2001, 17, 5375–5380 CrossRef CAS.
- O. B. Usta, A. Alexeev, G. Zhu and A. C. Balazs, ACS Nano, 2008, 2, 471–476 CrossRef CAS.
- O. B. Usta, M. Nayhouse, A. Alexeev and A. C. Balazs, J. Chem. Phys., 2008, 128, 235102 CrossRef.
- A. Cali, S. Succi, A. Cancelliere, R. Benzi and M. Gramignani, Phys. Rev. A: At., Mol., Opt. Phys., 1992, 45, 5771–5774 Search PubMed.
- M. Meyer, M. Desbrun, P. Schroeder, and A. H. Barr, in: Visualization and Mathematic, ed. H.-C. Hege and K. Polthier, Vol. III, pp. 35–57, Springer-Verlag, Heidelberg, 2003 Search PubMed.
- O. V. Manyuhina, J. J. Hetzel, M. I. Katsnelson and A. Fasolino, Eur. Phys. J. E, 2010, 32, 223–228 Search PubMed.
- A. Alexeev, R. Verberg and A. C. Balazs, Soft Matter, 2006, 2, 499–509 RSC.
- A. Fery, F. Dubreuil and H. Mohwald, New J. Phys., 2004, 6, 18 CrossRef.
- F. Dubreuil, N. Elsner and A. Fery, Eur. Phys. J. E, 2003, 12, 215–221 CrossRef CAS.
- N. Elsner, F. Dubreuil, R. Weinkamer, M. Wasicek, F. D. Fischer and A. Fery, Prog. Colloid Polym. Sci., 2006, 132, 117–123 CAS.
- We note that the Young's modulus of the membrane can be tailored by varying the salt concentration in the solution,56 or the solvent temperature.57.
- J. Heuvingh, M. Zappa and A. Fery, Langmuir, 2005, 21, 3165–3171 CrossRef CAS.
- R. Mueller, K. Kohler, R. Weinkamer, G. Sukhorukov and A. Fery, Macromolecules, 2005, 38, 9766–9771 CrossRef CAS.
- H. A. Stone, A. D. Stroock and A. Ajdari, Annu. Rev. Fluid Mech., 2004, 36, 381–411 CrossRef.
- E. F. Krasik and D. A. Hammer, Biophys. J., 2004, 87, 2919–2930 CrossRef CAS.
- C. Dong, J. Cao, E. J. Struble and H. H. Lipowsky, Ann. Biomed. Eng., 1999, 27, 298–312 CrossRef CAS.
- S. Jadhav, C. D. Eggleton and K. Konstantopoulos, Biophys. J., 2005, 88, 96–104 CAS.
- D. Y. Shao, W. J. Rappel and H. Levine, Phys. Rev. Lett., 2010, 105, 108104 Search PubMed.
- C. A. Chung and C.-Y. Chen, J. Theor. Biol., 2009, 261, 610–625 CrossRef CAS.
- R. T. Tranquillo, S. H. Zigmond and D. A. Lauffenburger, Cell Motil. Cytoskeleton, 1988, 11, 1–15 CrossRef CAS.
- G. Maheshwari and D. A. Lauffenburger, Microsc. Res. Tech., 1998, 43, 358–368 CrossRef CAS.
- J. Solon, P. Streicher, R. Richter, F. Brochard-Wyart and P. Bassereau, Proc. Natl. Acad. Sci. U. S. A., 2006, 103, 12382–12387 CrossRef CAS.
- O. Kuksenok, R. D. M. Travasso, P. Dayal, and A. C. Balazs, in: Encyclopedia of Polymer Blends. Vol. 1: Fundamentals, ed. A. Isayev, pp. 269–306, Wiley-VCH Verlag, Weinheim, 2009 Search PubMed.
- I. S. Aranson and L. S. Tsimring, Phys. Rev. E, 2001, 64, 020301 Search PubMed.
- I. S. Aranson, V. A. Kalatsky and V. M. Vinokur, Phys. Rev. Lett., 2000, 85, 118–121 Search PubMed.
- J. P. Boyd, Chebyshev and Fourier Spectral Methods, Dover Publications Inc, Mineola, New York, 2001 Search PubMed.
| This journal is © The Royal Society of Chemistry 2012 |
