DOI:
10.1039/D5CE00013K
(Paper)
CrystEngComm, 2025,
27, 1185-1205
Construction of lacunary α-K8SiW11O39 polyoxometalate/MIL-101(Cr) MOF/CoFe2O4 magnetic nanocomposites for adsorptive removal of toxic azo dyes and antibiotics from wastewater†
Received
4th January 2025
, Accepted 14th January 2025
First published on 21st January 2025
Abstract
In this work, a ternary magnetic nanocomposite based on the MIL-101(Cr) metal–organic framework hybridized with lacunary Keggin-type polyoxometalate (α-K8SiW11O39·13H2O; LPOM) and cobalt ferrite nanoparticles (CoFe2O4; CFO) as a magnetic component was synthesized through a hydrothermal route. The ternary magnetic nanocomposite with the feature LPOM@MIL-101(Cr)/CFO was characterized via FT-IR, XRD, Raman, FE-SEM, EDX, TEM, VSM, zeta potential, BET, TGA, and UV-vis spectroscopy. The results confirmed that heteropolyanions were successfully encapsulated in MIL-101(Cr) cavities. The surface area and pore volume in the ternary magnetic nanocomposite have been significantly decreased compared to the metal–organic framework due to the integration of polyoxometalate and cobalt ferrite nanoparticles. The ability of the ternary magnetic nanocomposite to remove organic dyes methylene blue (MB), rhodamine B (RhB), and methyl orange (MO) and antibiotic drug ciprofloxacin (CIP) from aqueous solutions was investigated. The ternary magnetic nanocomposite revealed effective CIP drug adsorption. Additionally, it demonstrated rapid and selective adsorption for cationic dyes from the mixed dye solutions of MB/MO, MB/RhB, RhB/MO, and MB/RhB/MO. In comparison with its single and double components, the ternary magnetic LPOM@MIL-101(Cr)/CFO nanocomposite demonstrated superior adsorption performance. The adsorption process followed both the pseudo-second-order model and the Langmuir model, indicating that the reaction was spontaneous and achieved a maximum adsorption capacity of 103 and 64 mg g−1 for MB and CIP pollutants. Electrostatic attraction was found to be the primary driving force behind the adsorption process, and the material retained 95% of its maximum adsorption capacity even after four cycles. The magnetic nanocomposite LPOM@MIL-101(Cr)/CFO is easily separated using a magnet and recycled without any change in the structure.
1. Introduction
The main contaminants in aquatic environments are organic dyes, which frequently enter water bodies through wastewater discharge.1 These dyes can remain in the environment for extended periods and may contaminate the food chain, threatening the health of humans and other organisms.2 Industries such as textiles, inks, plastics, cosmetics, paints, and varnishes are significant contributors to dye pollution in water supplies.3,4 The harmful, cancer-causing, and mutagenic characteristics of these dyes pose serious risks to ecosystems.5 Additionally, the pharmaceutical sector is a considerable source of pollution, with its effluents adversely impacting the environment.6 Antibiotics, essential for treating diseases in humans and animals, are often detected in sewage treatment plants, raising concerns about their environmental effects.7,8 Ciprofloxacin (CIP), a commonly used fluoroquinolone antibiotic, is particularly worrisome due to its potential to foster antibiotic-resistant bacteria in water sources, thereby endangering human health.9–11 Consequently, it is vital to develop effective strategies for removing these pollutants from wastewater.12,13 Various methods have been suggested to tackle dye pollution, including reverse osmosis, chemical coagulation/flocculation, biological treatments, membrane filtration, light degradation, and adsorption.14–18 Although each technique has its pros and cons, adsorption is the most widely used and cost-effective method for eliminating dye effluents from water sources.19–21
Polyoxometalates (POMs) are notable metal oxide clusters that exhibit high electronegativity, significant surface charge density, outstanding redox activity, and the ability to be tailored in shape and size.22–24 However, their high solubility often necessitates the immobilization of POMs on support materials for adsorption applications, complicating processes such as separation and recycling. Furthermore, their limited surface area (less than 10 m2 g−1) and propensity for agglomeration result in a deficiency of exposed active sites, which hinders their intrinsic activity.25,26 To overcome these limitations, researchers have investigated the immobilization of POMs onto solid supports to produce hybrid materials. A variety of materials, including titania, zirconia, activated carbon, silica, Fe2O3, graphene, Al2O3, UiO-66, and other metal–organic frameworks (MOFs), have been employed in the creation of these hybrids.27–30 Recently, numerous support options, such as carbon materials, molecular sieves, and metal oxides, have been examined for loading POMs.31,32 Nevertheless, challenges persist, including uneven distribution of POMs and the potential for metal ion leaching or shedding, which underscores the importance of selecting an appropriate support to enhance adsorption efficiency.
Metal–organic frameworks (MOFs) are crystalline substances distinguished by their orderly porous structures, which arise from the self-assembly of metal ions (or clusters) and organic ligands.33 These materials possess outstanding porosity, diverse structural characteristics, and plentiful unsaturated metal sites, rendering them highly effective for adsorbing or eliminating pollutants from air and water.34–36 Despite extensive investigations into MOFs for dye adsorption, their performance remains less than ideal due to several challenges: the disparity between the sizes of dye molecules and MOF pore dimensions restricts the efficient use of internal space, and certain MOFs can degrade into organic compounds or metal ions under strongly acidic or alkaline conditions.37,38 As a result, researchers are increasingly turning their attention to functionalizing MOFs, modifying pore sizes, and developing composite materials to improve their adsorption capacity, selectivity, and kinetics. Among the various MOFs, MIL-101(Cr) is particularly notable, featuring two hydrophilic zeotypic cavities with pore sizes of 29 Å and 34 Å, along with an exceptionally high specific surface area (SBET of around 4000 m2 g−1).39–44 The significant porosity and large surface areas of MOFs make them attractive matrices for encapsulating polyoxometalates (POMs).45–50 Over the last two decades, a wide array of hybrid materials combining MIL-101(Cr) with various POMs has been created and explored for applications in organic reactions, electrocatalytic processes, photocatalytic reactions, and dye adsorption.51,52
In this study, we have successfully developed a magnetically recoverable ternary nanocomposite adsorbent, LPOM@MIL-101(Cr)/CFO, by integrating lacunary Keggin-type SiW11O398− polyanions (LPOM) with the metal–organic framework MIL-101(Cr) and magnetic CoFe2O4 (CFO) nanoparticles using a hydrothermal method. This nanocomposite was employed to effectively remove a range of organic dyes, including methylene blue, rhodamine B, and methyl orange, as well as the antibiotic ciprofloxacin from aqueous solutions. We evaluated the impact of several factors, such as contact time, initial dye concentration, adsorbent dosage, solution pH, temperature, and the recyclability of the adsorbent. Additionally, we performed adsorption kinetics and isotherm studies to further understand the system, along with an investigation into the nanocomposite's performance in removing ciprofloxacin at varying concentrations and adsorbent dosages. The study also evaluated the recyclability and stability of the nanomaterial. Notably, the hybrid nanomaterial demonstrated selective adsorption capabilities and exhibited significantly higher adsorption rates for the cationic dyes MB and RhB compared to using the MIL-101 framework alone.
2. Experimental section
2.1. Materials
The following chemicals were purchased from Merck Company for use in the experiment: sodium metasilicate nonahydrate (Na2SiO3·9H2O, 98%), sodium tungstate dihydrate (Na2WO4·2H2O, 98%), chromium(III) nitrate nonahydrate (Cr(NO3)3·9H2O, 98%), terephthalic acid (C8H6O4, TPA, H2BDC, ≥98%), cobalt(II) nitrate hexahydrate (Co(NO3)2·6H2O, ≥99%), iron(III) nitrate nonahydrate (Fe(NO3)3·9H2O, 99%), potassium chloride (KCl, ≥99.5%), hydrochloric acid (HCl, 37%), sodium hydroxide (NaOH, ≥98%), dimethyl formamide (C3H7NO, 99%), ethanol (C2H5OH, ≥99.9%), methanol (CH3OH, ≥99.9%), acetone (C3H6O, ≥99.8%), MB (C16H18ClN3S, 99%), RhB (C28H31ClN2O3, 98%), and MO (C14H14N3NaO3S, 98%). The ciprofloxacin drug (C17H18FN3O3, ≥98%) was purchased from Sigma-Aldrich (USA).
2.2. Synthesis of Keggin-type LPOM: α-K8SiW11O39·13H2O
The α-K8SiW11O39·13H2O compound was synthesized according to a method reported in the scientific literature.53 A 1.10 g sample of sodium metasilicate nonahydrate (Na2SiO3·9H2O) was dissolved in 10 mL of distilled water and stirred for 30 min at room temperature. The solution was then filtered. Separately, 18.20 g of sodium tungstate dihydrate (Na2WO4·2H2O) was dissolved in 30 mL of boiling distilled water. This solution was then added to the filtered sodium metasilicate solution, followed by the addition of 5 ml of 4 mol L−1 HCl. The mixture was stirred using a magnetic stirrer for one hour. After cooling to room temperature, 15 g of KCl was added and the mixture was boiled while stirring continuously for another hour. The resulting white precipitate was isolated by filtration and washed twice, first with 5 mL of 1 mol L−1 KCl solution and then with 5 mL of cold distilled water. Finally, the product was dried in an oven.
2.3. Synthesis of the MIL-101(Cr) MOF
MIL-101(Cr) was successfully prepared via a hydrothermal approach as follows.54 Terephthalic acid (1.50 g) and Cr(NO3)3·9H2O (2.50 g) were dissolved in 30 mL of distilled water and stirred magnetically at room temperature for 20 min. This solution was then transferred to a 50 ml Teflon-lined autoclave and heated at 200 °C for 24 hours. The resulting green precipitate was isolated by centrifugation, followed by dissolution in DMF solvent at 60 °C for three hours. After cooling to room temperature, the precipitate was collected by centrifugation, washed with ethanol, and dried at room temperature.
2.4. Synthesis of CoFe2O4 (CFO) nanoparticles
Cobalt ferrite nanoparticles were successfully prepared via a hydrothermal approach.55 To produce cobalt ferrite, 30 mL of distilled water was combined with 2.48 g of Co(NO3)2·6H2O and 6.84 g of Fe(NO3)3·9H2O, mixing them using magnetic forces for 30 min. The pH was subsequently adjusted to 11–12 by adding a 4 mol L−1 NaOH solution. The resultant mixture was then transferred to a 50 mL Teflon-lined autoclave and heated at 180 °C for 12 h. After cooling to room temperature, the black precipitate obtained was collected, washed with purified water, and then dried in an oven.
2.5. Synthesis of α-K8SiW11O39@MIL-101(Cr) (LPOM@MIL-101)
A binary LPOM@MIL-101(Cr) nanocomposite was synthesized via a hydrothermal method. A dark blue solution was prepared by dissolving 2 g of Cr(NO3)3·9H2O, 1 g of terephthalic acid, and 2 g of α-K8SiW11O39·13H2O in 30 mL of distilled water under magnetic stirring for 30 min at room temperature. This solution was transferred to a 50 ml Teflon-lined autoclave and heated at 200 °C for 24 h in an oven. After centrifugation, the resulting green powder was thoroughly washed with ethanol, acetone, and distilled water to remove any impurities and finally dried at room temperature.
2.6. Synthesis of CoFe2O4/MIL-101(Cr) (CFO/MIL-101(Cr))
A binary magnetic CFO/MIL-101(Cr) nanocomposite was synthesized using a hydrothermal method. Initially, 0.18 g of synthetic CFO was mixed with 30 mL of filtered water and allowed to sonicate at room temperature for 30 min. Subsequently, 1.50 g of Cr(NO3)3·9H2O and 0.52 g of terephthalic acid were added to the CFO mixture, which was then stirred vigorously for 30 min at room temperature. The resulting mixture was autoclaved at 200 °C for 15 h in a 50 mL Teflon-lined container. After cooling to room temperature, the sediment was extracted using a magnet and thoroughly washed several times with distilled water, DMF, and ethanol to eliminate any residual terephthalic acid from the surface.
2.7. Synthesis of the magnetic LPOM@MIL-101/CFO ternary nanocomposite
The magnetic LPOM@MIL-101(Cr)/CFO ternary nanocomposite was prepared via a hydrothermal method. Initially, 0.21 g of synthetic CoFe2O4 was sonicated in 30 mL of distilled water at room temperature for 30 min. Following this, 1.50 g of α-K8SiW11O39·13H2O (LPOM), 1.50 g of Cr(NO3)3·9H2O, and 0.68 g of terephthalic acid were incorporated into the sonicated CoFe2O4 aqueous solution. The resulting mixture was then stirred vigorously at room temperature for one hour. Afterward, it was heated to 200 °C for a time of 18 h inside a 50 mL Teflon-lined autoclave. Once the mixture cooled to room temperature, the solid residue was extracted using a magnet. The residue was thoroughly rinsed with distilled water, DMF, and ethanol to eliminate any residual terephthalic acid. This entire synthesis process is illustrated in Scheme 1. The ICP analysis indicated that the mass percentages of W, Co, and Fe in the LPOM@MIL-101/CFO ternary nanocomposite are roughly 20.84, 3.85, and 7.32%, respectively. As a result, the mass percentages of the LPOM and CFO components in the nanocomposite are estimated to be 33.20 and 15.35%, respectively.
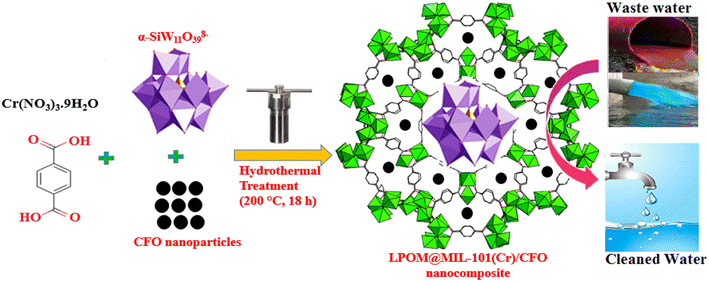 |
| | Scheme 1 Preparation process of the LPOM@MIL-101(Cr)/CFO nanocomposite for removing dyes and antibiotic drugs from aqueous solutions. | |
2.8. Characterization methods
FT-IR spectra were recorded on a Shimadzu-8400S spectrometer (Japan) within the wavenumber range of 400–4000 cm−1. UV-vis spectra were obtained using a Cary 100 Varian spectrophotometer (USA). Powder X-ray diffraction (XRD) patterns were generated with Ni-filtered Cu K radiation (λ = 1.5406 Å) on an X'pert pro PANalytical instrument (The Netherlands). Raman spectra were recorded using a 532 nm laser (TAKRAM N1-541, Teskan, Iran). Field emission scanning electron microscopy (FE-SEM) images were captured with a microscope (MIRA3 TESCAN, Czech Republic) equipped with energy-dispersive X-ray (EDX) capability. Transmission electron microscopy (TEM) images were taken on an EM10C electron microscope operating at a voltage of 100 kV. Magnetic measurements were conducted using a vibrating sample magnetometer (VSM, MDKFD, Daneshpajoh Kashan, Iran). Zeta potential was evaluated with a HORIBA-SZ100 (Japan). The Brunauer–Emmett–Teller (BET) surface area was determined from N2 adsorption measurements at 77 K using a Belsorp Mini II (Japan). Thermogravimetric analysis (TG-DTA) was performed with an SDT Q600 (USA) at a heating rate of 10 °C min−1 in a circulating air atmosphere. Elemental analysis for W, Co, and Fe and the content of LPOM and CFO components in the ternary nanocomposite was determined by inductively coupled plasma atomic emission spectroscopy (ICP-AES, model OEC-730).
2.9. Adsorption experiments of water contaminants
The efficacy of the ternary LPOM@MIL-101(Cr)/CFO magnetic nanocomposite in adsorbing dyes and drugs was evaluated in a 100 mL beaker at a temperature of 25 °C. In the initial trials, a mixture of 30 mL of pollutant solution at a concentration of 25 mg L−1 and 30 mg of the magnetic adsorbent was stirred. At set time intervals, 2 mL samples of the pollutant solution were taken. A magnet was then used to separate the adsorbent from the solution. After separating the adsorbent, UV-vis spectra for the pollutants—MB, RhB, MO, and CIP—were recorded using a spectrophotometer, with maximum absorption wavelengths of 664 nm, 553 nm, 465 nm, and 332 nm, respectively, to determine the residual concentrations. Subsequently, different amounts of the magnetic adsorbent (10, 20, 30, 40, and 50 mg) were introduced to 30 mL of MB and CIP solutions, both at a concentration of 25 mg L−1. The initial pH of the MB solution was adjusted between 2 and 10 by gradually adding 4 M HCl or NaOH. Additionally, the impact of temperature and varying concentrations of MB and CIP on the solutions was examined. The selectivity of the adsorption process was assessed by adding the magnetic adsorbent to binary and ternary systems comprising cationic dyes (MB and RhB) and an anionic dye (MO), such as MB + RhB, MB + MO, RhB + MO, and MB + RhB + MO. The following formulas (eqn (1) and (2) were employed to calculate the adsorption percentage (R%) and adsorption capacity (qe, in mg g−1), where C0 and Ct represent the initial and equilibrium concentrations of the dye and drug in mg L−1, respectively, V (in L) denotes the solution volume, and m (in g) is the mass of the adsorbent.| | | R (%) = (C0 − Ct) × 100/C0 | (1) |
The adsorption kinetic experiments were performed by adding 30 mg adsorbent into 25 mg L−1 MB solution (30 mL) at various vibration times, i.e., 1, 3, 5, 10, 20, 50, 100, and 150 min. The adsorption isotherm tests were performed by mixing 25 mg adsorbent and MB or CIP solution (30 mL) with different initial concentrations, i.e., 50, 75, 100, 125 and 150 mg L−1. And the adsorption thermodynamic tests were performed at different temperatures, 25, 45, 65, and 75 °C using 30 mg of adsorbent.
3. Results and discussion
3.1. FT-IR analysis
Fig. 1 illustrates the FT-IR spectra for the CFO nanoparticles, MIL-101(Cr) MOF, Keggin polyoxometalate salt (LPOM), and their corresponding composites across the 400–4000 cm−1 range. In the FT-IR spectrum for MIL-101(Cr) (Fig. 1(a)), a band at 3421 cm−1 is attributed to the stretching vibration of hydroxyl groups (OH) linked to adsorbed water. Bands at 1681 and 1620 cm−1 are associated with the asymmetric vibrations of the O–C–O group, while bands at 1400 and 582 cm−1 correspond to symmetric stretching of carboxyl groups and stretching vibrations of Cr–O, respectively.56 In the spectrum for LPOM (Fig. 1(b)), the stretching vibration modes of W–Oc–W and W–Ob–W are observed at 721 and 798 cm−1. Additionally, vibrations at 883 and 952 cm−1 are attributed to W![[double bond, length as m-dash]](https://www.rsc.org/images/entities/char_e001.gif) Ot and Si–O, with a peak at 1627 cm−1 reflecting the OH bending vibration of the LPOM polyanion.57,58 CFO nanoparticles in Fig. 1(c) display broad bands at 3382 and 586 cm−1 that are linked to OH group vibrations and M–O bond vibrations, respectively.59 To confirm the incorporation of LPOM and CFO into the MIL-101(Cr) structure and pores, the LPOM@MIL-101(Cr) (Fig. 1(d)), CFO/MIL-101(Cr) (Fig. 1(e)) and LPOM@MIL-101(Cr)/CFO (Fig. 1(f)) nanocomposites were examined using FT-IR spectroscopy. The characteristic bands of MIL-101(Cr) remained largely unchanged after the synthesis. A comparison of the FT-IR spectra for LPOM@MIL-101(Cr), CFO@MIL-101(Cr), and LPOM@MIL-101(Cr)@CFO reveals minor shifts in the peaks of CFO and LPOM components, indicating strong interactions between the CFO, polyanions, and MIL-101(Cr), as seen in the spectra of these three composites.
Ot and Si–O, with a peak at 1627 cm−1 reflecting the OH bending vibration of the LPOM polyanion.57,58 CFO nanoparticles in Fig. 1(c) display broad bands at 3382 and 586 cm−1 that are linked to OH group vibrations and M–O bond vibrations, respectively.59 To confirm the incorporation of LPOM and CFO into the MIL-101(Cr) structure and pores, the LPOM@MIL-101(Cr) (Fig. 1(d)), CFO/MIL-101(Cr) (Fig. 1(e)) and LPOM@MIL-101(Cr)/CFO (Fig. 1(f)) nanocomposites were examined using FT-IR spectroscopy. The characteristic bands of MIL-101(Cr) remained largely unchanged after the synthesis. A comparison of the FT-IR spectra for LPOM@MIL-101(Cr), CFO@MIL-101(Cr), and LPOM@MIL-101(Cr)@CFO reveals minor shifts in the peaks of CFO and LPOM components, indicating strong interactions between the CFO, polyanions, and MIL-101(Cr), as seen in the spectra of these three composites.
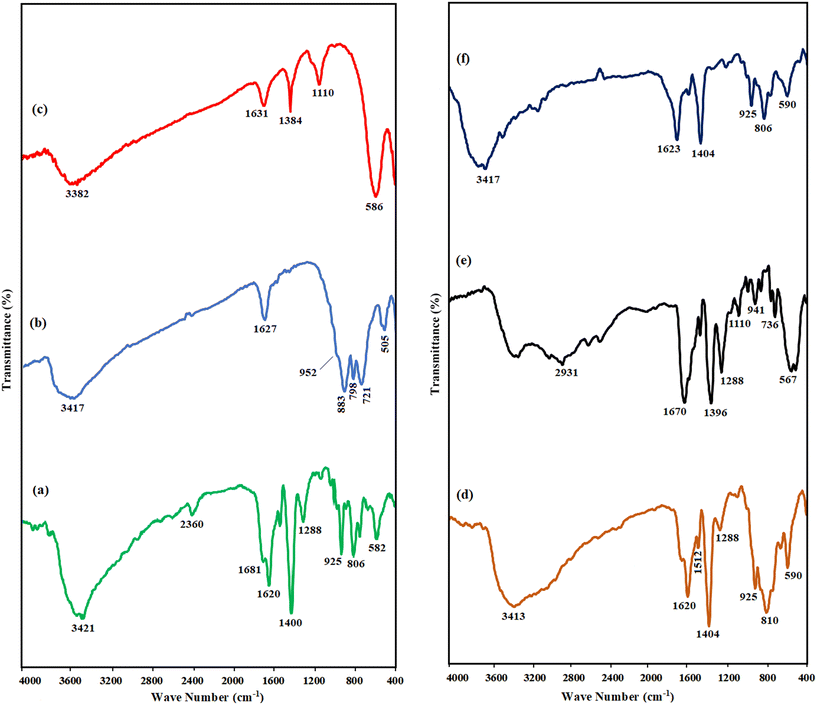 |
| | Fig. 1 FT-IR spectra of (a) MIL-101(Cr), (b) LPOM, (c) CFO, and (d) LPOM@MIL-101(Cr), (e) CFO/MIL-101(Cr) and (f) LPOM@MIL-101(Cr)/CFO nanocomposites. | |
3.2. XRD analysis
The formation of the LPOM@MIL-101(Cr)/CFO nanocomposite was confirmed through XRD analysis. Fig. 2 displays the XRD patterns for various samples, including MIL-101(Cr), LPOM, CFO, LPOM@MIL-101(Cr), CFO/MIL-101(Cr), and LPOM@MIL-101(Cr)/CFO. The XRD patterns showed no signs of impurities, with each diffraction peak aligning well with standard values. The XRD pattern for MIL-101(Cr) in Fig. 2(a) displayed diffraction peaks at 2θ angles of 5.29°, 6.09°, 9.24°, 10.54°, 16.74°, 18.14°, and 19.09°, which were consistent with previously reported values for the MIL-101(Cr) framework.60 The characteristic peaks of LPOM were identified as shown in Fig. 2(b). As indicated in Fig. 2(c), the main peaks for pure CFO were observed at 2θ values of 18.37°, 30.27°, 35.67°, 43.27°, 53.62°, 57.22°, 62.77°, 71.12°, and 74.22°, corresponding to a cubic crystal structure, as per JCPDS card 01-1121.61 The patterns of the different samples indicated that there was no significant difference between the composites and pure MIL-101(Cr). Consequently, the XRD patterns of the MIL-101(Cr), LPOM@MIL-101(Cr) (Fig. 2(d)), CFO/MIL-101(Cr) (Fig. 2(e)), and LPOM@MIL-101(Cr)/CFO (Fig. 2(f)) nanocomposites were largely similar, suggesting that the crystal structure of MIL-101(Cr) remained intact after the incorporation of CFO and LPOM. The low intensity of the LPOM peaks in the nanocomposites likely resulted from the even distribution of LPOM within the porous MIL-101(Cr) structure. Both the XRD pattern and FT-IR spectra of the nanocomposite demonstrated that the inclusion of LPOM and CFO did not compromise the framework of MIL-101(Cr). Therefore, the significant interactions among LPOM, CFO, and MIL-101(Cr) led to noticeable changes in the XRD reflectance intensities of the nanocomposite compared to the pure MIL-101(Cr) framework.
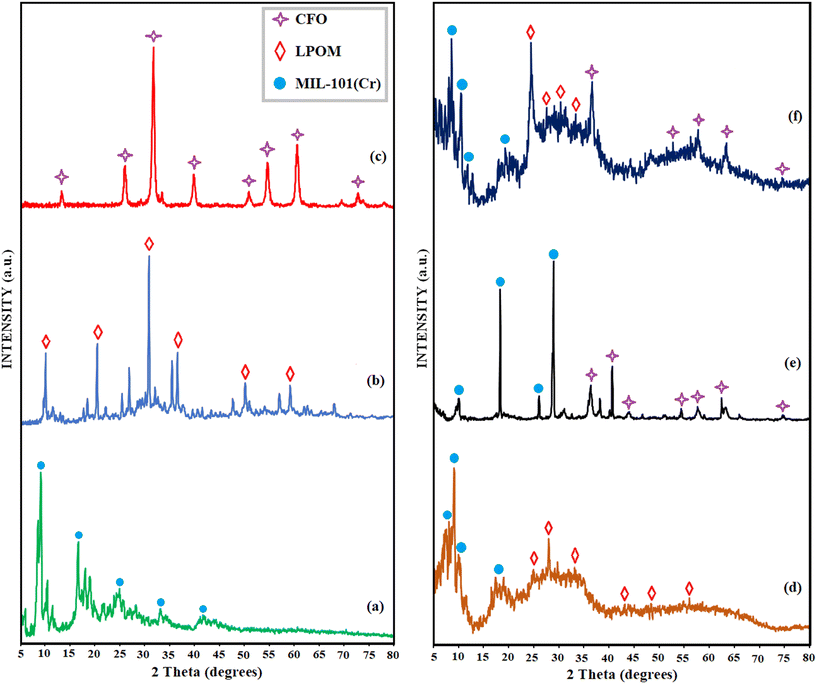 |
| | Fig. 2 XRD patterns of (a) MIL-101(Cr), (b) LPOM, (c) CFO, and (d) LPOM@MIL-101(Cr), (e) CFO/MIL-101(Cr) and (f) LPOM@MIL-101(Cr)/CFO nanocomposites. | |
3.3. Raman analysis
The structural phase of the LPOM@MIL-101(Cr)/CFO nanocomposite and its constituents was analyzed using Raman spectroscopy, as illustrated in Fig. 3(a)–(d). The vibration bands associated with MIL-101(Cr) were detected at 1620, 1470, 1154, and 877 cm−1, corresponding to the aromatic and dicarboxylate groups found in TPA. The asymmetric stretching modes of the W–O–W bonds in the lacunary α-[SiW11O39]8-cluster correspond to two weak features observed in the Raman spectra of LPOM, situated between 620 and 920 cm−1. In contrast, the WOt stretching mode is associated with the two prominent peaks found between 900 and 1000 cm−1.62 Additionally, the bending modes of the W–O–W and O–Si–O bonds correspond to Raman shifts of 526 and 372 cm−1, respectively. The Raman spectrum of the ternary magnetic nanocomposite not only features the iconic bands of MIL-101(Cr) nanoparticles but also reveals three vibrational bands associated with LPOM. Notably, a prominent band at around 1132 cm−1, associated with the symmetric stretching mode of WOt, is clearly visible. Furthermore, the peaks observed at 638, 443, and 353 cm−1 indicate the presence of CoFe2O4 nanoparticles within the nanocomposite.49
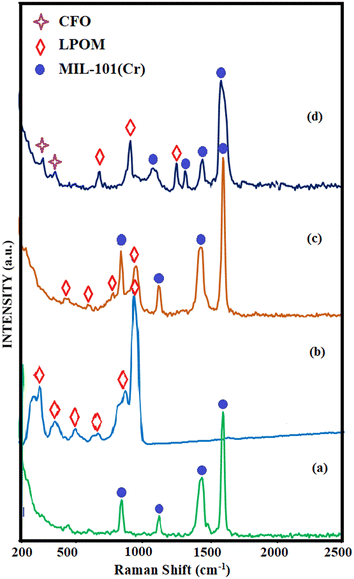 |
| | Fig. 3 FT-Raman spectra of (a) MIL-101(Cr), (b) LPOM, (c) LPOM@MIL-101(Cr), and (d) the LPOM@MIL-101(Cr)/CFO nanocomposite. | |
3.4. FE-SEM analysis
The FE-SEM images of the samples were examined to evaluate their surface morphological structure. In Fig. 4(a) and (b), the images reveal that the MIL-101(Cr) particles consistently display a polyhedral shape, primarily forming octahedral structures with notable porosity. In contrast, as shown in Fig. 4(c) and (d), the LPOM@MIL-101(Cr)/CFO nanocomposite retains a morphology and shape akin to those of the MIL-101(Cr) nanoparticles. However, due to interactions with LPOM and CFO, the distinctive polyhedral features are less pronounced, leading to a reduction in the porosity of MIL-101(Cr).
 |
| | Fig. 4 FE-SEM images of (a and b) the MIL-101(Cr) MOF and (c and d) the ternary LPOM@MIL-101(Cr)/CFO magnetic nanocomposite at different magnifications. | |
3.5. EDX analysis
Energy dispersive X-ray (EDX) spectroscopy was utilized to analyze the composition of the ternary magnetic nanocomposite. As depicted in Fig. 5(a), the EDX elemental spectrum indicates the presence of elemental peaks corresponding to K8SiW11O39, MIL-101(Cr), and CoFe2O4, specifically identifying K, Si, W, and O for K8SiW11O39; Cr, C, and O for MIL-101(Cr); and Fe, Co, and O for CoFe2O4. This analysis confirms that the nanocomposite includes LPOM, CFO, and MIL-101(Cr). Additionally, the EDX mapping presented in Fig. 5(b) shows that K, Si, W, O, Cr, C, Fe, and Co elements are uniformly dispersed throughout the nanocomposite. This even distribution supports the notion of a consistent interaction between the LPOM anions and CFO nanoparticles within the MIL-101(Cr) porous framework. The EDX mapping findings are also consistent with the morphological observations made using the FE-SEM technique.
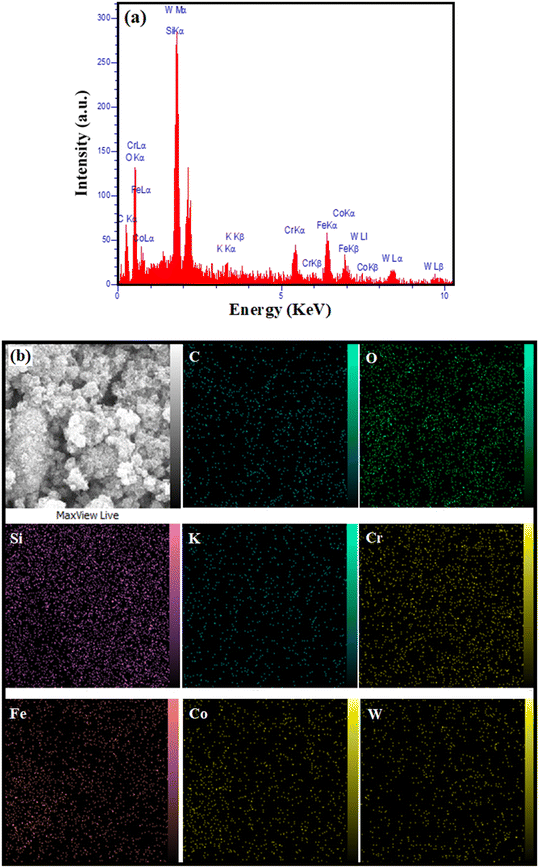 |
| | Fig. 5 (a) EDX spectrum and (b) elemental mappings of the LPOM@MIL-101(Cr)/CFO nanocomposite. | |
3.6. TEM analysis
The morphology and dimensions of the magnetic nanocomposite particles were analyzed using TEM. Fig. 6 displays the TEM images of the LPOM@MIL-101(Cr)/CFO nanocomposite at two different magnifications. These images clearly depict the metal organic networks created by the MIL-101(Cr) and CFO nanoparticles. Furthermore, they show that the LPOM is incorporated within the structure of MIL-101(Cr). These findings are consistent with the particle sizes obtained from FE-SEM, which confirms that the particles are in the 50–100 nm range.
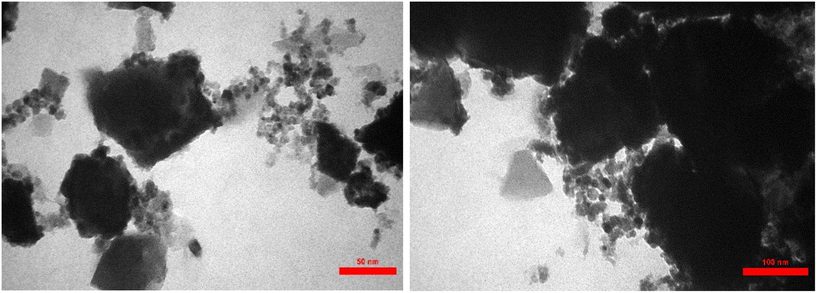 |
| | Fig. 6 TEM images of the LPOM@MIL-101(Cr)/CFO nanocomposite. | |
3.7. Magnetic properties
The magnetic properties of pure CFO, MIL-101(Cr)/CFO, and LPOM@MIL-101(Cr)/CFO samples were evaluated using a vibrating sample magnetometer (VSM), with the magnetic field applied between −14![[thin space (1/6-em)]](https://www.rsc.org/images/entities/char_2009.gif) 000 and +14000 Oe at room temperature. The corresponding hysteresis loops are presented in Fig. 7(a)–(c). The magnetization curves clearly demonstrate that the samples exhibit ferromagnetic properties, as evidenced by their open magnetic hysteresis loops that cross the origin of the coordinate system. The magnetic saturation values (Ms) for pure CFO, MIL-101(Cr)/CFO, and LPOM@MIL-101(Cr)/CFO were measured to be 61.65, 46.83, and 10.18 emu g−1, respectively. Remarkably, the magnetic saturation of the ternary magnetic nanocomposite is about 85% lower than that of pure CFO. This decrease in Ms is linked to the existence of non-magnetic LPOM and MIL-101(Cr) components that surround the magnetic CFO particles, thus reducing their magnetic effectiveness. Nonetheless, the nanocomposite's magnetic saturation allows for its easy extraction from aqueous solutions using a strong magnet, as illustrated in the inset of Fig. 7. Consequently, after being utilized for water pollutant removal, the ternary magnetic nanocomposite can be efficiently separated through magnetic separation techniques.
000 and +14000 Oe at room temperature. The corresponding hysteresis loops are presented in Fig. 7(a)–(c). The magnetization curves clearly demonstrate that the samples exhibit ferromagnetic properties, as evidenced by their open magnetic hysteresis loops that cross the origin of the coordinate system. The magnetic saturation values (Ms) for pure CFO, MIL-101(Cr)/CFO, and LPOM@MIL-101(Cr)/CFO were measured to be 61.65, 46.83, and 10.18 emu g−1, respectively. Remarkably, the magnetic saturation of the ternary magnetic nanocomposite is about 85% lower than that of pure CFO. This decrease in Ms is linked to the existence of non-magnetic LPOM and MIL-101(Cr) components that surround the magnetic CFO particles, thus reducing their magnetic effectiveness. Nonetheless, the nanocomposite's magnetic saturation allows for its easy extraction from aqueous solutions using a strong magnet, as illustrated in the inset of Fig. 7. Consequently, after being utilized for water pollutant removal, the ternary magnetic nanocomposite can be efficiently separated through magnetic separation techniques.
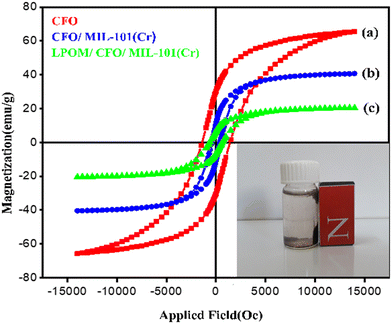 |
| | Fig. 7 Magnetization curves of (a) CFO, (b) CFO/MIL-101(Cr) and (c) the LPOM@MIL-101(Cr)/CFO nanocomposite. | |
3.8. Zeta potential measurements
As shown in Fig. 8(a)–(c), the zeta potentials of MIL-101(Cr) nanoparticles, MIL-101(Cr)/CFO, and the LPOM@MIL-101(Cr)/CFO nanocomposite are recorded at +30.57 mV, +35.21 mV, and −57.87 mV, respectively. This indicates that strong electrostatic interactions between the cationic dye and the adsorbents result in a high efficiency for the removal of the cationic dye. The ternary magnetic nanocomposite, which incorporates LPOM anions into the MIL-101(Cr) framework, demonstrates a notably more negative zeta potential than MIL-101(Cr). This enhanced negativity facilitates the adsorption of more MB cationic dye, while it does not show the same improvement for the adsorption of anionic MO dye. The findings regarding zeta potential and selective adsorption of cationic dyes underscore that the effective adsorption of MB dye by the nanocomposite is primarily due to the electrostatic interactions between the cationic dye molecules and the nanocomposite's high negative charge.63,64
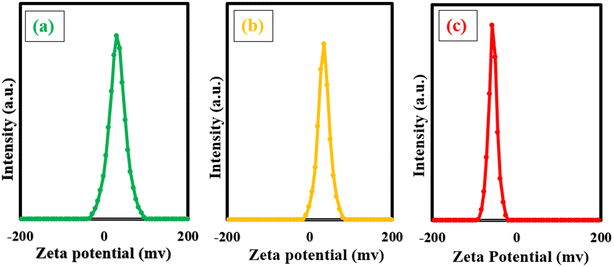 |
| | Fig. 8 Zeta potential curves of (a) MIL-101(Cr), (b) CFO/MIL-101(Cr) and (c) the LPOM@MIL-101(Cr)/CFO nanocomposite in aqueous solutions. | |
3.9. BET analysis
N2 adsorption–desorption experiments were performed to assess the surface areas and pore size distributions of the samples. The materials MIL-101(Cr), LPOM@MIL-101(Cr), and LPOM@MIL-101(Cr)/CFO displayed a combination of isotherm types (I/IV) along with H4-type hysteresis loops, suggesting the presence of both microporous and mesoporous structures.35,38,62 The BJH method confirmed the existence of mesopores in MIL-101(Cr) and illustrated the changes in volume during the encapsulation process, as shown in Fig. 9. A summary of the structural properties of these materials can be found in Table 1. When lacunary Keggin-type POM anions were incorporated into the MOF cages, there was a notable reduction in the surface area, pore volume, and pore diameter of the encapsulated sample compared to pristine MIL-101(Cr). The LPOM polyanions significantly occupy the pores within the LPOM@MIL-101(Cr) nanocomposite, leading to substantial decreases in both volume and surface area. Moreover, the ternary magnetic nanocomposite exhibited an even more severe reduction in surface area, pore volume, and pore diameter compared to the binary version. In the LPOM@MIL-101(Cr)/CFO nanocomposite, the pores are predominantly filled with lacunary Keggin-type POM anions and CFO nanoparticles, which are encapsulated within the MOF cages. These findings indicate that both the LPOM anions and CFO nanoparticles are mainly contained within the channels of MIL-101(Cr) rather than simply being located on its surface. These results suggest that the LPOM anions and CFO nanoparticles are primarily housed within the channels of MIL-101(Cr), rather than merely residing on its surface.
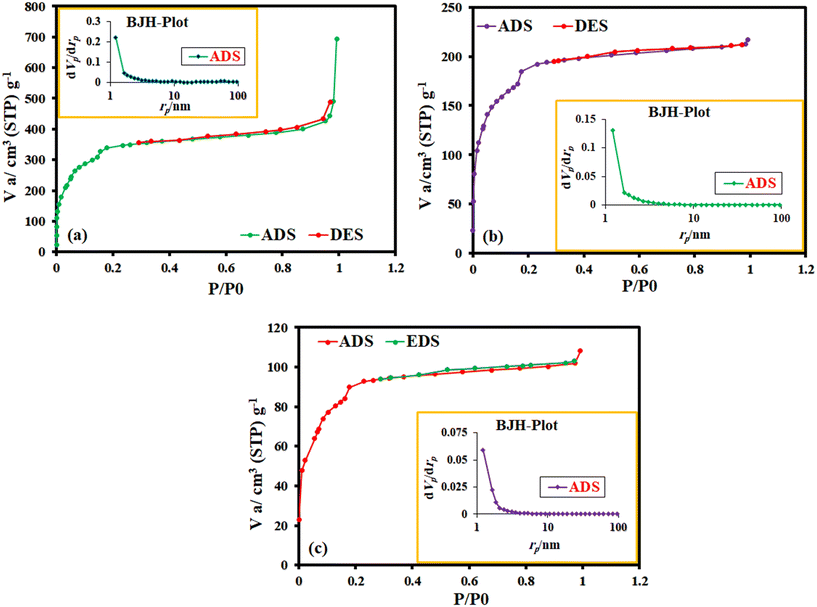 |
| | Fig. 9 Nitrogen adsorption–desorption isotherms and pore size curves (the insets) of (a) MIL-101(Cr), (b) LPOM@MIL-101(Cr) and (c) the LPOM@MIL-101(Cr)/CFO nanocomposite. | |
Table 1 Textural characteristics of samples
| Sample |
BET surface area (m2 g−1) |
Total pore volume (cm3 g−1) |
Mean pore diameter (nm) |
| MIL-101(Cr) |
1129 |
1.0129 |
3.5888 |
| LPOM@MIL-101(Cr) |
643.52 |
0.3345 |
2.0793 |
| LPOM@MIL-101(Cr)/CFO |
322.06 |
0.1667 |
2.0699 |
3.10. Thermal analysis
Thermal analysis (TGA-DTA) was conducted on MIL-101(Cr) and the LPOM@MIL-101(Cr)/CFO nanocomposite, within a temperature range of 20–800 °C under an oxygen atmosphere, at a heating rate of 10 °C min−1. As illustrated in Fig. 10(a) and (b), the ternary magnetic nanocomposite exhibited an initial weight loss of 15.09% in the temperature range of 100–120 °C, attributed to the evaporation of water molecules. A subsequent weight loss of 6.05% occurred in the 200–300 °C range due to the release of organic molecules. Additionally, a third weight loss of 24.46% was observed between 400 and 450 °C, coinciding with the presence of heavy metal oxides, while complete decomposition of the composition occurred between 500 and 800 °C. In contrast, the pristine MIL-101(Cr) experienced a first weight loss of 39.62% at around 200 °C, followed by a second weight loss of 45.26% in the 300–400 °C range, linked to the loss of water and the decomposition of organic molecules, respectively. The DTA curves for both the LPOM@MIL-101(Cr)/CFO nanocomposite and MIL-101(Cr) nanoparticles further demonstrate the exothermic nature of these reactions. Overall, these results indicate that the ternary magnetic nanocomposite exhibits stability at elevated temperatures.
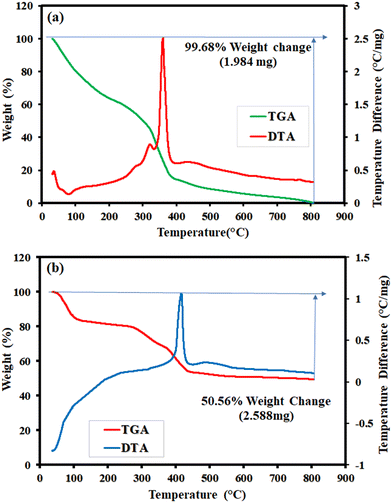 |
| | Fig. 10 TGA-DTA curves of (a) MIL-101(Cr) and (b) the LPOM@MIL-101(Cr)/CFO nanocomposite. | |
3.11. Dye and drug adsorption studies
The efficiency of the LPOM@MIL-101(Cr)/CFO nanocomposite in removing aqueous contaminants was assessed using organic dyes (MB, RhB, MO) and the antibiotic CIP. To quantify the adsorption of these substances, UV-vis spectroscopy was employed, identifying maximum absorption peaks at 664 nm for MB, 553 nm for RhB, 465 nm for MO, and 332 nm for CIP. As illustrated in Fig. 11(a)–(d), the intensity of these peaks diminished over time, signifying a decrease in the concentration of the dyes and drug. The adsorption rates were found to be 100% for MB in 25 min, 84% for RhB in 50 min, 37% for MO in 20 min, and 100% for CIP in 15 min. The presence of negatively charged polyoxometalate within the MIL-101(Cr) framework indicates that the magnetic nanocomposite exhibits weak adsorption characteristics for anionic dyes.
 |
| | Fig. 11 UV-visible spectral changes of dye and drug aqueous solutions with the LPOM@MIL-101(Cr)/CFO nanocomposite: (a) MB, (b) RhB, (c) MO and (d) CIP. Reaction conditions: C0 (dye or drug) = 25 mg L−1, adsorbent dosage = 30 mg in 30 mL solution at ambient temperature. | |
To demonstrate the effectiveness of the ternary magnetic nanocomposite LPOM@MIL-101(Cr)/CFO in removing dye and drug pollutants, each component of the nanocomposite was examined individually. The study involved testing pure LPOM, pristine MIL-101(Cr), and magnetic CFO against cationic dyes MB and RhB, anionic dye MO, and the drug CIP, with results illustrated in Fig. 12 and S1(a)–(l).† According to Fig. 12, the adsorption efficiency of pristine MIL-101(Cr) for the cationic dyes MB and RhB after 25 and 50 min, respectively, was minimal. However, it effectively removed the anionic MO dye in just 20 min, likely due to the cationic nature of the MIL-101(Cr) framework, which enhances its adsorption capability for this dye. The pure LPOM demonstrated an adsorption efficiency of 83% for MB within 25 min and 69% for RhB after 50 min, indicating a lower capacity for RhB that can be attributed to the larger size of its molecules. In contrast, the removal of anionic MO was only 6% within 20 min due to the SiW11O398− anionic structure. Additionally, pristine MIL-101(Cr) and pure LPOM achieved 51% and 41% removal of the CIP drug, respectively, after 15 min. It is noted that the CFO nanoparticles exhibited no adsorption efficiency for any of the dyes or drug, likely due to their limited surface area. Thus, incorporating CFO nanoparticles and Keggin LPOM polyanions within the MIL-101(Cr) framework facilitates magnetic recovery and enhances the adsorption efficiency of cationic dyes and antibiotic drugs, respectively. Further, the apparent difference between the MIL-101 and LPOM@MIL-101(Cr)/CFO was carefully detected and shown in Fig. 12. For LPOM@MIL-101(Cr)/CFO, the concentration of MB and RhB decreases completely in 25–50 minutes, whereas the adsorption of MO is much slower and that the adsorption remains unchanged after several minutes. In contrast, the completely opposite results of MIL-101 are illustrated in Fig. 12. The pristine MIL-101(Cr) exhibits low adsorption efficiency for cationic dyes such as MB and RhB, while demonstrating a high adsorption affinity for the anionic MO dye. A remarkable finding is that the presence of highly electronegative polyoxoanions significantly enhanced the adsorption capacity of the porous material MIL-101 for cationic dyes. This observation, illustrated in Fig. 12, supports the notion that the adsorption mechanism with LPOM@MIL-101(Cr)/CFO is predominantly driven by electrostatic interactions.
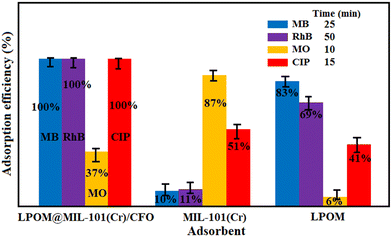 |
| | Fig. 12 The comparison of adsorption capability of pristine MIL-101(Cr) and pure LPOM with the LPOM@MIL-101(Cr)/CFO nanocomposite. Reaction conditions: C0 (dye or drug) = 25 mg L−1, adsorbent dosage = 30 mg in 30 mL solution at ambient temperature. Error bars represent one standard deviation for three measurements. | |
3.11.1. The influence of dye initial concentration on adsorption performance.
The adsorption performance of the MB dye was assessed using the ternary magnetic nanocomposite across various dye concentrations. The experiments involved 30 mg of the adsorbent mixed with 30 mL of MB dye solution at room temperature, tested at different concentrations (25, 50, 75, 100, 125, and 150 mg L−1). As illustrated in Fig. 13(a) and S2(a)–(e),† an increase in the initial dye concentration led to a decrease in dye removal efficiency. This decline can be attributed to the saturation of active sites on the surface of the nanocomposite as the concentration rises. The findings indicate that the LPOM@MIL-101(Cr)/CFO magnetic nanocomposite exhibits a remarkable capability to adsorb MB molecules from water, successfully handling concentrations up to 150 mg L−1.
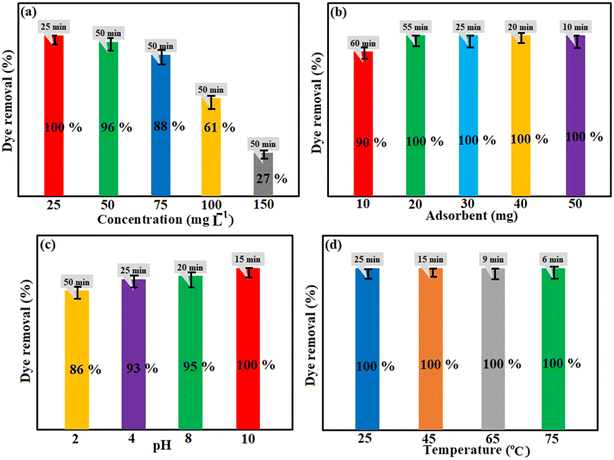 |
| | Fig. 13 The influence of (a) concentration, (b) adsorbent dosage, (c) pH, and (d) temperature on the adsorption of MB dye by the LPOM@MIL-101(Cr)/CFO nanocomposite. Error bars represent one standard deviation for three measurements. | |
3.11.2. The influence of adsorbent dosage on adsorption performance.
The dosage of the adsorbent is vital for effectively eliminating organic dyes from water contaminants. Consequently, we examined several dosages (10, 20, 30, 40, and 50 mg). Fig. 13(b) and S3(a)–(e)† illustrate the impact of adsorbent dosage on the adsorption of MB by the LPOM@MIL-101(Cr)/CFO nanocomposite. It is evident that increasing the adsorbent dosage leads to a steady rise in the amount of MB adsorbed onto the magnetic adsorbent. This enhancement in adsorption is attributed to the increased specific surface area and the number of active sites available on the magnetic nanocomposite as the dosage rises. The experimental findings indicated that doses above 30 mg significantly improved MB adsorption. Since 30 mg of magnetic adsorbent offers adequate surface area and the necessary adsorption sites for the MB dye, this dosage was selected for the study.
3.11.3. The influence of initial pH on adsorption performance.
The protonation or deprotonation of dye molecules can alter the charge on the surface of the adsorbent, affecting the adsorption process significantly. During the adsorption experiments, the initial pH of the dye solution was maintained between 2 and 10. The impacts of varying pH levels on the adsorption of methylene blue (MB) onto the magnetic nanocomposite are illustrated in Fig. 13(c) and S4(a)–(d).† Under acidic conditions, the adsorption capacity for MB decreased due to the positive charges generated on the surface of the adsorbent, as MB is a cationic dye, which leads to protonation. The adsorption efficiencies for MB by the LPOM@MIL-101(Cr)@CFO nanocomposite at pH 2 and 4 were measured to be 86% and 93%, respectively. As the pH of the solution increased, the concentration of hydroxide ions (OH−) rose, leading to a greater adsorption capacity for MB due to the resulting negative charges on the nanocomposite surface. This process involved deprotonation of the adsorbent, with adsorption efficiencies of 95% and 100% for MB at pH levels of 8 and 10, respectively. These findings indicate that the adsorption of MB onto the magnetic nanocomposite is more effective under basic conditions compared to acidic ones, suggesting that increasing the pH enhances the adsorption rate for the MB dye solution.
3.11.4. The influence of temperature on adsorption performance.
A crucial factor influencing the adsorption capabilities of magnetic nanocomposites for organic dyes is the reaction temperature. To investigate the adsorption of MB dye, experiments were conducted at temperatures of 25, 45, 65, and 75 °C using 30 mg of magnetic adsorbent. The results depicting the impact of temperature variations on MB adsorption by the LPOM@MIL-101(Cr)/CFO nanocomposite are illustrated in Fig. 13(d) and S5(a)–(d).† The findings clearly indicate that higher reaction temperatures facilitate quicker removal of MB dye, resulting in a greater adsorption capacity on the surface of the adsorbent. This enhancement can be attributed to the increased mobility and vitality of MB molecules with rising temperatures, suggesting that MB dye adsorption is an endothermic and spontaneous process. Consequently, the dye molecules rapidly diffuse into the metal–organic frameworks of MIL-101(Cr), while also inducing swelling in the internal structure of the magnetic nanocomposite, thereby accommodating more molecules within its interior.
3.11.5. Selective adsorption potency of the ternary magnetic nanocomposite in the mixture of organic dyes.
A notable and intriguing challenge in the treatment of dye wastewater is the selective adsorption and separation of specific dyes. This study investigates an equal mixture of cationic and anionic dyes in both binary and ternary configurations. As illustrated in Fig. 14, the UV-vis spectra for methylene blue (MB) and rhodamine B (RhB) indicate that these dyes are rapidly adsorbed by the magnetic nanocomposite, leading to their quick removal from the mixtures. In contrast, the peaks for methyl orange (MO) remain unchanged. This behavior can be explained by the lacunary Keggin heteropolyanion present in the metal–organic frameworks of MIL-101(Cr), which exhibits high selectivity. These results demonstrate the effective selective adsorption capability of the ternary magnetic nanocomposite for cationic dyes even in the presence of anionic dyes in aqueous environmental samples.
 |
| | Fig. 14 Selective adsorption ability of the LPOM@MIL-101(Cr)/CFO nanocomposite towards combination dyes of (a) MB + RhB, (b) RhB + MO, (c) MB + MO and (d) MB + RhB + MO. Reaction conditions: C0(MB) = C0(RhB) = C0(MO) = 25 mg L−1; adsorbent dosage = 30 mg in 30 mL mixed dye solution; at ambient temperature. | |
3.11.6. The performance of the magnetic nanocomposite in the removal of antibiotic drugs.
The effectiveness of the LPOM@MIL-101(Cr)/CFO nanocomposite for removing ciprofloxacin (CIP), a model antibiotic drug, was also evaluated using different adsorbent dosages of 10, 20, 30, 40, and 50 mg. Fig. 15(a) and S6(a)–(e)† demonstrate how these varying dosages affect the adsorption of CIP at a concentration of 25 mg L−1.The results show that increasing the amount of the adsorbent enhances the availability of active sites and specific surface areas on the magnetic nanocomposite, resulting in a steady increase in the adsorption rate. Furthermore, when 30 mg of the magnetic adsorbent was tested with different CIP concentrations (25, 50, 75, and 100 mg L−1), the findings presented in Fig. 15(b) and S7(a)–(d)† indicated that higher drug concentrations lead to a larger number of CIP molecules in the solution. This, in turn, results in more CIP molecules occupying the pores and active sites on the surface of the magnetic nanocomposite, which ultimately reduces the percentage of drug removal.
 |
| | Fig. 15 The influence of adsorbent dosage (a) and initial concentration (b) on the elimination of the CIP drug via the LPOM@MIL-101(Cr)/CFO nanocomposite. Error bars represent one standard deviation for three measurements. | |
3.11.7. Dye and drug adsorption isotherms.
The adsorption isotherm serves as a valuable tool for demonstrating the effectiveness of dye and medication molecules in their interaction with the magnetic adsorbent. Thus, it is essential to explore the relationship between the adsorption of these substances onto the magnetic nanocomposite and their concentration in solution. To better understand the experimental findings, the adsorption behavior of the LPOM@MIL-101(Cr)/CFO nanocomposite was analyzed using the Langmuir and Freundlich isotherm models (eqn (3) and (4)). The Langmuir model is particularly favored, as it suggests that the adsorption of dyes and drugs takes place on uniform sites of the adsorbent.| | | Ce/qe = 1/(KLQm) + Ce/Qm | (3) |
| | | lnqe = lnKF + (1/n)lnCe | (4) |
The equilibrium concentration of the solution (mg L−1), equilibrium adsorption capacity (mg g−1), Langmuir constant (L mg−1), and maximum adsorption capacity (mg g−1) are denoted by Ce, qe, KL, and Qm, respectively, in the Langmuir equation. In the Freundlich equation, KF represents the Freundlich constant (mg g−1), and the parameter 1/n reflects the influence of concentration on adsorption capacity, falling within the range of 0 to 1.63 The Langmuir and Freundlich isotherms for the adsorption of MB and CIP onto the LPOM@MIL-101(Cr)/CFO nanocomposite are illustrated in Fig. S8(a–d).† The adsorption parameters and linear correlation coefficients (R2) for both MB and CIP are summarized in Table 2. According to Table 2, the Langmuir linear plot for MB (R2 = 0.9983) significantly outperformed the Freundlich linear plot (R2 = 0.8310), indicating that the Langmuir isotherm model more effectively represents the adsorption behavior of the magnetic nanocomposite concerning MB dye. Furthermore, the adsorption isotherm for the CIP drug closely aligns with the Langmuir model. Additionally, the dimensionless separation factor (RL)—a critical aspect of the Langmuir isotherm—was calculated for both MB and CIP, yielding values of 0.00084 and 0.0975, respectively. These results suggest that MB and CIP are favorably adsorbed by the LPOM@MIL-101(Cr)/CFO nanocomposites. In this context, C0 represents the initial concentration of the dye and drug (mg L−1). The RL value indicates the nature of the adsorption: RL = 0 signifies irreversible adsorption, RL = 1 indicates a linear relationship, RL > 1 suggests unfavorable adsorption, and 0 < RL < 1 denotes favorable adsorption. The equation used for these calculations is as follows (eqn (5)):
Table 2 Langmuir and Freundlich isotherm parameters for the adsorption of MB and CIP on the LPOM@MIL-101(Cr)/CFO nanocomposite
| Contaminant |
Langmuir isotherm model |
Freundlich isotherm model |
|
Q
m,exp (mg g−1) |
Q
m,cal (mg g−1) |
K
L (L mg−1) |
R
L
|
R
2
|
K
F (mg g−1) |
n
|
R
2
|
| MB |
103.051 |
102.910 |
47.25 |
0.00084 |
0.9983 |
29.29 |
4.78 |
0.8310 |
| CIP |
64.026 |
56.180 |
0.37 |
0.0975 |
0.9994 |
21.16 |
3.81 |
0.9460 |
3.11.8. Adsorption kinetics.
The impact of time on the adsorption of the cationic dye MB and the antibiotic CIP drug by the LPOM@MIL-101(Cr)/CFO nanocomposite was examined. As shown in Fig. S9(a and b),† the adsorption capacity for both MB and CIP increased rapidly within the initial minutes, attributed to the abundant active adsorption sites and the significant specific surface area of the LPOM@MIL-101(Cr)/CFO nanocomposite. However, as time progressed, most of the active sites became occupied, leading to a decrease in the adsorption rate during the process until equilibrium was attained. The adsorption kinetics were analyzed using the pseudo-first-order and pseudo-second-order kinetic models, which are detailed below (eqn (6) and (7)).| | | ln(qe − qt) = lnqe − k1t | (6) |
| | | t/qt = 1/(k2qe2) + t/qe | (7) |
where qe (mg g−1) and qt (mg g−1) represent the amounts of dye and drug adsorbed at equilibrium and at a specific time t (min), respectively, while k1 (min−1) and k2 (g mg−1 min−1) are the rate constants associated with the pseudo-first-order and pseudo-second-order models, respectively.64 As illustrated in Fig. S9(a) and (b)† and detailed in Table 3, the kinetic data for MB and CIP align with a pseudo-second-order kinetic model. Table 3 presents the computed kinetic parameters for both models. A comparison of the correlation coefficients (R2) indicates that the LPOM@MIL-101(Cr)/CFO nanocomposite demonstrates the most favorable adsorption behavior for MB and CIP, following a pseudo-second-order kinetic model.
Table 3 Kinetic parameters calculated in the adsorption of MB and CIP onto the LPOM@MIL-101(Cr)/CFO nanocomposite
| Pseudo-first-order kinetic |
Pseudo-second-order kinetic |
| Dye concentration (mg L−1) |
q
e,exp (mg g−1) |
k
1 (min−1) |
q
e,cal (mg g−1) |
R
2
|
q
e,cal (mg g−1) |
k
2 (g mg−1 min−1) |
R
2
|
| For MB dye |
| 75 |
66.177 |
0.0911 |
62.980 |
0.9874 |
68.965 |
0.00449 |
0.9986 |
| 100 |
64.876 |
0.0638 |
71.490 |
0.9053 |
72.464 |
0.00147 |
0.9835 |
| 150 |
103.051 |
0.0711 |
111.430 |
0.9438 |
112.359 |
0.00126 |
0.9843 |
| For the CIP drug |
| 50 |
45.279 |
0.1669 |
28.968 |
0.9326 |
45.662 |
0.0303 |
0.9973 |
| 75 |
59.119 |
0.1659 |
46.534 |
0.9791 |
60.606 |
0.0140 |
0.9933 |
| 100 |
64.026 |
0.1466 |
55.100 |
0.9793 |
66.225 |
0.00873 |
0.9852 |
3.11.9. Comparison of adsorption capacity of the synthesized nanocomposite with some reported adsorbents.
To demonstrate the effectiveness and advantages of the LPOM@MIL-101(Cr)/CFO nanocomposite in eliminating the MB dye and CIP drug from aqueous solutions, a comparison was made with various adsorbents documented in the literature.65–80 As illustrated in Table 4, this comparison considered several factors, including the quantity of the adsorbent utilized, adsorption duration, initial concentration of pollutants, and removal efficiency. Table 5 clearly indicates that the magnetic adsorbent is superior regarding both the adsorption time and adsorption capacity for pollutant elimination.
Table 4 Comparison of the adsorption capacity of different adsorbents in the elimination of MB and CIP
| Adsorbent |
Contaminant |
Concentration (mg L−1) |
Adsorption capacity (mg g−1) |
Ref. |
| Fe3O4@ZIF-8 |
MB |
10 |
20.2 |
65
|
| Fe3O4@SiO2@HKUST-1 |
MB |
20 |
434.78 |
66
|
| H6P2W18O62/MOF-5 |
MB |
10 |
51.81 |
67
|
| CU53Fe47BTC |
MB |
10 |
94.42 |
68
|
| MoS2/Fe-MIL-88NH2 |
MB |
50 |
370 |
69
|
| PAN/ZIF-8 |
MB |
100 |
224.37 |
70
|
| UiO-66-NH2 |
MB |
20 |
96.45 |
71
|
| UiO-66-NO2 |
MB |
50 |
41.7 |
72
|
| H6P2W18O62@Cu3(BTC)2 |
MB |
40 |
18.51 |
73
|
| Mesoporous MIL-101 |
MB |
30 |
22.5 |
74
|
| PW11V@MIL-101(Cr) |
MB |
100 |
371 |
75
|
| CNS@ZIF-67 |
CIP |
70 |
40.35 |
76
|
| Alg@MOF-rGO |
CIP |
10 |
40.76 |
77
|
| Fe/Zn-SBC |
CIP |
20 |
74.2 |
78
|
| MIL-53(Fe)/biochar |
CIP |
75 |
147.79 |
79
|
| Fe3O4@Phe Nps |
CIP |
30 |
49.27 |
80
|
| LPOM@MIL-101(Cr)/CFO |
CIP |
100 |
64 |
This work |
| LPOM@MIL-101(Cr)/CFO |
MB |
150 |
103 |
This work |
Table 5 Thermodynamic parameters for adsorption of MB and CIP on the LPOM@MIL-101(Cr)/CFO nanocomposite
| Contaminant |
T (K) |
ΔG° (kJ mol−1) |
ΔH° (kJ mol−1) |
ΔS° (J mol−1 K−1) |
R
2
|
| For MB dye |
|
|
298 |
−2.82 |
42.68 |
152.25 |
0.9962 |
|
|
318 |
−5.49 |
— |
— |
— |
|
|
338 |
−8.73 |
— |
— |
— |
|
|
348 |
−10.45 |
— |
— |
— |
| For CIP dye |
|
|
298 |
−1.31 |
27.49 |
95.83 |
0.9705 |
|
|
318 |
−2.53 |
— |
— |
— |
|
|
338 |
−4.87 |
— |
— |
— |
|
|
348 |
−6.09 |
— |
— |
— |
3.11.10. Adsorption thermodynamics.
Thermodynamic studies were conducted to assess the adsorption of the methylene blue (MB) dye and ciprofloxacin (CIP) drug on the LPOM@MIL-101(Cr)/CFO magnetic nanocomposite at various temperatures. Key thermodynamic parameters, including enthalpy (ΔH°, kJ mol−1), entropy (ΔS°, J mol−1 K−1) and Gibbs free energy (ΔG°, kJ mol−1) were calculated using the following equations (eqn (8) and (9)),| | | lnKc = (ΔS°/R) − (H°/RT) | (8) |
| | | ΔG° = −RTlnKc | (9) |
where R represents the gas constant (8.314 J mol−1 K−1), Kc denotes the thermodynamic equilibrium constant (Kc = qe/Ce), and T refers to the temperature in Kelvin. The values of ΔH° and ΔS° associated with MB and CIP were derived from the slopes and intercepts of the Van't Hoff plots presented in Fig. S10(a and b).† As shown in Table 5, both ΔH° values were positive, while ΔG° values were negative, indicating that the adsorption processes for both MB and CIP are endothermic and spontaneous as the temperature increases. Additionally, the positive ΔS° values suggest that the adsorption of MB and CIP on the LPOM@MIL-101(Cr)/CFO magnetic nanocomposite occurs randomly at the solid/solution interface. The ΔG° values, ranging from 0 to −20 kJ mol−1, imply that physical adsorption primarily contributes to the adsorption mechanisms of MB and CIP.81–85
3.11.11. Adsorption mechanism.
The ternary LPOM@MIL-101(Cr)/CFO magnetic nanocomposite exhibits a lower surface area compared to the pristine samples of MIL-101(Cr) and LPOM@MIL-101(Cr) (refer to Table 1). Consequently, we explore various factors influencing the adsorption of the cationic dye MB and the CIP drug, which include electrostatic interactions, π–π stacking, hydrogen bonding, coordination bonding, and pore filling in MIL-101(Cr), as illustrated in Scheme 2.86–90 Zeta potential is a critical parameter that enhances the adsorption capacity of the adsorbent. Our findings demonstrate that after the encapsulation of LPOM polyanions within the cavities of MIL-101(Cr), the magnetic nanocomposite exhibits a more negative zeta potential than pristine MIL-101(Cr), with values of +30.57 mV for MIL-101(Cr) and −57.87 mV for LPOM@MIL-101(Cr)/CFO (refer to Fig. 8). This explains the superior adsorption of the cationic dyes by the magnetic nanocomposite compared to the anionic dye MO; MB carries positive charges in aqueous solutions, facilitating electrostatic interactions with the adsorbent. Furthermore, the aromatic moieties in the MB and CIP molecules can engage in π–π interactions with the benzene rings in the nanocomposite's structure.91,92 Functional groups in the CIP molecule, such as carboxylate and amino groups, can form hydrogen bonds with oxygen-containing groups, including WO6 units in the LPOM clusters. Additionally, carbonyl and amine groups present in the molecules can create coordination bonds with chromium atoms in the MIL-101(Cr) framework. Therefore, a variety of chemical interactions significantly contribute to the adsorption process. However, the nanocomposite material shows poor adsorption of anionic dyes compared to pristine MIL-101(Cr) (refer to Fig. 12), further supporting the notion that the adsorption mechanism mainly depends on electrostatic interactions not π–π or other interactions. Therefore, the LPOM@MIL-101(Cr)/CFO nanocomposite serves as an excellent adsorbent for cationic species in contaminated wastewater.
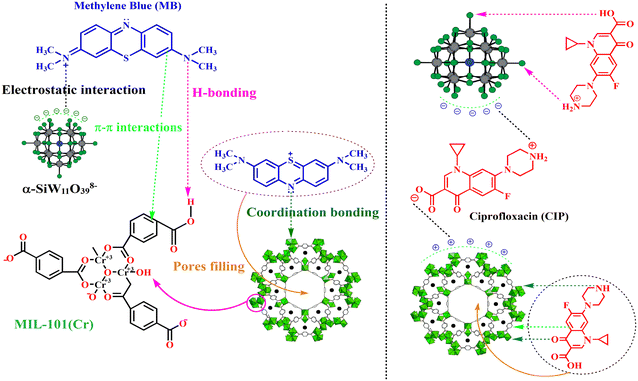 |
| | Scheme 2 Schematic representation of the suggested adsorption mechanism of the MB dye and CIP drug on the LPOM@MIL-101(Cr)/CFO nanocomposite. | |
3.11.12. Recyclability and stability of the ternary magnetic nanocomposite.
The magnetic LPOM@MIL-101(Cr)/CFO nanocomposite was extracted from the dye solution using a magnet following the adsorption process. After undergoing washing and drying procedures, it was reused for additional adsorption reactions to assess its stability and recyclability. The nanocomposite was repeatedly washed with methanol at room temperature for 30 min. Once dried, it was reintroduced into a 30 mL solution of 25 mg L−1 MB or CIP. As shown in Fig. 16, the recycling results demonstrated a marginal reduction, approximately 5–7%, in adsorption efficiency of the dye and drug after four cycles. To evaluate the structural integrity of the recovered magnetic nanocomposite during the adsorption process, its stability was analyzed using FT-IR, XRD, EDX, and SEM methods. The findings, as illustrated in Fig. 17(a)–(d), revealed minimal changes from the original nanocomposite after four uses. The FT-IR spectrum of the recycled magnetic nanocomposite retained the key vibrational bands seen in the initial composite, and the XRD pattern coincided well with the original. These results indicate that the magnetic nanocomposite exhibits excellent stability for the adsorption of aqueous pollutants.
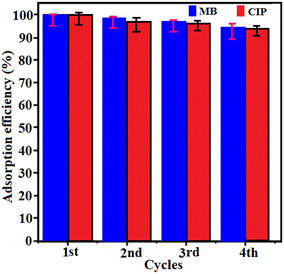 |
| | Fig. 16 The reusability of the LPOM@MIL-101(Cr)/CFO nanocomposite. Reaction conditions: C0 (MB or CIP) = 25 mg L−1, adsorbent dosage = 30 mg in 30 mL solution at ambient temperature. Error bars represent one standard deviation for three measurements. | |
 |
| | Fig. 17 (a) FT-IR spectrum, (b) XRD pattern, (c) EDX spectrum and (d) FE-SEM image after four stages of recycling. | |
3.11.13. Challenges and future research directions.
Overall, the LPOM@MIL-101(Cr)/CFO nanocomposite demonstrates remarkable adsorption capabilities for removing organic dyes. However, there are several challenges that hinder its practical application, which this section aims to address while seeking potential solutions for the future. Although the robust integration of MIL-101(Cr) with LPOM facilitates the rapid separation and removal of cationic dyes, further optimization of the conditions is necessary to enhance the adsorption capacity. While this nanocomposite shows better recyclability than pristine MIL-101(Cr), expanding industrial applications to include more environmentally friendly MOFs, such as MIL-101(Fe), is crucial for maximizing the effectiveness of the green adsorbent. This system operates more efficiently at basic pH levels; however, for use in natural water bodies, the process pH should be maintained at around 7.0. Future efforts should focus on overcoming these challenges to establish the LPOM@MIL-101(Cr)/CFO nanocomposite adsorbent system as a standard for dye treatment. Research directions could include the development of ternary magnetic POM@MOF composites by incorporating additional MOFs with POMs, which may provide an effective strategy for creating comprehensive adsorbent systems aimed at fully removing dyes from natural water sources. Among the various MOFs, iron-based options are significantly less harmful than those containing chromium, as iron is non-toxic and cost-effective, whereas chromium is a hazardous element. Furthermore, Cr3+ can accumulate in sediments through adsorption onto solid materials, leading to serious pollution issues. Therefore, utilizing MIL-101(Fe) MOFs for POM encapsulation, instead of MIL-101(Cr), can effectively eliminate the risk of chromium contamination.
4. Conclusions
In conclusion, the hydrothermal method successfully produced both magnetic and non-magnetic binary metal–organic frameworks, specifically MIL-101(Cr), along with lacunary Keggin-type polyoxometalate-based ternary nanocomposites. After thoroughly characterizing the LPOM@MIL-101(Cr)/CFO nanocomposite, the ternary magnetic nanocomposite was further investigated due to its impressive adsorption capacity and ease of separation. Numerous experiments were conducted to assess the adsorption of methylene blue (MB) dye from aqueous solutions, evaluating various factors including dye concentration, adsorbent dosage, pH, and temperature. A mixture of cationic and anionic dyes was also tested to analyze the selective adsorption capabilities of the adsorbent. The findings revealed that the magnetic nanocomposite performed effectively as an adsorbent for cationic dyes. Thermodynamic analyses indicated that the adsorption process was both endothermic and spontaneous. The adsorption mechanisms for MB and ciprofloxacin (CIP) were primarily attributed to electrostatic interactions, π–π interactions, hydrogen bonding, coordination bonding, and pore filling. Overall, these results suggest that the ternary magnetic nanocomposite is an effective and environmentally friendly solution for removing dye pollutants and antibiotic residues from contaminated water.
Data availability
Data for this article are available upon request from the corresponding author.
Author contributions
Hamidreza Nourolahi: data curation, investigation, formal analysis, methodology, writing – original draft. Saeed Farhadi: supervision, conceptualization, writing – review & editing. Reihaneh Malakooti: supervision, conceptualization, writing – review & editing. Mansoureh Maleki: data curation, formal analysis. Farzaneh Mahmoudi: formal analysis, writing – review & editing.
Conflicts of interest
The authors declare that they have no conflicts of interest.
Acknowledgements
The authors gratefully acknowledge the University of Birjand, the Lorestan University Research Councils and the Iran Nanotechnology Initiative Council (INIC) for their support.
References
- Z. Liu, W. He, Q. Zhang, H. Shapour and M. F. Bakhtar, ACS Omega, 2021, 6, 4597 CrossRef CAS PubMed.
- Y. Hou, S. Yan, G. Huang, Q. Yang and J. Cai, Bioresour. Technol., 2020, 303, 122939 CrossRef CAS PubMed.
- S. Kumari, A. A. Khan, A. Chowdhury, A. K. Bhakta, Z. Mekhalif and S. Hussain, Colloids Surf., A, 2020, 586, 124264 CrossRef CAS.
- E. Sharifpour, H. Z. Khafri, M. Ghaedi, A. Asfaram and R. Jannesar, Ultrason. Sonochem., 2018, 40, 373 CrossRef CAS PubMed.
- E. A. Dil, M. Ghaedi, G. R. Ghezelbash, A. Asfaram, A. M. Ghaedi and F. Mehrabi, RSC Adv., 2016, 6, 54149 RSC.
- X. Li, Z. Zhang, A. Fakhri, V. K. Gupta and S. Agarwal, Int. J. Biol. Macromol., 2019, 136, 469 CrossRef CAS PubMed.
- J. Mo, Y. Liu, Q. Fu, C. Cai, Y. Lu, W. Wu, Z. Zhao, H. Song, S. Wang and S. Nie, Nano Energy, 2022, 93, 106842 CrossRef CAS.
- Y. Fang, Y. Liu and J. Zhang, Environ. Pollut., 2023, 322, 121171 CrossRef CAS PubMed.
- Y. Ma, M. Li, P. Li, L. Yang, L. Wu and F. Gao, Bioresour. Technol., 2021, 319, 124199 CrossRef CAS PubMed.
- S. Bazgir, S. Farhadi and Y. Mansourpanah, J. Solid State Chem., 2022, 315, 123513 CrossRef CAS.
- B. Hashemzadeh, H. Alamgholiloo, N. Noroozi-Pesyan, E. Asgari, A. Sheikhmohamadi, J. Yeganeh and H. Hashemzadeh, Chemosphere, 2021, 281, 130970 CrossRef CAS PubMed.
- R. Xiao, H. I. Abdu, L. Wei, T. Wang, S. Huo, J. Chen and X. Lu, Analyst, 2020, 145, 2398 RSC.
- V. L. Prasanna, H. Mamane, V. K. Vadivel and D. Avisar, J. Hazard. Mater., 2020, 384, 121396 CrossRef CAS PubMed.
- T. W. Seow and C. K. Lim, Int. J. Appl. Bioeng., 2016, 11, 2675 Search PubMed.
- D. Bhatia, N. R. Sharma, J. Singh and R. S. Kanwar, Crit. Rev. Environ. Sci. Technol., 2017, 47, 1836 CrossRef CAS.
- C. H. Zhang, L. H. Ai and J. Jiang, Ind. Eng. Chem. Res., 2015, 54, 153 CrossRef CAS.
- G. Hitakari, S. Singh and G. Pandey, Int. J. Adv. Res. Sci. Eng. Technol., 2017, 4, 3960 Search PubMed.
- A. Hamedi, M. B. Zarandi and M. R. Nateghi, J. Environ. Chem. Eng., 2019, 7, 102882 CrossRef CAS.
-
A. Nasar and S. Shakoor, Mater. Res. Forum, 2017, vol. 15, p. 1.
- S. Saber-Samandari, H. Joneidi-Yekta and M. Mohseni, Chem. Eng. J., 2017, 308, 1133 CrossRef CAS.
- S. Guo, K. Wu, Y. Gao, L. Liu, X. Zhu, X. Li and F. Zhang, J. Chem. Eng. Data, 2018, 63, 3902 CrossRef CAS.
- D. Y. Du, J. S. Qin, S. L. Li, Z. M. Su and Y. Q. Lan, Chem. Soc. Rev., 2014, 43, 4615 RSC.
- S. Y. Lai, K. H. Ng, C. K. Cheng, H. Nur, M. Nurhadi and M. Arumugam, Chemosphere, 2020, 263, 128244 CrossRef PubMed.
- J. X. Liu, X. B. Zhang, Y. L. Li, S. L. Huang and G. Y. Yang, Coord. Chem. Rev., 2020, 414, 213260 CrossRef CAS.
- M. Ammam, J. Mater. Chem. A, 2013, 1, 6291 RSC.
- A. R. Bagheri, N. Aramesh, J. Chen, W. Liu, W. Shen, S. Tang and H. K. Lee, Anal. Chim. Acta, 2022, 1209, 339509 CrossRef CAS PubMed.
- S. T. Zheng and G. Y. Yang, Chem. Soc. Rev., 2012, 41, 7623 RSC.
- Y. F. Song and R. Tsunashima, Chem. Soc. Rev., 2012, 41, 7384 RSC.
- K. Y. Matsumoto and Y. Sasaki, Bull. Chem. Soc. Jpn., 1976, 49, 156 CrossRef CAS.
- J. Kim and A. A. Gewirth, Langmuir, 2023, 19, 8934 CrossRef.
- S. Masoumi, F. Farshchi-Tabrizi and A. R. Sardarian, J. Environ. Chem. Eng., 2020, 8, 103601 CrossRef CAS.
- C. T. Buru, P. Li, B. L. Mehdi, A. Dohnalkova, A. E. Platero-Prats, N. D. Browing, K. W. Chapman, J. T. Hupp and O. K. Farha, Chem. Mater., 2017, 29, 5174 CrossRef CAS.
- H. S. Far, M. Najafi, M. Hasanzadeh and R. Rahimi, Inorg. Chem. Commun., 2023, 152, 110680 CrossRef.
- Z. Hasan and S. H. Jhung, J. Hazard. Mater., 2015, 283, 329 CrossRef CAS PubMed.
- M. Chen, C. Lai, Y. Liu, G. Zeng, D. Huang, C. Zhang, L. Qin, L. Hu, C. Zhou and W. Xiong, Coord. Chem. Rev., 2018, 368, 80 CrossRef.
- W. G. Lu, Z. W. Wei, Z. Y. Gu, T. F. Liu, J. Park, J. Tian, M. W. Zhang, Q. Zhang, T. Gentle, M. Bosch and H. C. Zhou, Chem. Soc. Rev., 2014, 43, 5561 RSC.
- Y. Rachuri, S. Subhagan, B. Parmar, K. K. Bisht and E. Suresh, Dalton Trans., 2018, 47, 898–908 RSC.
- B. Parmar, K. K. Bisht, G. Rajput and E. Suresh, Dalton Trans., 2021, 50, 3083–3108 RSC.
- J. M. Yang, CrystEngComm, 2022, 24, 434 RSC.
- A. Kirchon, L. Feng, H. F. Drake, E. A. Joseph and H. C. Zhou, Chem. Soc. Rev., 2018, 47, 8611 RSC.
- J. Abdi, A. J. Sisi, M. Hadipoor and A. Khataee, J. Hazard. Mater., 2022, 424, 127558 CrossRef CAS PubMed.
- C. Du, Z. Zhang, G. Yu, H. Wu, H. Chen, L. Zhou, Y. Zhang, Y. Su, S. Tan, L. Yang, J. Song and S. Wang, Chemosphere, 2021, 272, 129501 CrossRef CAS PubMed.
- S. Bhattacharjee, C. Chen and W. S. Ahn, RSC Adv., 2014, 4, 52500 RSC.
- J. Ma, X. Guo, Y. Ying, D. Liu and C. Zhong, Chem. Eng. J., 2017, 313, 890 CrossRef CAS.
- A. Jarrah and S. Farhadi, RSC Adv., 2020, 10, 39881 RSC.
- J. Shu, R. Liu, H. Wu, Z. Liu, X. Sun and C. Tao, J. Taiwan Inst. Chem. Eng., 2018, 82, 351 CrossRef CAS.
- C. Gecgel, U. B. Simsek, B. Gozmen and M. Turabik, J. Iran. Chem. Soc., 2019, 16, 1735–1748 CrossRef CAS.
- Q. Wu, M. Niu, X. Chen, L. Tan, C. Fu, X. Ren, J. Ren, L. Li, K. Xu and H. Zhong, Biomaterials, 2018, 162, 132–143 CrossRef CAS PubMed.
- Y. Zhang, F. Wang, C. Liu, Z. Wang, L. Kang, Y. Huang, K. Dong, J. Ren and X. Qu, ACS Nano, 2018, 12, 651–661 CrossRef CAS PubMed.
- J. Kou and L.-B. Sun, ACS Appl. Mater. Interfaces, 2018, 10, 12051–12059 CrossRef CAS PubMed.
- Q. Gao, Y. Zhao, J. Gong, X. Chen, W. Liu and W. Gao, Anal. Methods, 2022, 14, 4095–4105 RSC.
- F.-Y. Yi, W. Zhu, S. Dang, J.-P. Li, D. Wu, Y.-h. Li and Z.-M. Sun, Chem. Commun., 2015, 51, 3336 RSC.
- A. Téazéa, G. Hervéa, R. G. Finke and D. Lyon, Inorg. Synth., 2007, 27, 89–90 Search PubMed.
- T. Zhao, F. Jeremias, I. Boldog, B. Nguyen, S. K. Henninger and C. Janiak, Dalton Trans., 2015, 44, 16791–16801 RSC.
- G. Allaedini, S. M. Tasirin and P. Aminayi, Int. Nano Lett., 2015, 5, 183–186 CrossRef CAS.
- A. M. Andani, T. Tabatabaie, S. Farhadi and B. Ramavandi, RSC Adv., 2020, 10, 32845 RSC.
- X. Liu, X. Xie, Z. Du, B. Li, L. Wu and W. Li, Soft Matter, 2019, 15, 9178 RSC.
- A. Amiri, M. Mirzaei and S. Derakshanrad, Microchim. Acta, 2019, 186, 1 CrossRef PubMed.
- S. Farhadi, F. Siadatnasab and A. Khataee, Ultrason. Sonochem., 2017, 37, 298 CrossRef CAS PubMed.
- K. Karami, S. M. Beram, P. Bayat and F. Siadatnasab, J. Mol. Struct., 2022, 1247, 131352 CrossRef CAS.
- M. Sadeghi, S. Farhadi and A. Zabardasti, RSC Adv., 2020, 10, 10082 RSC.
- A. Jarrah and S. Farhadi, RSC Adv., 2018, 8, 37976 RSC.
- M. Ashrafi, S. Farhadi, K. Javanmard and F. Mahmoudi, New J. Chem., 2023, 47, 21276 RSC.
- M. Beiranvand, S. Farhadi and A. Mohammadi-Gholami, RSC Adv., 2022, 12, 34438 RSC.
- J. Zheng, C. Cheng, W. J. Fang, C. Chen, R. W. Yan, H. X. Huai and C. C. Wang, CrystEngComm, 2014, 16, 3960 RSC.
- N. Faaizatunnisa, R. Ediati, H. Fansuri, H. Juwono, S. Suprapto, A. R. P. Hidayat and L. L. Zulfa, Nano-Struct. Nano-Objects, 2023, 34, 100968 CrossRef CAS.
- X. Liu, W. Gong, J. Luo, C. Zou, Y. Yang and S. Yang, Appl. Surf. Sci., 2016, 362, 517 CrossRef CAS.
- W. Y. Siew, N. H. H. A. Bakar, M. A. Bakar and A. Z. Abidin, J. Hazard. Mater., 2021, 416, 125846 CrossRef CAS PubMed.
- K. Karami, F. Noori, P. Bayat and S. Javadian, Appl. Organomet. Chem., 2023, 37, e7044 CrossRef CAS.
- X. Wang, J. Zhang, J. Jiang, G. Zheng and W. Li, Mater. Lett., 2023, 338, 134057 CrossRef CAS.
- Q. Chen, Q. He, M. Lv, Y. Xu, H. Yang, X. Liu and F. Wei, Appl. Surf. Sci., 2015, 327, 77 CrossRef CAS.
- H. T. Dinh, N. T. Tran and D. X. Trinh, J. Anal. Methods Chem., 2021, 2021, 1 Search PubMed.
- X. Liu, J. Luo, Y. Zhu, Y. Yang and S. Yang, J. Alloys Compd., 2015, 648, 986 CrossRef CAS.
- K. Karami, P. Bayat, S. Javadian and M. Saraji, J. Mol. Liq., 2021, 342, 117520–117533 CrossRef CAS.
- A. X. Yan, S. Yao, Y. G. Li, Z. M. Zhang, Y. Lu, W. L. Chen and E. B. Wang, Chem. – Eur. J., 2014, 20, 6927 CrossRef CAS PubMed.
- P. Bhattacharyya, L. Sarma, A. Taneja, P. R. Parmar, G. Jain, D. Bandyopadhyay and S. Chakrabarti, ChemNanoMat, 2023, 9, 1 CrossRef.
- N. Kim, B. Cha, Y. Yea, L. K. Njaramba, S. Vigneshwaran, S. S. D. Elanchezhiyan and C. M. Park, Chem. Eng. J., 2022, 450, 138068 CrossRef CAS.
- Y. Ma, M. Li, P. Li, L. Yang, L. Wu, F. Gao, X. Qi and Z. Zhang, Bioresour. Technol., 2021, 319, 124199 CrossRef CAS PubMed.
- H. Chakhtouna, H. Benzeid, N. Zari, A. Qaiss and R. Bouhfid, Sep. Purif. Technol., 2023, 308, 122850 CrossRef CAS.
- X. Fu, S. Sarker, W. Ma, W. Zhao, Y. Rong and Q. Liu, J. Colloid Interface Sci., 2023, 632, 345 CrossRef CAS PubMed.
- A. A. Hoseini, S. Farhadi and A. Zabardasti, Appl. Organomet. Chem., 2019, 33, e4656 CrossRef.
- A. Jarrah and S. Farhadi, Acta Chim. Slov., 2019, 66, 85 CrossRef CAS PubMed.
- L. Fan, J. Miao, X. Wang, J. Cai, J. Lin, F. Chen, W. Chen, H. Luo, L. Cheng, X. An, X. Zhang and D. Ma, J. Environ. Chem. Eng., 2023, 11, 109292 CrossRef CAS.
- L. Meng, C. Zhao, T. Wang, H. Chu and C. C. Wang, Sep. Purif. Technol., 2023, 313, 123511 CrossRef CAS.
- Y. Wang, Y. Li, Y. Yang, B. Jiang, D. Li, C. Liu and Z. Feng, J. Mol. Liq., 2023, 372, 121210 CrossRef CAS.
- A. Samokhvalov, Chem. – Eur. J., 2015, 21, 16726 CrossRef CAS PubMed.
- M. Ashrafi and S. Farhadi, RSC Adv., 2023, 13, 6356 RSC.
- B. D'Cruz, M. O. Amin and E. Al-Hetlani, Ind. Eng. Chem. Res., 2021, 60, 10960 CrossRef.
- K. Javanmard, S. Farhadi and A. Zabardasti, Phys. Chem. Chem. Phys., 2023, 25, 21336 RSC.
- Y. X. Jing, M. M. Suo, G. P. Yang and Y. Y. Wang, Inorg. Chem., 2023, 62, 6361 CrossRef CAS PubMed.
- Y. Feng, L.-H. Wu, C.-H. Zhang, B.-X. Zhou, S.-R. Zheng, W.-G. Zhang, S.-L. Cai and J. Fan, Dalton Trans., 2023, 52, 12087–12097 RSC.
- G.-Q. Wang, J.-F. Huang, X.-F. Huang, S.-Q. Deng, S.-R. Zheng, S.-L. Cai, J. Fan and W.-G. Zhang, Inorg. Chem. Front., 2021, 8, 1083–1092 RSC.
|
| This journal is © The Royal Society of Chemistry 2025 |
Click here to see how this site uses Cookies. View our privacy policy here. 

 *a,
Reihaneh
Malakooti
*a,
Reihaneh
Malakooti


