 Open Access Article
Antimicrobial coatings based on amine-terminated graphene oxide and Nafion with remarkable thermal resistance
Mohammed Suleman
Beg
a,
Ella Nicole
Gibbons
 a,
Spyridon
Gavalas
a,
Mark A.
Holden
a,
Marta
Krysmann
b and
Antonios
Kelarakis
a,
Spyridon
Gavalas
a,
Mark A.
Holden
a,
Marta
Krysmann
b and
Antonios
Kelarakis
 *a
*a
aUCLan Research Centre for Smart Materials, School of Pharmacy and Biomedical Sciences, University of Central Lancashire, Preston PR1 2HE, UK. E-mail: akelarakis@uclan.ac.uk
bSchool of Medicine and Dentistry, University of Central Lancashire, Preston PR1 2HE, UK
First published on 15th March 2024
Abstract
We present a novel type of layer-by-layer (LbL) waterborne coating based on Nafion and amine-terminated graphene oxide (GO–NH2) that inhibits the growth of Escherichia coli and Staphylococcus aureus by more than 99% and this performance is not compromised upon extensive thermal annealing at 200 °C. Quartz crystal microbalance (QCM) sensorgrams allow the real time monitoring of the build-up of the LbL assemblies, a process that relies on the strong electrostatic interactions between Nafion (pH = 2.7, ζ = −54.8 mV) and GO–NH2 (pH = 2, ζ = 26.7 mV). Atomic force microscopy (AFM), contact angle and zeta potential measurements were used to characterise the multilayer assemblies. We demonstrate here that Nafion/GO–NH2 advanced coatings can offer drug-free and long-lasting solutions to microbial colonization and can withstand dry heat sterilization, without any decline in their performance.
Introduction
The microbial colonization of surfaces such as hand-touch sites, foodservice equipment, water distribution pipelines and transport vehicles is considered as one of the major threats for public health.1,2 Likewise, hospital acquired infections originating from bedrails, stethoscopes, medical charts, surgical equipment, catheters, tracheostomy tubes, and implants remain a serious concern that imposes substantial financial pressures to the healthcare system.3,4 The problem is exacerbated further due to the cross-transmission of nosocomial pathogens and the emergence of multi-drug resistant strains.5 These universal challenges point to the need for the development of advanced coatings that offer multiple levels of protection against a wide spectrum of pathogens by activating anti-adhesive, contact killing, or release killing biocide mechanisms.6,7Ideally, antimicrobial self-cleaning surfaces should be cost-effective and non-toxic to humans and the environment, offering long-lasting protection even under harsh conditions.
To this end, metal-based nanoparticles (gold, silver, copper oxide, zinc, and zinc oxide) have attracted significant attention during the last few years, but their uncontrolled use over an extensive period of time has raised concerns regarding their accumulative toxicity to the aquatic environment.8 More recently, the library of antimicrobial agents has been enriched to include carbon-based nanostructures such as fullerenes, carbon nanotubes, carbon dots, graphene and graphene oxide (GO).9 GO in particular demonstrates low cytotoxicity and has been shown to provide protection against a number of drug-resistant superbugs10 due to its supreme bactericidal activity that primarily relies on membrane stress, oxidative stress, and membrane perturbation via wrapping isolation.11,12
In this work, we present a novel type of layer-by-layer (LbL) assembly comprising amine functionalized graphene oxide (GO–NH2) along with Nafion, a polymer electrolyte that consists of a tetrafluoroethylene backbone modified with sulphonic acid units. This system design capitalises on the electrostatic interactions between GO–NH2 and Nafion to give rise to structurally robust waterborne coatings. The polymer choice takes into account its excellent chemical, thermal and mechanical stability13 combined with the fact that a long-range bacteria exclusion zone (EZ) has been identified and characterised at Nafion–liquid interfaces.14 We demonstrate here that Nafion/GO–NH2 synergistic systems can reduce the population of Escherichia coli (E. coli) and Staphylococcus aureus (S. aureus) by more than 99%. To the best of our knowledge this is the first demonstration of a waterborne, polymer based LBL coating that can withstand dry heat sterilization without compromising its excellent antimicrobial properties.
Materials and methods
Materials
Nafion dispersions were obtained from Merck as a 10 wt% dispersion in water and as a 20 wt% dispersion in a mixture of low aliphatic alcohols and water, respectively. The latter was used to spin-coat the crystals, while the former was used in all other experiments presented in this study. Ethylenediamine, ethanol and sodium hypochlorite solution were purchased from Merck, acetone from Honeywell and N-ethyl-N-(3-(dimethylaminopropyl)carbodiimide) (EDC) from Alfa Aesar. Graphene oxide (GO) was obtained from Merck as a 0.2 wt% dispersion in water. Elemental analysis conducted on a Flash 2000, Thermo Fisher Scientific CHNS elemental analyzer calibrated against 2,5-(bis(5-tert-butyl-2-benzo-oxazol-2-yl)thiophene) indicated that GO contained 49.4% carbon, 45.92% oxygen, 2.5% hydrogen and 2.18% sulphur.Synthesis of amine-functionalized GO (GO–NH2)
Amine functionalized GO (GO–NH2) was synthesized following a process previously reported.15 To this end, 50 mL of GO (0.005 wt%) was ultra-sonicated for 15 min and then reacted with 200 mg EDC and 4 mL of ethylenediamine under vigorous stirring for 4 h. The solution was dialysed for 48 h to remove excess EDC and ethylenediamine. The dialysis tubing had a molecular weight cut-off of 12–14 kDa and internal diameter of 48 mm (Thermo Scientific, USA). 1.0 M HCl was added dropwise to obtain pH = 2 for GO–NH2 solutions.Preparation of the Nafion/GO–NH2 nanocomposite
For the preparation of the Nafion/GO–NH2 nanocomposite, 50 mL of 0.01 wt% Nafion was added to 50 mL of 0.01 wt% GO–NH2 and the mixture was subjected to ultrasonication for 15 minutes and then left to settle for 1 hour followed by freeze drying.Quartz crystal microbalance with dissipation monitoring (QCM-D)
The quartz crystal microbalance with dissipation monitoring (QCM-D) experiments were performed using a Q-sense E1 unit. SiO2 and Au-modified crystals with a fundamental resonance frequency close to 5 MHz were spin-coated using a 0.5 wt% Nafion dispersion prepared by diluting the original 20 wt% dispersion with ethanol. The Nafion coated crystals were left for at least 48 h at room temperature to allow the complete evaporation of the solvent. The Nafion coated crystals were mounted to a flow cell (flow rate was set at 0.2 mL min−1) to monitor the interactions between deposited materials and water. An initial equilibrium stage of the crystal in air determined the fundamental resonant frequency, and the addition of water under constant flow established the baseline of the wetted surface.When a layer of material with mass Δm is deposited, the resonant frequency of the crystal is reduced by a factor of Δf based on the Sauerbrey relation: Δm = −(C/N)Δf, where N is the overtone number and C is the integrated crystal sensitivity.16D = Ed/(2πEs) defines the dissipation factor where Ed is the energy dissipated during one period of oscillation and Es is the energy stored in the system.17 For simplicity, only the third overtones (N = 3) are considered in this report.
Zeta potential (ζ potential)
Zeta potential (ζ potential) measurements were performed at room temperature using a Malvern Panalytical Zetasizer Nano-ZS with a 532 nm He–Ne laser. The samples were placed in disposable folded capillary cells obtained from Malvern Panalytical. All measurements were performed in triplicate and the results were averaged.Fourier transform infra-red (FTIR) spectroscopy
FTIR spectra were recorded on a Nicolet IR2000 spectrophotometer operating at room temperature. For each spectrum, 64 consecutive scans were averaged, within a range of 4000–500 cm−1 at a resolution of 2 cm−1.Raman spectroscopy
Raman spectra were recorded in the range of 800–2000 cm−1 using a Horiba Jobin Yvon HR800 Raman spectrometer with a slit of 200 cm−1 and a hole of 400 cm−1. A 532 nm air cooled CLDS point mode diode laser was used and the filter was set to 10% to avoid damaging the carbon structure of the samples.Ultraviolet-visible (UV-vis) spectroscopy
UV-vis spectra were obtained at room temperature on a Shimadzu UV-3600 spectrophotometer using Hellma Analytics quartz cuvettes with a pathlength of 1.0 cm.Thermogravimetric analysis (TGA)
Thermogravimetric analysis (TGA) measurements were carried out using a TG 209 F1 Libra (Netzsch). The temperature was increased under continuous nitrogen flow at a heating rate of 15 °C min−1 from room temperature up to 1000 °C.Contact angle measurements
The contact angle measurements were performed by depositing distilled water droplets (5 μL) on the coated quartz crystals using an OptoSigma optical tensiometer applying the standard sessile drop technique (Digidropmeter). The images were taken 20 s after the deposition of droplets, and multiple contact angles were recorded on replicates of the same coating.Atomic force microscopy (AFM)
Atomic force micrographs were collected using a Bruker Dimensions Icon atomic force microscope with a Nanoscope 6 controller. Imaging was performed in peak force tapping mode using silicon nitride cantilevers with a nominal spring constant of 0.4 N m−1 in air (SCANASYST-AIR, Bruker) and 0.7 N m−1 in fluid (SCANASYST-FLUID, Bruker). Images were collected at a minimum of three different locations for each sample, with scan sizes of 10 μm. Average roughness (Ra) measurements were carried out on a minimum of three different locations for each sample with scan sizes of 10 μm. Images were processed using a first order flattening procedure before measurement.Antimicrobial testing
Resistance to friction assessment
An Anton Paar modular compact rheometer 302e equipped with 50 mm parallel plate geometry was used to assess the behavior of the coated crystals when subjected to friction forces, and polydimethylsiloxane (PDMS) was used to mimic human skin in line with previous reports.19,20 PDMS disks with a diameter of 40 mm and thickness of 4 mm obtained from Silex Ltd were firmly attached (via double sided adhesive tape) to the upper plate, while the coated QCM crystals were attached to the bottom plate. Rotational shear experiments were performed at zero gap, and a constant shear rate was applied for 60 s after which each crystal was immersed for 10 min in 3 mL of water whose UV-vis spectrum was used to detect possible traces of detached GO–NH2. The test was repeated at progressively higher shear rates (![[small gamma, Greek, dot above]](https://www.rsc.org/images/entities/i_char_e0a2.gif) ) (i.e.
) (i.e. ![[small gamma, Greek, dot above]](https://www.rsc.org/images/entities/i_char_e0a2.gif) = 1 × 10⁵, 2 × 10⁵, 3 × 10⁵, and 4 × 10⁵ s−1) until GO–NH2 was detected spectrometrically in the aqueous suspension or, otherwise, until the maximum shear rate was reached.
= 1 × 10⁵, 2 × 10⁵, 3 × 10⁵, and 4 × 10⁵ s−1) until GO–NH2 was detected spectrometrically in the aqueous suspension or, otherwise, until the maximum shear rate was reached.
Results and discussion
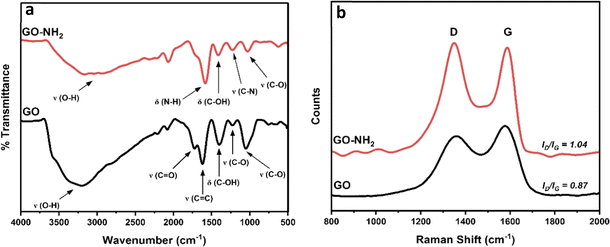
The FTIR spectrum of GO (black line in Fig. 1a) shows peaks centred at 3203 cm−1, 1724 cm−1, 1620 cm−1, 1400 cm−1, 1230 cm−1 and 1051 cm−1, which can be ascribed to O–H stretching, C![[double bond, length as m-dash]](https://www.rsc.org/images/entities/char_e001.gif) O stretching, C
O stretching, C![[double bond, length as m-dash]](https://www.rsc.org/images/entities/char_e001.gif) C stretching, C–OH bending and C–O stretching (epoxy) and C–O stretching (alkoxy), respectively. Similar, albeit less intense, peaks can be seen for GO–NH2 (red line in Fig. 1a), along with the presence of two additional peaks at 1583 cm−1 and 1226 cm−1 corresponding to N–H bending and C–N stretching, respectively.21–23 The Raman spectra in Fig. 1b are dominated by the D (1360 cm−1 for GO and 1350 cm−1 for GO–NH2) and G (1575 cm−1 for GO and 1580 cm−1 for GO–NH2) bands stemming from the stretching vibration of sp3 and sp2 hybridized carbon atoms, respectively.24 The ID/IG was found to increase from 0.87 for GO to 1.04 for GO–NH2 indicating a higher degree of disorder as a result of the chemical treatment with ethylenediamine.25,26
C stretching, C–OH bending and C–O stretching (epoxy) and C–O stretching (alkoxy), respectively. Similar, albeit less intense, peaks can be seen for GO–NH2 (red line in Fig. 1a), along with the presence of two additional peaks at 1583 cm−1 and 1226 cm−1 corresponding to N–H bending and C–N stretching, respectively.21–23 The Raman spectra in Fig. 1b are dominated by the D (1360 cm−1 for GO and 1350 cm−1 for GO–NH2) and G (1575 cm−1 for GO and 1580 cm−1 for GO–NH2) bands stemming from the stretching vibration of sp3 and sp2 hybridized carbon atoms, respectively.24 The ID/IG was found to increase from 0.87 for GO to 1.04 for GO–NH2 indicating a higher degree of disorder as a result of the chemical treatment with ethylenediamine.25,26
The FTIR spectrum of Nafion (blue line in Fig. 2) displays peaks centred at 1201 cm−1, 1142 cm−1, 1055 cm−1, 973 cm−1, 628 cm−1 and 513 cm−1 which can be ascribed to C–F asymmetric stretching, C–F symmetric stretching, S![[double bond, length as m-dash]](https://www.rsc.org/images/entities/char_e001.gif) O stretching, C–O–C stretching, C–S stretching and O–S–O bending, respectively.27,28 Similar peaks are observed in the Nafion/GO–NH2 FT-IR spectrum (green line in Fig. 2) but they are displaced at 1218 cm−1, 1148 cm−1, 1044 cm−1, 975 cm−1, 629 cm−1 and 521 cm−1, respectively. The observed 11 cm−1 and 8 cm−1 shifts for the peaks associated with S
O stretching, C–O–C stretching, C–S stretching and O–S–O bending, respectively.27,28 Similar peaks are observed in the Nafion/GO–NH2 FT-IR spectrum (green line in Fig. 2) but they are displaced at 1218 cm−1, 1148 cm−1, 1044 cm−1, 975 cm−1, 629 cm−1 and 521 cm−1, respectively. The observed 11 cm−1 and 8 cm−1 shifts for the peaks associated with S![[double bond, length as m-dash]](https://www.rsc.org/images/entities/char_e001.gif) O stretching and O–S–O bending, respectively can be attributed to a decrease in polarization of the S–O dipole due to proton transfer between the sulfonate anions and positively charged amine groups as discussed previously.29,30 Moreover, the pronounced shifts of 17 cm−1 and 6 cm−1 for C–F asymmetric and symmetric stretching peaks, respectively, are indicative of major reorganizations in the polymer backbone, consistent with effects previously observed in Nafion/poly(allylamine) complexes.31
O stretching and O–S–O bending, respectively can be attributed to a decrease in polarization of the S–O dipole due to proton transfer between the sulfonate anions and positively charged amine groups as discussed previously.29,30 Moreover, the pronounced shifts of 17 cm−1 and 6 cm−1 for C–F asymmetric and symmetric stretching peaks, respectively, are indicative of major reorganizations in the polymer backbone, consistent with effects previously observed in Nafion/poly(allylamine) complexes.31
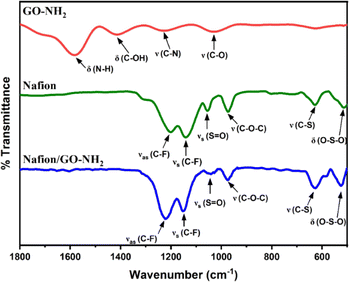 | ||
| Fig. 2 FTIR spectra of GO–NH2 (red line), Nafion (green line) and the Nafion/GO–NH2 nanocomposite (blue line). The pH of the original solutions of GO–NH2 and Nafion was 2 and 2.7, respectively. | ||
As shown in Fig. 3 the zeta potential (ζ) of aqueous dispersions of GO (black squares) show negative values (from ζ = −9.5 mV at pH = 1 to ζ = −45.0 mV at pH = 12) within the entire pH window considered, consistent with results previously reported.32 Deprotonation of carboxylic and hydroxyl groups in an alkaline environment leads to the lowest values ζ = −52.4 mV at pH = 10, while the upturn in ζ observed at even higher pH values has been attributed to the compression of the double layer at high ionic strength.32 In contrast to GO, aqueous dispersions of GO–NH2 (red circles) show positive ζ values at low pH values, approaching neutrality at pH = 5 and adopting negative values within the pH range 6–12, in agreement with the behaviour previously reported.33
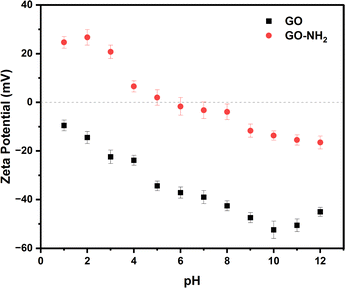 | ||
| Fig. 3 Zeta potential of 0.005 wt% GO (black squares) and GO–NH2 (red circles) aqueous dispersions as a function of pH. | ||
Mixing GO–NH2 (pH = 2, ζ = 26.7 mV) and Nafion (pH = 2.7, ζ = −54.8 mV) results in the rapid formation of large aggregates that eventually precipitate out of the dispersion (the mixed system immediately after mixing shows ζ = −4.1 mV) as shown in Fig. 4. In previous studies it has been demonstrated that complexation of Nafion with peptides,34 polymers30,35,36 and metal–organic frameworks37 is driven by electrostatic interactions, hydrogen bonding and the hydrophobic effect.
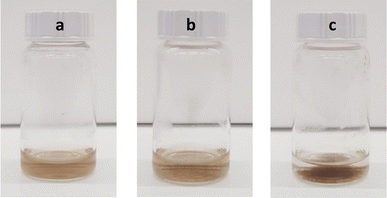 | ||
Fig. 4 Optical images of (a) GO–NH2 and (b) Nafion/GO–NH2 (1![[thin space (1/6-em)]](https://www.rsc.org/images/entities/char_2009.gif) : :![[thin space (1/6-em)]](https://www.rsc.org/images/entities/char_2009.gif) 4 ratio) immediately after mixing and (c) Nafion/GO–NH2 (1 4 ratio) immediately after mixing and (c) Nafion/GO–NH2 (1![[thin space (1/6-em)]](https://www.rsc.org/images/entities/char_2009.gif) : :![[thin space (1/6-em)]](https://www.rsc.org/images/entities/char_2009.gif) 4 ratio) 15 min after mixing. 4 ratio) 15 min after mixing. | ||
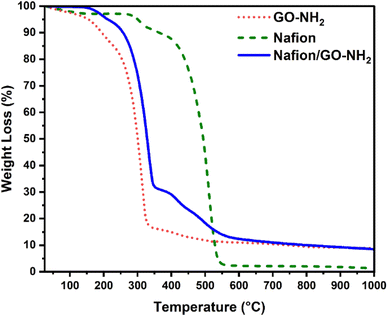
The TGA profile of Nafion shown in Fig. 5 is dominated by the evaporation of absorbed water that takes place at around 100 °C, the decomposition of sulfonic groups that commences at 300 °C, followed by the degradation of the polymer backbone at higher temperatures.38 The TGA profile of GO–NH2 also reflects the evaporation of water molecules below 100 °C, the removal of oxygen groups within the temperature range of 150–200 °C and the pyrolytic decomposition of the carbon framework above 200 °C.39 The TGA thermogram of Nafion/GO–NH2 demonstrates superior thermal stability in comparison to that of GO–NH2 alone with the nanocomposite system maintaining more than 90 wt% of its initial weight at 250 °C.
The LbL assembly is a well-established approach due to its simplicity, versatility and nanoscale control40 that allows the formation of coatings and self-standing membranes comprising polymers, nanoparticles, proteins, lipids, dye molecules and drugs.41 In order to optimise the polymer–particle electrostatic interactions during the build-up of LbL assemblies, the pH of GO–NH2 was set at 2 resulting in ζ = 26.7 mV, while the pH of the as received Nafion was measured to be 2.7 corresponding to ζ = −54.8 mV.
The QCM-D adsorption profile shown in Fig. 6 displays the formation of five Nafion/GO–NH2 bi-layers deposited onto a Nafion pre-coated crystal, referred to hereafter as (Naf/GO–NH2)5. As seen in Fig. 6 the initial hydration of the Nafion membrane results in a sharp drop in oscillating frequency (Δf) combined with a corresponding increase in the dissipation factor (D) due to the softening of the membrane, while the stable readings after the injection of water indicate that there is no dissolution of Nafion. The subsequent introduction of GO–NH2 results in a further drop in f that points to the presence of strong electrostatic interactions between Nafion and GO–NH2, while after the deposition of 5 bilayers the accumulative decrease in Δf is close to180 Hz. For comparison, we note that after 5 Nafion/GO deposition cycles, Δf drops by less than 10 Hz due to the absence of polymer–particle electrostatic attractions.
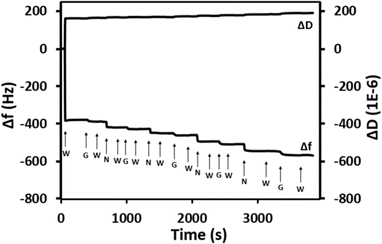 | ||
| Fig. 6 QCM-D measurements at 25 °C for (Naf/GO–NH2)5 (pH = 2). The letters “W”, “G” and “N” indicate the introduction of water, GO–NH2 and Nafion, respectively. | ||
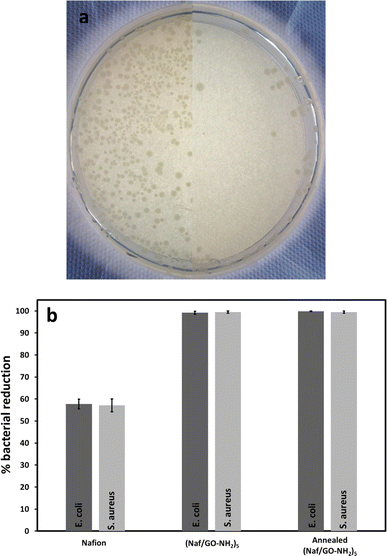
As shown in Fig. 7a and b, the (Naf/GO–NH2)5 coated crystal reduced the population of E. coli and S. aureus by 99.2% and 99.5%, respectively, compared to 57.7% and 57.1% for Nafion coated crystals. These observations can be explained in terms of the GO/Nafion synergistic antimicrobial action. First, it has been demonstrated that Nafion coated stainless steel inhibits E. coli colonization,18 given that its negative surface charges repel the negatively charged bacterial cells, thus creating a 40–60 μm EZ,14 that is governed by a non-equilibrium thermodynamic cross-effect combined with a diffusion-driven transport process.42 A recent study indicated that LbL assemblies comprising Nafion, lysozyme and chitosan resist E. coli and S. aureus colonization even when their surface zeta potential becomes positive, an effect that cannot be explained only on the basis of the EZ occurrence.14
Second, it is well-established that the antimicrobial mechanism of GO–based materials proceeds via the development of membrane stress caused by direct contact with the sharp nanosheets and the subsequent occurrence of oxidative stress.43 However, in suspension arrays the antimicrobial activity of GO increases with the size of nanosheets due to the dominant role of the cell entrapment mechanisms; when GO is incorporated, and thus immobilised, into coatings its antimicrobial activity is maximised for nanosheets with smaller surface area due to the pronounced contribution of the defect induced oxidative mechanisms.44 LbL assemblies of GO and a series of cationic dyes were shown to exhibit various levels of antibacterial activity against E. coli reaching up to 84.8% and S. aureus reaching up to 94.3%,45 while LbL films comprising [2-(methacryloyloxy)ethyl]trimethylammonium chloride functionalized reduced GO and poly(ethylene-co-vinyl alcohol) demonstrated 86.4 and 94.9% bacterial reduction against E. coli and S. aureus, respectively.46
Although a number of studies focus on the antimicrobial behaviour of GO–based polymeric materials, their performance following prolonged exposure to high temperatures has not been reported. In this study, (Naf/GO–NH2)5 coated crystals were heated at 200 °C for 2 h and their antimicrobial properties were assessed. As seen in Fig. 7, the thermally annealed coatings dramatically reduced the population of E. coli and S. aureus by 99.8% and 99.5%, respectively. To the best of our knowledge this is the first study that discloses polymer based coatings that can withstand harsh thermal treatment without compromising their antimicrobial activity. For reference we note that release based antimicrobial coatings impregnated with antibiotics only offer short-term protection and are considered responsible for the increased resistance of bacterial strains, while the contact killing efficiency of drug-free coatings following high temperature treatment has not been systematically investigated. Due to their supreme performance the coatings reported here can be applied in built-in antimicrobial technologies for thermal disinfection, food processing, storage and service as well as in surgical blades, containers of biological materials and packaging for drugs and cosmetics.
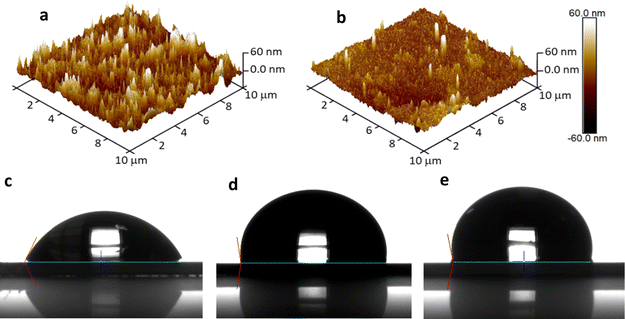
In order to gain insights into the topological characteristics of the LbL assemblies, the 3D AFM images of (Naf/GO–NH2)5 and annealed-(Naf/GO–NH2)5 crystals were recorded as displayed in Fig. 8a and b, respectively. The surface morphology of (Naf/GO–NH2)5 reveals the presence of aggregates, consistent with observations in LbL assemblies featuring GO–based outermost layers,47 as well as in polyethyleneimine/GO LbL nanocoatings.48,49 Our results suggest a significant reduction in surface roughness from Ra = 10.2 ± 0.6 nm for (Naf/GO–NH2)5 to Ra = 6.6 ± 1.0 nm for annealed-(Naf/GO–NH2)5. This surface smoothing points to a major surface reorganization of the polymer chains that experience temperatures far above their glass transition Tg.50
These pronounced surface rearrangements induced during thermal annealing are also reflected in the significant changes in water contact angles (θ) shown in Fig. 8. In particular, the water contact angles for (Naf/GO–NH2)5 and its thermally annealed counterpart were found to be 61.4° and 97.2° (Fig. 8c and d, respectively), compared to 100.7° for the Nafion coated substrate (Fig. 8e), while a value close to 100° has been reported for a commercial Nafion membrane.51 The increase in the water contact angle of Nafion upon thermal annealing at temperatures above its Tg has been attributed to a major surface reorganization resulting in the partial withdrawal of sulfonate groups. This process leads to a stable state at temperatures close to 150 °C, above which no further changes in water contact angle are observed.52 We note that in principle, hydrophobic surfaces are more efficient in resisting bioadhesion; however, there is evidence indicating that intermediate contact angles such as those observed in this study might also be effective in preventing pathogen contamination.53
In order to assess their chemical resistance (Naf/GO–NH2)5 and annealed-(Naf/GO–NH2)5 coated crystals were immersed for 10 min in three different solvents namely ethanol, acetone and 5 wt% aqueous sodium hypochlorite. The solutions were subsequently analysed using UV-vis spectroscopy and in all cases no traces of GO–NH2 were detected, which indicated that the coatings are stable when exposed to these environments. In a further experiment (Naf/GO–NH2)5 and annealed-(Naf/GO–NH2)5 coated crystals were subjected to soft tribological assessment using PDMS to mimic human skin as described in the Experimental section. It was observed that (Naf/GO–NH2)5 and annealed-(Naf/GO–NH2)5 coatings can withstand ![[small gamma, Greek, dot above]](https://www.rsc.org/images/entities/i_char_e0a2.gif) up to the maximum value considered (
up to the maximum value considered (![[small gamma, Greek, dot above]](https://www.rsc.org/images/entities/i_char_e0a2.gif) = 4 × 10⁵ s−1), without any detectable detachment of GO–NH2 (as assessed spectrometrically).
= 4 × 10⁵ s−1), without any detectable detachment of GO–NH2 (as assessed spectrometrically).
Conclusions
In conclusion, we disclose electrostatically assembled synergistic platforms between Nafion (pH = 2.7, ζ = −54.8 mV) and GO–NH2 (pH = 2, ζ = 26.7) able to reduce the population of E. coli and S. aureus by more than 99%. This is the first study that reports polymer based LbL assemblies that can withstand prolonged exposure to high temperatures without compromising their superior antimicrobial performance. The coatings show remarkable chemical stability against a range of solvents and were able to resist detachment when subjected to significant friction forces. The study suggests an effective approach for the development of drug-free, structurally stable and thermally resistant nanocoatings that show great promise in combating microbial contamination.Author contributions
M. S. B. investigation, methodology, data curation, writing original draft; E. G., M. H., and S. G. methodology, data curation; M. K. supervision, methodology; A. K. conceptualization, methodology, investigation, writing original draft, writing – review and editing, supervision, and project administration.Conflicts of interest
There are no conflicts to declare.Acknowledgements
Financial support from the Higher Education Innovation Fund (Research England) is gratefully acknowledged. S. G. was supported by the University Alliance Doctoral Training Alliance under the Marie Skłodowska-Curie actions.References
- M. Salwiczek, Y. Qu, J. Gardiner, R. A. Strugnell, T. Lithgow, K. M. McLean and H. Thissen, Trends Biotechnol., 2014, 32, 82 CrossRef CAS PubMed.
- M. Birkett, L. Dover, C. Cherian Lukose, A. Wasy Zia, M. M. Tambuwala and Á. Serrano-Aroca, Int. J. Mol. Sci., 2022, 23, 1162 CrossRef CAS PubMed.
- L. Ferreira and A. Zumbuehl, J. Mater. Chem., 2009, 19, 7796 RSC.
- F. Pietsch, A. J. O'Neill, A. Ivask, H. Jenssen, J. Inkinen, A. Kahru, M. Ahonen and F. Schreiber, J. Hosp. Infect., 2020, 106, 115 CrossRef CAS PubMed.
- M. L. Knetsch and L. H. Koole, Polymers, 2011, 3, 340 CrossRef CAS.
- Q. Yu, Z. Wu and H. Chen, Acta Biomater., 2015, 16, 1 CrossRef CAS PubMed.
- A. Fuchs and J. Tiller, Angew. Chem., Int. Ed., 2006, 45, 6759 CrossRef CAS PubMed.
- J. Zhang, W. Guo, Q. Li, Z. Wang and S. Liu, Environ. Sci.: Nano, 2018, 5, 2482 RSC.
- S. C. Smith and D. F. Rodrigues, Carbon, 2015, 91, 122 CrossRef CAS.
- Md. T. Aunkor, T. Raihan, S. H. Prodhan, H. S. Metselaar, S. U. Malik and A. K. Azad, R. Soc. Open Sci., 2020, 7, 200640 CrossRef CAS PubMed.
- X. Zeng, G. Wang, Y. Liu and X. Zhang, Environ. Sci.: Nano, 2017, 4, 2248 RSC.
- H. M. Hegab, A. ElMekawy, L. Zou, D. Mulcahy, C. P. Saint and M. Ginic-Markovic, Carbon, 2016, 105, 362 CrossRef CAS.
- R. Kuwertz, C. Kirstein, T. Turek and U. Kunz, J. Membr. Sci., 2016, 500, 225 CrossRef CAS.
- E. N. Gibbons, C. Winder, E. Barron, D. Fernandes, M. J. Krysmann, A. Kelarakis, A. V. Parry and S. G. Yeates, Nanomaterials, 2019, 9, 1563 CrossRef CAS PubMed.
- D. W. Lee, T.-K. Hong, D. Kang, J. Lee, M. Heo, J. Y. Kim, B.-S. Kim and H. S. Shin, J. Mater. Chem., 2011, 21, 3438 RSC.
- G. Sauerbrey, Z. Phys., 1959, 155, 206 CrossRef CAS.
- M. Rodahl, F. Höök, A. Krozer, P. Brzezinski and B. Kasemo, Rev. Sci. Instrum., 1995, 66, 3924 CrossRef CAS.
- L. J. Zhong, L. Q. Pang, L. M. Che, X. E. Wu and X. D. Chen, Colloids Surf., B, 2013, 111, 252 CrossRef CAS PubMed.
- K. Timm, C. Myant, H. A. Spikes and M. Grunze, Tribol. Int., 2011, 44, 1695–1703 CrossRef CAS.
- J. Lee, J. Lu, A. Potanin and C. Boyke, Biotribology, 2021, 28, 100201 CrossRef.
- N. H. Kim, T. Kuila and J. H. Lee, J. Mater. Chem. A, 2013, 1, 1349 RSC.
- Q. Wang, G. Zhao, C. Li and H. Meng, J. Membr. Sci., 2019, 586, 177 CrossRef CAS.
- J. U. Lee, W. Lee, J. W. Yi, S. S. Yoon, S. B. Lee, B. M. Jung, B. S. Kim and J. H. Byun, J. Mater. Chem. A, 2013, 1, 12893 RSC.
- J. Tian, T. Sun, B. Qiu, X. Zhang, S. Xia, Y. Chen, H. Zou and M. Liang, Macromol. Mater. Eng., 2022, 307, 2200433 CrossRef CAS.
- M. D. Pravin, S. Chris Felshia and A. Gnanamani, RSC Adv., 2018, 8, 38416 RSC.
- S. Verma and R. K. Dutta, RSC Adv., 2015, 5, 77192 RSC.
- T. Hwang, V. Palmre, J. Nam, D.-C. Lee and K. J. Kim, Smart Mater. Struct., 2015, 24, 105011 CrossRef.
- V. Di Noto, R. Gliubizzi, E. Negro and G. Pace, J. Phys. Chem. B, 2006, 110, 24972 CrossRef CAS PubMed.
- R. Tannenbaum, M. Rajagopalan and A. Eisenberg, J. Polym. Sci., Part B: Polym. Phys., 2003, 41, 1814 CrossRef CAS.
- N. A. Nazir, H. Kudo, T. Nishikubo and T. Kyu, J. Mater. Sci., 2012, 47, 7269 CrossRef CAS.
- D. G. Abebe and T. R. Farhat, Soft Matter, 2010, 6, 1325 CAS.
- B. Konkena and S. Vasudevan, J. Phys. Chem. Lett., 2012, 3, 867 CrossRef CAS PubMed.
- J. Chen, L. Yang, S. Li and W. Ding, Molecules, 2018, 23, 1104 CrossRef PubMed.
- Z. Su, N. Pramounmat, S. T. Watson and J. N. Renner, Soft Matter, 2018, 14, 3528 RSC.
- D. Fernandes, W. Kluska, J. Stanislawska, B. Board, M. J. Krysmann and A. Kelarakis, Polymer, 2017, 114, 73 CrossRef CAS.
- A. Kelarakis and M. J. Krysmann, Colloids Interface Sci. Commun., 2014, 1, 31 CrossRef CAS.
- X. Guo, Y. Fan, J. Xu, L. Wang and J. Zheng, Ind. Eng. Chem. Res., 2020, 59, 14825 CrossRef CAS.
- R. Sigwadi, M. S. Dhlamini, T. Mokrani, F. Ṋemavhola, P. F. Nonjola and P. F. Msomi, Heliyon, 2019, 5, 2240 Search PubMed.
- F. Farivar, P. Lay Yap, R. U. Karunagaran and D. Losic, C, 2021, 7, 41 CAS.
- J. J. Richardson, M. Björnmalm and F. Caruso, Science, 2015, 348, 6233 CrossRef PubMed.
- Y. Wang, A. S. Angelatos and F. Caruso, Chem. Mater., 2007, 20, 848 CrossRef.
- I. Huszár, Z. Mártonfalvi, A. Laki, K. Iván and M. Kellermayer, Entropy, 2014, 16, 4322 CrossRef.
- S. Liu, T. H. Zeng, M. Hofmann, E. Burcombe, J. Wei, R. Jiang, J. Kong and Y. Chen, ACS Nano, 2011, 5, 6971 CrossRef CAS PubMed.
- F. Perreault, A. F. de Faria, S. Nejati and M. Elimelech, ACS Nano, 2015, 9, 7226–7236 CrossRef CAS PubMed.
- Y.-H. Gu, X. Yan, Y. Chen, X.-J. Guo and W.-Z. Lang, J. Membr. Sci., 2022, 658, 120738 CrossRef CAS.
- H. Wang, M. Chen, C. Jin, B. Niu, S. Jiang, X. Li and S. Jiang, J. Agric. Food Chem., 2018, 66, 732 CrossRef CAS PubMed.
- F. A. Santos, N. C. S. Vieira, N. A. Zambianco, B. C. Janegitz and V. Zucolotto, Appl. Surf. Sci., 2021, 543, 148698 CrossRef CAS.
- L. Zhao, B. Yuan, Y. Geng, C. Yu, N. H. Kim, J. H. Lee and P. Li, Composites, Part A, 2015, 78, 60 CrossRef CAS.
- T. Wang, J. Lu, L. Mao and Z. Wang, J. Membr. Sci., 2016, 515, 125 CrossRef CAS.
- T. A. Pham, S. Koo, H. Park, Q. T. Luong, O. J. Kwon, S. Jang, S. M. Kim and K. Kim, Polymers, 2021, 13, 4018 CrossRef CAS PubMed.
- R. Sigwadi, M. S. Dhlamini, T. Mokrani and F. Nemavhola, Heliyon, 2019, 5, 2112 Search PubMed.
- D. K. Paul and K. Karan, J. Phys. Chem. C, 2014, 118, 1828–1835 CrossRef CAS.
- X. Zhu, S. Guo, D. Jańczewski, F. J. Parra Velandia, S. L.-M. Teo and G. J. Vancso, Langmuir, 2013, 30, 288 CrossRef PubMed.
| This journal is © The Royal Society of Chemistry 2024 |

