
 Open Access Article
 This Open Access Article is licensed under a Creative Commons Attribution-Non Commercial 3.0 Unported Licence
Embedding plasmonic nanoparticles in soft crystals: an approach exploiting CTAB–I structures†
Navyashree
Vasudeva
 ,
Annie
Jayasing
,
Kishorkumar
Sindogi
,
Isha
Yadav
,
T. N. Guru
Row
,
Sheetal K.
Jain
and
Anshu
Pandey
*
,
Annie
Jayasing
,
Kishorkumar
Sindogi
,
Isha
Yadav
,
T. N. Guru
Row
,
Sheetal K.
Jain
and
Anshu
Pandey
*
Solid State and Structural Chemistry Unit, Indian Institute of Science, CV Raman Road, Bengaluru 560012, India. E-mail: anshup@iisc.ac.in
First published on 5th March 2024
Abstract
Embedding nanoparticles with different functionalities into soft substrates is a convenient tool to realize technologically significant multifunctional materials. This study focuses on incorporating bimetallic plasmonic nanoparticles into soft crystals made of cetyltrimethylammonium bromide–iodide. We observed the emergence of a novel symmetry-lowered cetrimonium crystal polymorph that enables the realization of strong interparticle plasmonic coupling in these composite materials. The observed crystal polymorph exhibits a triclinic structure with significantly reduced unit cell volume compared to standard CTAB. Solid-state nuclear magnetic resonance studies revealed an enhanced cetrimonium chain rigidity and a commensurate decrease in the mobility of the methyl groups. This is attributed to iodide incorporation. To study the influence of these interactions on solution phase dynamical properties, we employed light scattering measurements using gold nanospheres as markers, where we observed aggregation of these particles. We then develop a two step synthetic scheme that successfully enables high levels (533 particles per μm2) of incorporation of bimetallic plasmonic particles into the emergent crystal polymorph.
1. Introduction
Modern technology increasingly relies upon materials that simultaneously exhibit properties generally associated with hard and soft materials.1,2 Examples range from liquid crystals3 to flexible electronics.4,5 A desirable approach towards realizing materials for such applications is to combine nanoparticles with a “hard” functionality with a material such as an organic or an inorganic crystal. For example, the inorganic nanocrystal component can be variously optimized by controlling its size6,7 or shape.8,9 Further, more recent approaches have also led to inorganic building blocks, where diverse inorganic components, such as semiconductor/semiconductor,10,11 semiconductor/metal,12 semiconductor/piezoelectric,13etc., are realized within the same architecture. The inclusion of nanoparticles (NPs) into crystals has been discussed previously in the literature. For example, Liu et al. successfully functionalized calcite crystals with metallic and magnetic functionalities by incorporating Au and Fe3O4 nanocrystals into calcite.14 Liu and coworkers have shown that carbon dots embedded in NaCl crystals result in a longer photoluminescence lifetime.15 In addition to single crystals, researchers have also explored a polymer and liquid crystal (LC) matrix to incorporate the NPs; Heilmann et al. have shown that the embedding of Ag NPs into a polymer matrix results in the blue shifting of transmission minima of the plasmon resonance absorption of the silver particles with increasing packing density of Ag NPs.16 Pendery et al. illustrated that in the case of hybrid liquid crystal-NPs, the properties of both LC and NPs could be exploited where the self-assembly of NPs can be achieved with a liquid crystal matrix, and in addition, anisotropy is generated in the LSPR (localized surface plasmon resonance) of metal NPs because of the polarization-dependent optical properties of the liquid crystal.17In this work, we look to extend these advances to develop soft crystals doped with plasmonic nanoparticles. We achieve a high-density packing of Au–Ag bimetallic nanoparticles (533 particles per μm2) into a novel cetrimonium halide polymorph prepared using cetyltrimethylammonium bromide (CTAB) as the starting material. CTAB is a commonly used surfactant in colloidal synthesis, particularly in the preparation of metal NPs.18–20 It has also been explored as a shape-control agent in syntheses involving semiconductors.21 More recent studies have emphasized the usage of CTAB mesophases as well as gels for NP synthesis.22,23 The extension of the utility of CTAB as a convenient substrate for the preparation of nanoparticle-in-crystal architectures is thus a significant advance. We employ potassium iodide as an additive that leads to the emergence of iodide-rich CTAB crystals (CTAB–I). By crystallographic studies, we show that these crystals have a lower symmetry and a smaller unit cell volume compared to standard CTAB and CTAI. Using solid-state nuclear magnetic resonance (SSNMR), we found the stiffening of the alkyl chain due to the addition of KI. We further demonstrate the remarkable proclivity of these crystals to act as hosts for nanoparticles. In particular, we developed a two-step protocol, where NPs are formed in the first step and in the second step CTAB–I sheets are grown that enables the embedding of plasmonic nanoparticles into these crystals in situ. The addition of KI otherwise is known to aggregate the nanoparticles/CTAB colloidal dispersions, which is confirmed by DLS (Dynamic Light Scattering) studies. We show from optical and TEM images (t = 30 minutes) that the particles formed via this method do not show aggregation and thus further confirm that CTAB–I sheets are formed only after 5 hours. The resultant materials exhibit strong interparticle plasmonic coupling that is manifested in the optical reflectivity of these materials. Our method thus provides a novel route to prepare mesoscopic soft crystals with strongly coupled plasmonic modes.
2. Experimental details
2.1 Materials
Cetyltrimethylammonium bromide (CTAB) from Sigma-Aldrich (≥99% pure), potassium iodide (KI) from Sigma-Aldrich (ACS reagent, ≥99.0% pure), silver nitrate (AgNO3) from Sigma-Aldrich (ACS reagent, ≥99.0% pure), sodium borohydride powder (NaBH4) from Sigma-Aldrich (≥98.0% pure), tetrachloroauric(III) acid (HAuCl4) from Sigma-Aldrich (ACS, 99.99% pure, metal basis), L-ascorbic acid from Sigma-Aldrich (99%), and sodium hydrogen carbonate (NaHCO3) from SDFCL (AR, ACS grade) were used as received. All the aqueous solutions have been prepared in 18.2 MΩ Milli-Q water at 25 °C to avoid any metal contamination.2.2 Synthetic procedures
5 mL aqueous solution of 0.5 mM HAuCl4 was added to 5 mL of 0.1 M CTAB solution (aqueous). After vigorous stirring, 0.6 mL of 0.01 M NaBH4 (aq. soln) was added to the reaction mixture. The brownish colour of the final solution indicates the formation of gold nanocrystals. These nanocrystals were used as seeds for the synthesis of Au nanospheres.
A 500 mL growth solution comprising 5 mM HAuCl4 and 0.1 M CTAB in 500 mL water was prepared. 3 mL of 0.079 M ascorbic acid was added till the solution became colorless due to partial reduction of Au3+ to Au+, and then 0.8 mL of Au seed was added swiftly to the growth solution. This growth solution was shaken well and kept overnight.
The obtained Au nanospheres were separated from the growth solution by centrifugation (7392 RCF for 10 minutes) and washed with water twice to remove excess surfactant and ions to collect the precipitate. The obtained product was dispersed in water to achieve the required optical density of 0.1 shown in Fig. S1a.† The prepared GNSs were spherical with an average size of 22 nm, Fig. S1b and c.† The HRTEM analysis in Fig. S1d† shows the surface states with a lattice planar distance of 0.235 nm corresponding to the plane (111) of Au.
This reaction mixture was left undisturbed for 5 hours at room temperature without stirring. After 5 hours, the solution was centrifuged for 5 minutes at 4100 RCF. The supernatant was discarded, and the precipitate containing CTAB–I sheets embedded with Au–Ag NPs was collected and cleaned twice with water by centrifugation and was used for further measurements.
2.3 Physical methods
The powder XRD data are collected using a PANalytical diffractometer with Cu-Kα radiation having a wavelength of 1.542 Å. UV-visible spectroscopy was performed using an Ocean Optics spectrometer on a quartz cuvette with a 1 cm path length from LARK. TEM/HRTEM/STEM images were collected using a Thermo Scientific (FEI) Themis TITAN TEM operating at 300 kV. TEM images were acquired using a 4K × 4K CMOS camera. Samples were prepared by drop casting 50 μL of suspended aqueous solution onto continuous carbon 300 mesh Cu grids from Ted Pella, Inc. DLS studies were performed using a Zeta Phase Analysis Light Scattering (Zeta PALS) spectrometer from Brookhaven instruments using a red laser (660 nm). SEM images were recorded using a Zeiss Ultra55 with an EsB detector. AFM measurements were carried out in tapping mode using a PARK AFM NX20. Transmittance and reflectance measurements were carried out in a 150 mm integrating sphere installed in a LAMBDA 1050+ PerkinElmer spectrometer. Differential thermal analysis (DTA) was performed on a METTLER-TOLEDO. The analysis was conducted in a nitrogen atmosphere (100 mL min−1) between 18 and 350 °C. A sample of 7 mg was put in a Pt cell and heated at a constant rate of 2 °C min−1. All the solid-state NMR experiments were performed on a 400 MHz JEOL NMR spectrometer using a 10 kHz sample spinning at the magic angle to the magnetic field. The samples were packed in a 4 mm rotor in powder form. An excitation pulse of length 3.75 μs was used on the 1H channel, followed by a cross-polarization (CP) block of length 1.1 ms for 1H to 13C polarization transfer. TPPM (two pulse phase modulated) decoupling was used during acquisition. 512 scans were used for signal averaging with a recycle delay of 5 s.3. Results and discussion
3.1 Structural and thermal analysis of CTAB–I structures
Unlike thiols, CTAB is a non-binding surfactant.26 CTAB in water exists in multiple phases, such as a micellar phase, a hexagonal liquid crystalline phase, a cubic phase, and a lamellar phase, depending on its concentration.27–30 Generally, the micellar phase of CTAB is used as a surfactant in NP synthesis.31 The addition of salt to micelles is found to disrupt the structure of the micelles. Zhang et al. have shown that KBr addition to CTAB leads to micellar shape change from spherical to rod micelles and to worm-like at high salt concentrations.32Cookey and co-workers have shown that the critical micelle concentration (CMC) of aqueous CTAB lowered with increased NaBr salt concentration.33 In this paper, we extend the electrolytic control over CTAB assemblies by demonstrating the KI-induced growth of a cetrimonium halide crystal polymorph that forms two-dimensional sheets (a polymorph of CTAB). For brevity, we refer to this polymorph as CTAB–I.
Motivated by past reports that have studied the effects of electrolytes upon CTAB micelles,34 we first examine the impact of KI concentration on CTAB dispersions. For analysis, 8%, 16%, 24%, 32%, and 40% (VKI/VCTAB) CTAB–I mixtures were prepared where 8% solution contains 40 μL of 0.1 M KI in 5 mL 0.01 M CTAB. The details have been described in the previous section. We found that 8 and 16% addition of KI to CTAB causes turbidity in the solution. However, the solution reverts to its transparent micellar form upon reheating to 40 °C (Fig. S2a†). These changes are entirely consistent with past reports and have been attributed to a change of the micellar structure from spherical to worm-like upon electrolyte addition.34 In contrast, ≥24% KI addition leads to an irreversible change and stable, clear solutions could not be recovered by annealing at 40 °C (Fig. S2b†). Although stable to heat, the turbidity does disappear over time along with the appearance of crystals at the flask bottom. We isolate the crystalline deposit of CTAB–I from the solution by decanting the supernatant liquid. Examination of the deposit with a 40× optical microscope reveals the formation of sheets. We again note that these sheets form only at high concentrations of KI (≥24%) (Fig. S3†). In contrast, the continuous films of CTAB are observed even upon drying CTAB–I solutions with <24% KI on a substrate. Further analysis of these sheets by SEM (Scanning Electron Microscopy), as shown in Fig. 1a, reveals rhombus-shaped crystals with a typical area of 792 ± 209 μm2. The EDS (Energy-Dispersive X-ray Spectroscopy) spectrum in Fig. S4† revealed the relative composition ratio of iodine to bromine to be 5![[thin space (1/6-em)]](https://www.rsc.org/images/entities/char_2009.gif) :3, thus indicating iodide ion incorporation into the CTAB structure. Fig. 1b shows the elemental mapping of the sheets, where we observe the uniform distribution of iodine and bromine species in the sheets.
:3, thus indicating iodide ion incorporation into the CTAB structure. Fig. 1b shows the elemental mapping of the sheets, where we observe the uniform distribution of iodine and bromine species in the sheets.
 | ||
| Fig. 1 (a) SEM image of CTAB–I (40% KI added CTAB). (b) Elemental mapping of the selected region of (a) showing the distribution of iodine and bromine in CTAB–I sheets (scale bar 25 μm). (c) Comparison of the PXRD pattern of the as-obtained CTAB–I with standard CTAB and CTAI. (d) Solid-state 13C NMR spectra of CTAB and CTAB–I. | ||
We analyzed the crystallographic properties of these sheets using powder X-ray diffraction (PXRD). Fig. 1c shows the PXRD pattern of the as-obtained 40% (VKI/VCTAB) CTAB–I mixture with standard CTAB (#1122962) and CTAI (#679105). The as-formed CTAB–I mixture matches with neither CTAB nor CTAI.
Further profile refinement analysis of the obtained CTAB–I with CTAB and CTAI confirms the mismatch of the three peaks at 2θ positions of 6.5°, 9.9°, and 13.36° with known cetrimonium halide crystal polymorphs. From the observed patterns, we further note the absence of independent crystallization of KI (Fig. S5a†). We therefore attribute the observed pattern to a hitherto unreported polymorph of cetrimonium (CTA) based compounds. In the literature, polymorphs of CTAB and CTAI have been extensively studied. Detailed comparisons of our observations with values reported in the literature at room temperature (283–303 K) for CTAB and CTAI are shown in Tables S1 and S2,† respectively. As evident in these tables, cetrimonium salts exhibit different crystalline morphologies depending on the number and the nature of counter ions (Br− and I−) surrounding the cation head.35,36 In addition, there is an overall tendency for lower symmetry crystals being observed for iodide variants.37,38 Thus, most polymorphs of CTAI crystallize in the triclinic crystal system, while all CTAB polymorphs crystallize in the higher-symmetry monoclinic crystal system.39 However, we note that a single exception to the above observation has been reported in the literature.38 Besides symmetry lowering, CTAI exhibits significantly smaller unit cell volumes compared to CTAB. In particular, the CTAI unit cell volume is 42% of the CTAB unit cell volume. Based on the above observations, we take CTAB as our reference point of comparison. We find that the presence of potassium iodide leads the conventionally known monoclinic structure (CTAB) to crystallize in a triclinic structure with unit cell parameters a = 14.732 Å, b = 9.909 Å, c = 6.297 Å, α = 91.633°, β = 102.74°, γ = 106.785°, and V = 792.95 Å3. The emergent crystal polymorph observed by us has a significantly smaller unit cell volume, compared to standard reported CTAB, whose volume is V = 2126.76 Å3; 62.7% reduction in the unit cell volume is noted, and when compared to CTAI whose V = 1124.6 Å3, 29.5% reduction is noted. This significantly reduced cell volume primarily arises from a remarkably reduced c-axis elongation, i.e., from 52.07 Å (CTAB) to 6.29 Å (CTAB–I). We entirely attribute the very different chemical properties of CTAB–I, as described later in this manuscript, to this emergent crystal polymorph. Though the indexing was done for the 40% CTAB–I mixture, the powder patterns for other CTAB–I mixtures (8% to 32%) matched the 40%, as shown in Fig. S5b.† The DTA (Differential Thermal Analysis) curves of pure CTAB and as-prepared CTAB–I are shown in Fig. S6.† The DTA curve of pure CTAB (red) has two endothermic peaks at 105 and 254 °C. The DTA curve (blue) for CTAB–I exhibits three strong endothermic peaks at 104, 120, and 238 °C respectively. The peaks for CTAB at 105 °C are attributed to the desorption process of moisture adsorbed on the surface of CTAB.40 In analogy, we attribute the 104–120 °C features in CTAB–I to the same desorption process. We note that the crystal melting point for pure CTAB is observed at 254 °C while CTAB–I shows a similar feature at 238 °C. We note that this is lower to the melting features of pure CTAB and CTAI.41 Thus, the DTA analysis further corroborates our hypothesis on newly formed polymorph of CTAB–I. Its melting point being 16 °C less than that of pure CTAB (10 °C less than that of pure CTAI)41 further confirms its instability relative to pure CTAB or CTAI. To understand the molecular nature of interactions that lead to this emergent cetrimonium polymorph, we probe the crystals using 13C SSNMR.
Fig. 1d shows the 13C solid-state NMR spectra for CTAB and CTAB–I samples. The peak around 16.6 ppm corresponding to the carbon at the end (C16) remains the same before and after adding KI. The peaks in the 20.0 to 37.0 ppm range belong to C2–C15 sites (highlighted in the orange box) in Fig. 1d show a clear increment in the line width after KI addition. The same behaviour is shown by the peak from C1 at 66.5 ppm, which significantly broadens out in the case of the CTAB–I sample. Note that the peak intensity is significantly lower for the C1 case than C16 because of the difference in the number of protons located in their proximity. The most striking difference is observed in the methyl carbon peaks in the range 52.0 to 56.0 ppm, where the peak intensity is significantly higher for the CTAB–I case than the CTAB case. The increased line widths of C1 and C2–C15 peaks are ascribed to the reduced mobility of the carbon chain in the case of CTAB–I. The mobility of the terminating site C16 remains unchanged, as reflected in its peak features. The change in methyl carbon intensity is also a manifestation of the reduced mobility of these groups that changes the rotating frame relaxation rates of 13C (T1rho). The change in the T1rho affects the cross-polarization from 1H to 13C, which gives no signal in the case of CTAB but works for CTAB–I. Overall, the NMR data suggest that the CTAB–I system shows reduced mobility in methyl as well as the other carbons of the alkyl chain. This reduced mobility is consistent with significant molecular ordering changes and is likely the origin of the emergent polymorph. We thus infer that the interactions of iodide with CTAB are directly responsible for the dynamic and crystallographic properties of the CTAB–I system.
From the above, we note that the CTAB–I crystal presents a significantly crowded environment for the C2–C15 carbons. This is consistent with c-axis contraction. A similar effect is seen in the case of the methyl groups that show reduced mobility relative to a pure CTAB crystal. At the same time the mobility of the terminal C16 carbon relative to CTAB is unchanged. Overall, these changes lead us to hypothesize unusual folding of the cetyl chain that allows the C16 carbon to be present in a less crowded environment compared to the other carbon atoms, possibly towards the crystal surface. This change in chain conformation is indeed consistent with the reduced unit cell volume of the CTAB–I crystal as well as with its lower melting point.
3.2 Effect of iodide on CTAB capped Au NSs
The dynamics of the initial solution phase processes that occur in CTAB–I were studied using dynamic light scattering (DLS) techniques. As noted previously, CTAB–I dispersions are unstable and aggregate rapidly over time, which makes the precise determination of their light-scattering properties extremely challenging. Zhang and coworkers have studied the effect of KBr on the micellar properties of CTAB using light scattering32 and fluorescent probes.32,42 We, therefore, employ gold nanospheres (GNSs) as markers. As the GNSs are capped with CTAB, the hydrodynamic radius of micellar CTAB will be equivalent to the size/volume of GNSs, and thus any change in the light scattering properties of GNSs can be attributed to micellar properties as well, thus enabling us to track the KI induced dynamics of CTAB dispersions. Initial DLS measurements show the average size of GNSs as 38 nm. Upon systematically increasing KI content, GNS sizes increased to 344 nm. Fig. 2a plots the volume of GNSs as a function of solution KI content. We find an exponential increase in GNS volume with increasing KI with an exponential prefactor of 44 nm3 and an exponential constant of 0.58. The exponential nature of this curve is consistent with the strong influence of KI on CTAB solutions. For these experiments, cleaned GNSs with an optical density of 0.1 were dispersed in DI water and used for measurements. To further confirm GNS aggregate formation due to the addition of KI, optical spectra of GNSs were recorded after the addition of KI. The evolution of Au LSPR at 530 nm was observed. In Fig. 2b, the narrow peak at 530 nm is broadened while giving rise to a tail of ∼600 nm due to GNS aggregation.43 The SEM image of GNSs, before and after the addition of KI, clearly shows that well-separated particles of GNSs (Fig. S7a†) aggregate (Fig. S7b†) after KI is added. Gold nanoparticles thus serve as extremely useful markers to indicate the properties of CTAB dispersions and enable us to infer the KI-induced aggregation of CTAB micelles. | ||
| Fig. 2 (a) DLS study of GNSs with varying amounts of KI. (b) Extinction spectra of GNSs with increasing concentration of KI. | ||
Thus, the DLS study emphasizes that the initial effects of KI addition are limited to the aggregation/destabilization of the particles dispersed in the CTAB solution. Our work stems from observing a crystalline CTAB assembly that emerges only after treating CTAB solutions with KI over longer times and not instantaneously. This motivates our two-step model of synthesizing the embedded NPs. In our approach, the first step is mixing the CTAB–KI solutions with the metal precursors and reducing it to form nanoparticles and then in the second step this solution is incubated for more than 5 hours at room temperature to form the CTAB–I assembly with simultaneously embedding the nanoparticles. Here we emphasize that the addition of KI to already prepared NPs i.e. CTAB capped GNSs results in aggregation only and neither the sheets of CTAB–I are formed nor the embedding of GNSs is observed. Thus, the two-step approach outlined in detail in Section 3.3 and discussed in 3.4 avoids aggregation and successfully enables nanoparticle embedding into CTAB–I crystals.
3.3 In situ embedding of bimetallic Au–Ag into CTAB–I polymorphs
As an extension of the method with not just limiting to monometallic embedding of NPs, we developed a single synthetic protocol where the bimetallic Au–Ag nanoparticles are embedded into CTAB–I sheets. Bimetallic Au–Ag nanoparticles have significant advantages in terms of their resonance tuning range compared to individual Au and Ag NPs.44 Their localized surface plasmon resonances (LSPRs) can be tuned across a wide range of wavelengths just by regulating composition even when parameters such as size, shape, composition, and the medium dielectric are held constant.45 In addition, the available plasmonic states for strong coupling is extended for bimetallic Au–Ag through a wide visible region of the spectrum than individual Ag or Au whose LSPR is restricted to 400 nm and 530 nm respectively.46 With this extra flexibility in mind, we pick bimetallic Au–Ag particles for embedding.Our method relies on two distinct steps: the nucleation of bimetallic Au–Ag particles and their subsequent embedding leading to the close packing of particles into the CTAB–I sheet architectures. Here we note that the first step is a fast process and is sensitive to parameters like pH, temperature, time of addition of each reagent, and mixing rates. The second slow step involves CTAB–I crystal growth and simultaneous Au–Ag particle embedding. Based on the discussion above, we picked conditions where in a typical synthesis, a 5 mL aqueous solution of 10 mM CTAB was first stabilized at pH ∼ 8 by adding a 0.5 mL 0.1 M NaHCO3 buffer solution. In addition, the temperature was maintained at ∼25 °C. This limits the possibility of the emergence of other CTAB micellar structures or polymorphs that are more prevalent at higher temperatures.36,42 To this CTAB solution, 120 μL of 0.1 M KI and 5 mL of 1 mM AgNO3 are added and the reaction mixture is left to stand to turn turbid due to the formation of silver halide colloids;43 once the solution turns turbid 4 mL gold nanospheres (GNSs) of 0.1 OD, which act as a template for the Ag to deposit, is added. The optical and structural characterization of the GNSs used is shown in Fig. S1.† After the addition of GNSs, 50 μL of 10 mM aqueous HAuCl4 is added. This colloidal mixture of metal precursors is reduced by ice-cold NaBH4 to form metallic Au–Ag NPs. This step leads to the nucleation of spherical Au–Ag NPs. After the reduction event, the reaction mixture containing Au–Ag NPs slowly embeds in the in situ-grown CTAB–I sheets. In a typical synthesis, we observe an initial formation of nanoparticles upon sodium borohydride addition. Upon aging, haze develops due to light scattering by CTAB–I sheets. The embedding of plasmonic NPs can be clearly seen in low-resolution TEM (Transmission Electron Microscopy) shown in Fig. 3a; as evident from this figure, the embedding of particles does not fundamentally alter the morphology of the sheets. Particle-embedded sheets are rectangular, with a width of 4.5 ± 0.8 μm and a length of 12.5 ± 3.2 μm. Fig. 3b shows the HAADF (high annular aperture-dark field) image with the elemental composition maps of the samples, where the sheet shows the distribution of bromine and iodine, and the embedded particles are bimetallic containing both silver and gold. A typical sheet has ∼553 NPs per μm2, making these materials interesting for studying inter-plasmonic interactions. Particles embedded in the sheets are spherical with an average size of 15 ± 3.2 nm (Fig. 3c). Since it is the in situ embedding of nanoparticles, we do observe a small population of particles that are loosely bound on the crystal surface. We note that these comprise only 1.5% of the total particles that are embedded. We attribute this population to crystal fragmentation during solution-based synthesis and processing. The detailed properties of these particles are discussed later in the paper.
 | ||
| Fig. 3 Structural characterization of the composite. (a) TEM image of a CTAB–I sheet embedded with particles; inset shows the particles inside the sheet (scale bar 100 nm). (b) HAADF-STEM image of the particle-embedded CTAB–I sheet with the elemental mapping distribution of bromine, iodine (sheet), gold, and silver (embedded particles). (c) Histogram plot of the size distribution of particles that are embedded inside the sheet. (d) 3D AFM image of the CTAB–I sheet embedded with particles. (e) Thickness profile analysis of the sheet. (f) Optical reflectivity and transmissivity of CTAB–I sheets with particles. | ||
AFM (Atomic Force Microscopy) measurements were used to estimate sheet thickness and surface roughness. Fig. 3d shows the 3D image of the typical sheet embedded with particles, and Fig. 3e shows the height profile of the same. The calculated thickness from the topographical image is found to be 190 ± 7 nm. In addition, we find that the sheets exhibit an extremely smooth surface topography with an RMS roughness of 3.7 nm. We emphasize that this observed RMS roughness is significantly lower than the mean nanoparticle size of 15 nm. This is consistent with the absence of particles on the crystal surface and thus serve to confirm successful particle embedding. Furthermore, we are unable to observe large scale structural distortion caused by particle embedding. This observation further supports successful embedding of particles into the sheet structure and eliminates the possibility of the presence of a large unbound population of particles on the sheet surface.
3.4 Structure and morphology of bimetallic nanoparticles formed
To understand the mechanisms involved in the formation of this unique architecture and to prove that there is in situ embedding of nanoparticles, we further analyze the property changes of NPs during the embedding as a function of time. Fig. 4 shows the structural and optical characterization of cleaned NPs isolated from the reaction mixture after the first step (t = 30 min). We note that this is prior to sheet formation and only the bimetallic Au–Ag can be found at this stage. Fig. 4a shows the low-resolution TEM image of Au–Ag NPs at t = 30 min. We observed two distinct populations of particles in the particle size distribution histogram profile in the inset of Fig. 4a. The smaller ones (average size 37 nm) are core–shell spherical particles marked in yellow in Fig. 4b, and the other set is bigger (average size 58 nm) non-spherical composite Au–Ag. Fig. 4c shows the selected area electron diffraction (SAED) pattern of the particles, which agrees well with the patterns typically observed in the case of Au and Ag. Polycrystalline particles are seen to be present within the ensemble. Significant reflections corresponding to gold and silver have been marked. We also observe forbidden reflections at 0.36 nm that are typically seen in the case of twinned nanoparticles.47–49 These aspects are also seen in the high-resolution TEM (HRTEM) image in the inset of Fig. 4b. The spherical particles were core–shell structures with Au at the core and Ag as the shell, evident from the HAADF image and in the elemental mapping in Fig. 4d–f. In addition, the PXRD pattern of NPs isolated at t = 30 min matches the standard Ag pattern, as shown in Fig. 4g. Sheet formation is observed optically within 5 hour of the reduction in typical reactions. Subsequently, particle-embedded sheets may be isolated within 5 hours of the reduction. Particles in the reaction medium undergo a digestive ripening process before incorporation into sheets. In particular, we observe that the average size of the NPs decreases from 50 nm for the free NPs to 15 nm for the incorporated NPs. Digestive ripening of the particles is generally observed in the presence of thiolate ligands. We hypothesize that in our reaction this was driven by the properties of the reaction mixture, particularly its pH. To verify this hypothesis, we study the temporal behavior of NPs isolated at 30 minutes over time. We indeed find that these particles are stable and do not undergo ripening outside of the reaction medium.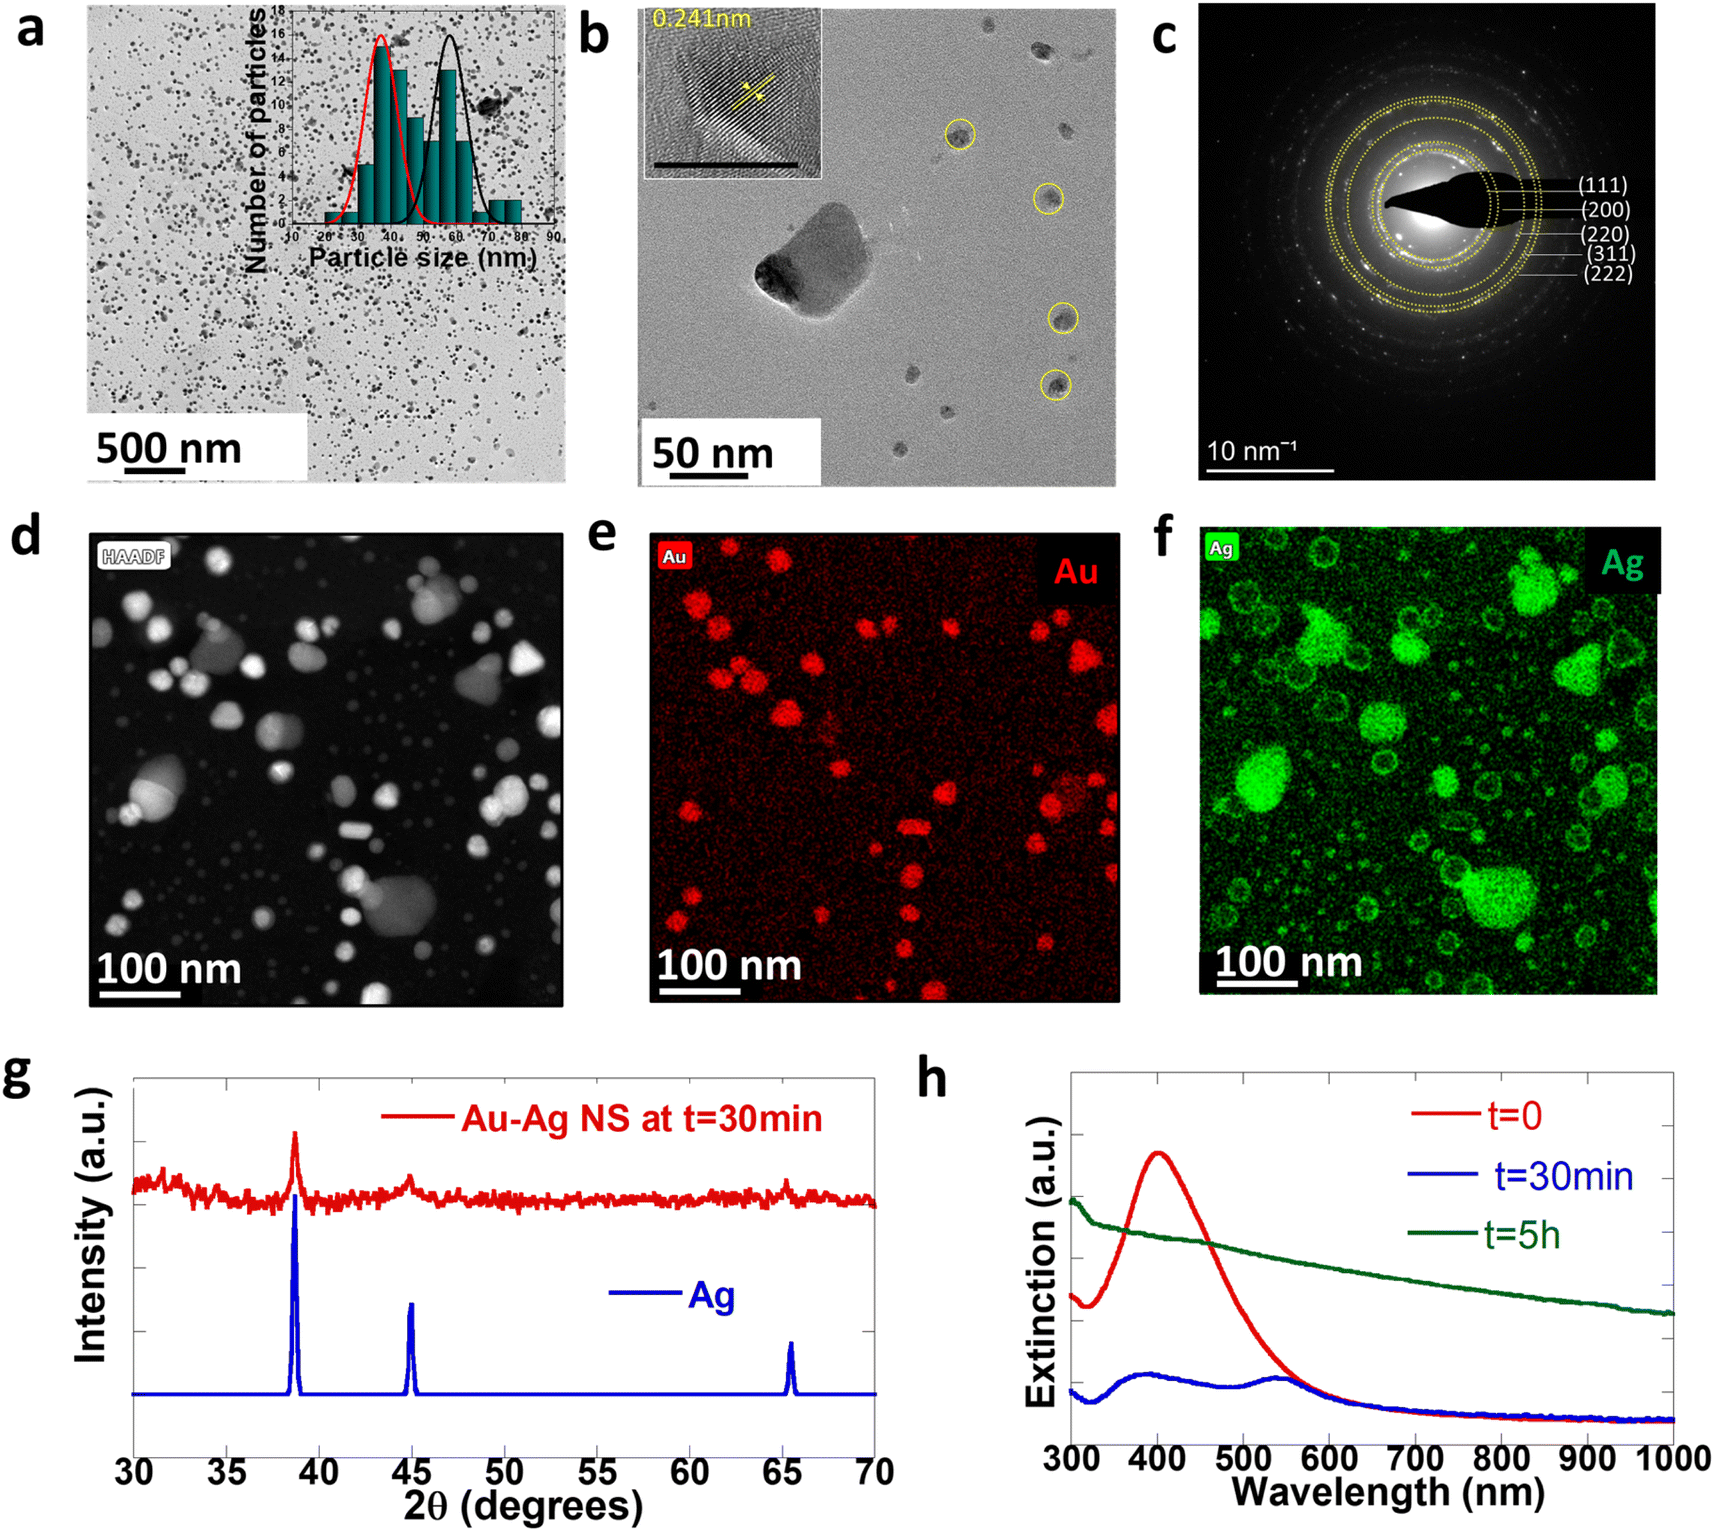 | ||
| Fig. 4 (a) Low-resolution TEM image of Au–Ag NPs isolated at t = 30 min and histogram profile of particle size distribution (inset). (b) TEM image of two different sizes of particles and HRTEM of a single particle with lattice spacing marked (inset). (c) SAED pattern of Au–Ag NPs. (d) HAADF of Au–Ag nanostructures. (e) and (f) Elemental mapping of Au and Ag, respectively. (g) Comparison of the PXRD pattern of Au–Ag NPs with that of standard Ag. (h) Extinction spectra of Au–Ag NPs at different intervals of time over the course of embedding into CTAB–I sheets. | ||
3.5 Optical properties of the NP embedded CTAB–I composite
Fig. 4h shows the evolution of extinction spectra of the sample at t = 0 (just after the reduction), t = 30 min, and t = 5 hours. The single LSPR at 430 nm further confirms the presence of Au–Ag at t = 0. The LSPR of Ag is red-shifted with respect to pure Ag SPR because of the bimetallic character of these particles.50 The optical spectra of the NPs at t = 30 min further corroborate the presence of Au–Ag core–shell structures. The broad extinction resonance of the NP-crystal composite is observed at t = 5 hours. Significantly, this is considerably broader than the resonance observed in the case of the initially formed NPs at t = 30 min. This is surprising given the size distribution narrowing process that the NPs undergo over the t = 5 hour period. Overall, this is consistent with the emergent optical properties of the NP-CTAB–I crystal composite system and is tentatively ascribed to strong inter-NP coupling that is realized. We further confirm the optical properties of the sheet-embedded particles by performing reflectivity measurements on an integrating sphere. Fig. 3f shows the reflectivity spectra of the sample. As evident, the sample presents a broad reflectivity profile that spans the entire visible spectrum. As noted earlier, our systems have a large packing density of ∼553 NPs per μm2; this leads to a correspondingly small interparticle separation of 43 ± 26 nm. This regime is particularly relevant for allowing the realization of enhanced plasmon–plasmon coupling.51,52 Thus, our experimental results are consistent with reflectivity from a composite dielectric-coupled plasmonic system.534. Conclusion
This work realizes the in situ embedding of small plasmonic Au–Ag NPs into a novel cetrimonium crystal polymorph, thereby extending the utility of these reagents further. This work thus extends the utility of CTAB based polymorphs directly in synthesis and not as a surfactant. XRD studies revealed the formation of a new emergent crystal CTAB–I. Molecular interactions responsible for the formation of this polymorph are studied using solid state NMR methods. We find significantly reduced alkyl chain mobility in CTAB–I systems compared to CTAB. We study the dynamical properties of CTAB–KI dispersions from which this polymorph was isolated. Based on our observations we designed a synthetic protocol to enable in situ embedding of binary metallic NPs into the CTAB–I crystals. We were able to attain a high packing density of 533 particles per μm2 area of embedded NPs in a CTAB–I sheet. This enables the realization of a NP-crystal composite with resonance scanning from 300–600 nm. This work provides a new design strategy for combining hard (metal NPs) and soft (organic) materials.Conflicts of interest
There are no conflicts of interest to declare.Acknowledgements
AP acknowledges the DST SERB IRHPA [IPA/2020/000033] and Indian Institute of Science [IISc-IOE Program] for the support. IY and SKJ acknowledge the Institute NMR facility, IISc Bangalore and the Startup Fund by IISc [IISc-IOE Program]. NV acknowledges MNCF-CeNSE, IISc for SEM and TEM facilities. NV thanks DST for INSPIRE fellowship.References
- A. Thomas, F. Goettmann and M. Antonietti, Chem. Mater., 2008, 20, 738–755 CrossRef CAS.
- J. P. Gong, Science, 2014, 344(6180), 161–162 CrossRef CAS PubMed.
- J. P. F. Lagerwall and G. Scalia, Curr. Appl. Phys., 2012, 12, 1387–1412 CrossRef.
- M. G. Mohammed, R. Kramer, M. G. Mohammed and R. Kramer, Adv. Mater., 2017, 29, 1604965 CrossRef PubMed.
- S. Bauer, Nat. Mater., 2013, 12(10), 871–872 CrossRef CAS PubMed.
- X. Peng, J. Wickham and A. P. Alivisatos, J. Am. Chem. Soc., 1998, 120, 5343–5344 CrossRef CAS.
- C. B. Murray, S. Sun, W. Gaschler, H. Doyle, T. A. Betley and C. R. Kagan, IBM J. Res. Dev., 2001, 45, 47–56 CAS.
- C. Burda, X. Chen, R. Narayanan and M. A. El-Sayed, Chem. Rev., 2005, 105, 1025–1102 CrossRef CAS PubMed.
- S. J. Oldenburg, R. D. Averitt, S. L. Westcott and N. J. Halas, Chem. Phys. Lett., 1998, 288, 243–247 CrossRef CAS.
- L. Li, A. Pandey, D. J. Werder, B. P. Khanal, J. M. Pietryga and V. I. Klimov, J. Am. Chem. Soc., 2011, 133, 1176–1179 CrossRef CAS PubMed.
- B. Bhattacharyya and A. Pandey, J. Am. Chem. Soc., 2016, 138, 10207–10213 CrossRef CAS PubMed.
- B. P. Khanal, A. Pandey, L. Li, Q. Lin, W. K. Bae, H. Luo, V. I. Klimov and J. M. Pietryga, ACS Nano, 2012, 6, 3832–3840 CrossRef CAS PubMed.
- F. S. Hickernell, IEEE Trans. Ultrason. Ferroelectr. Freq. Control, 2005, 52, 737–745 Search PubMed.
- Y. Liu, W. Yuan, Y. Shi, X. Chen, Y. Wang, H. Chen and H. Li, Angew. Chem., Int. Ed., 2014, 53, 4127–4131 CrossRef CAS PubMed.
- H. Liu, F. Wang, Y. Wang, J. Mei and D. Zhao, ACS Appl. Mater. Interfaces, 2017, 9, 18248–18253 CrossRef CAS PubMed.
- A. Heilmann, J. Werner, O. Stenzel and F. Homilius, Thin Solid Films, 1994, 246, 77–85 CrossRef CAS.
- J. S. Pendery, O. Merchiers, D. Coursault, J. Grand, H. Ayeb, R. Greget, B. Donnio, J. L. Gallani, C. Rosenblatt, N. Félidj, Y. Borensztein and E. Lacaze, Soft Matter, 2013, 9, 9366–9375 RSC.
- W. Cheng, S. Dong and E. Wang, Langmuir, 2003, 19, 9434–9439 CrossRef CAS.
- R. Li, Z. Wang, X. Gu, C. Chen, Y. Zhang and D. Hu, ACS Omega, 2020, 5, 4943–4952 CrossRef CAS PubMed.
- C. M. Aguirre, T. R. Kaspar, C. Radloff and N. J. Halas, Nano Lett., 2003, 3(12), 1707–1711 CrossRef CAS.
- L. Peng, Y. Wang, Q. Dong, Z. Wang and P. Znse, Nano-Micro Lett., 2010, 2(3), 190–196 CrossRef CAS.
- R. K. Upadhyay, N. Soin, S. Saha, A. Barman and S. S. Roy, Mater. Chem. Phys., 2015, 156, 105–112 CrossRef CAS.
- W. Abidi, B. Pansu, R. Krishnaswamy, P. Beaunier, H. Remita and M. Impéror-Clerc, RSC Adv., 2011, 1, 434–439 RSC.
- B. Nikoobakht and M. A. El-Sayed, Chem. Mater., 2003, 15, 1957–1962 CrossRef CAS.
- N. R. Jana, L. Gearheart and C. J. Murphy, Adv. Mater., 2001, 13, 1389–1393 CrossRef CAS.
- N. D. Burrows, W. Lin, J. G. Hinman, J. M. Dennison, A. M. Vartanian, N. S. Abadeer, E. M. Grzincic, L. M. Jacob, J. Li and C. J. Murphy, Langmuir, 2016, 32, 9905–9921 CrossRef CAS PubMed.
- L. Coppola, R. Gianferri, I. Nicotera, C. Oliviero and G. A. Ranieri, Phys. Chem. Chem. Phys., 2004, 6, 2364–2372 RSC.
- S. R. Choudhury, R. Yadav, A. N. Maitra and P. C. Jain, Colloids Surf., A, 1994, 82, 49–58 CrossRef.
- V. Luzzati, A. Tardieu, T. Gulik-Krzywicki, E. Rivas and F. Reiss-Husson, Nature, 1968, 220, 485–488 CrossRef CAS PubMed.
- P. Ekwall, Adv. Liq. Cryst., 1975, 1, 1–142 CAS.
- M.-Z. Wei, T.-S. Deng, Q. Zhang, Z. Cheng and S. Li, ACS Omega, 2021, 6, 9188–9195 CrossRef CAS PubMed.
- W. Zhang, G. Li, J. Mu, Q. Shen, L. Zheng, H. Liang and C. Wu, Chin. Sci. Bull., 2000, 45, 1854–1857 CrossRef CAS.
- G. A. Cookey and C. C. Obunwo, IOSR J. Appl. Chem., 2014, 7, 34–38 CrossRef.
- T. G. Movchan, I. V Soboleva, E. V Plotnikova, A. K. Shchekin and A. I. Rusanov, Colloid J., 2012, 74, 239–247 CrossRef CAS.
- Z. Wei, X. Wei, X. Wang, Z. Wang and J. Liu, J. Mater. Chem., 2011, 21, 6875–6882 RSC.
- P. H. Svensson, M. Gorlov and L. Kloo, Inorg. Chem., 2008, 47, 11464–11466 CrossRef CAS PubMed.
- A. R. Campanelli and L. Scaramuzza, Acta Crystallogr., Sect. C: Cryst. Struct. Commun., 1986, 42, 1380–1383 CrossRef.
- G. C. Das, B. Das, N. S. Sarma and O. K. Medhi, Polyhedron, 2012, 37, 14–20 CrossRef CAS.
- J. K. Cockcroft, A. Shamsabadi, H. Wu and A. R. Rennie, Phys. Chem. Chem. Phys., 2019, 21, 25945–25951 RSC.
- X.-H. Liu, X.-H. Luo, S.-X. Lu, J.-C. Zhang and W.-L. Cao, J. Colloid Interface Sci., 2007, 307, 94–100 CrossRef CAS PubMed.
- S. Shelton, US Pat., 2295504A, 1942 Search PubMed.
- Y. Shen, Y. Zhang, D. Kuehner, G. Yang, F. Yuan and L. Niu, ChemPhysChem, 2008, 9, 2198–2202 CrossRef CAS PubMed.
- K. Sato, K. Hosokawa and M. Maeda, J. Am. Chem. Soc., 2003, 125, 8102–8103 CrossRef CAS PubMed.
- B. Rodríguez-González, A. Burrows, M. Watanabe, C. J. Kiely and L. M. L. Marzán, J. Mater. Chem., 2005, 15, 1755–1759 RSC.
- J. S. Sekhon and S. S. Verma, Plasmonics, 2011, 6, 311–317 CrossRef CAS.
- S. Link, Z. L. Wang and M. A. El-Sayed, J. Phys. Chem. B, 1999, 103, 3529–3533 CrossRef CAS.
- M. B. Gawande, A. Goswami, F. X. Felpin, T. Asefa, X. Huang, R. Silva, X. Zou, R. Zboril and R. S. Varma, Chem. Rev., 2016, 116, 3722–3811 CrossRef CAS PubMed.
- M. Liu and P. Guyot-Sionnest, J. Phys. Chem. B, 2005, 109, 22192–22200 CrossRef CAS PubMed.
- I. Lisiecki, J. Phys. Chem. B, 2005, 109, 12231–12244 CrossRef CAS PubMed.
- S. Link, Z. L. Wang and M. A. El-Sayed, J. Phys. Chem. B, 1999, 103, 3529–3533 CrossRef CAS.
- S. K. Ghosh and T. Pal, Chem. Rev., 2007, 107, 4797–4862 CrossRef CAS PubMed.
- N. J. Halas, S. Lal, W. S. Chang, S. Link and P. Nordlander, Chem. Rev., 2011, 111, 3913–3961 CrossRef CAS PubMed.
- E. Prodan, C. Radloff, N. J. Halas and P. Nordlander, Science, 2003, 302(5644), 419–422 CrossRef CAS PubMed.
Footnote |
| † Electronic supplementary information (ESI) available. See DOI: https://doi.org/10.1039/d4na00008k |
| This journal is © The Royal Society of Chemistry 2024 |