Hyperfine structure measurements for neutral and singly ionized terbium by Fourier-transform spectroscopy
Received
18th May 2023
, Accepted 20th November 2023
First published on 21st November 2023
Abstract
The archival data recorded by the Fourier transform spectrometer at the USA National Solar Observatory (NSO) were used to investigate the hyperfine structure (HFS) for Tb I and Tb II levels. The magnetic dipole HFS constant A values for 45 levels of Tb I ranging from 285.5 to 34![[thin space (1/6-em)]](https://www.rsc.org/images/entities/char_2009.gif) 223.95 cm−1 and for seven levels of Tb II below 36602 cm−1 were determined. To our best knowledge, the HFS constants for 34 out of 45 levels in Tb I and for two out of seven levels in Tb II are reported for the first time. This study extended the total number of experimentally measured magnetic dipole HFS constants A to 415 for Tb I and 92 for Tb II.
223.95 cm−1 and for seven levels of Tb II below 36602 cm−1 were determined. To our best knowledge, the HFS constants for 34 out of 45 levels in Tb I and for two out of seven levels in Tb II are reported for the first time. This study extended the total number of experimentally measured magnetic dipole HFS constants A to 415 for Tb I and 92 for Tb II.
1. Introduction
The study of atomic hyperfine structure (HFS) has great importance in the fields of astrophysics, atomic and nuclear physics. In high resolution astronomical spectroscopy, not considering HFS of spectral lines may introduce significant deviation to astrophysical results.1 Terbium (Tb) abundance plays an essential role in the nucleosynthesis investigation of heavy elements and many studies have been done to determine the stellar Tb abundance. For instance, Cowan et al.2 used Tb HFS data for the abundance analysis of the metal-poor halo star BD + 17°3248. Nowadays, the resolution of celestial spectra has been dramatically improved due to advances in astronomical observation technology, making the consideration of HFS more necessary. In addition, precise HFS constants can also help to test the accuracy of wave functions in atomic calculations3,4 and to extract information on nuclear structure such as nuclear g factor, nuclear magnetic dipole and electric quadrupole moments.5
Tb is one of the rare-earth elements with the atomic number 65. Tb has only one stable isotope in nature, 159Tb, with a nuclear spin quantum number I = 3/2. Its nuclear magnetic dipole moment is μI = 4.2754μN (ref. 6) and nuclear electric quadrupole moment is Q = 1.432 b.7
Magnetic dipole and electric quadrupole hyperfine interaction constants, A and B respectively, of Tb I and Tb II energy levels had been measured previously by many different experiments. Childs8–11 used the atomic beam magnetic resonance technique, laser induced fluorescence (LIF) spectroscopy and high-precision laser-radiofrequency double-resonance measurement to obtain the HFS constants for 27 levels of Tb I. By a Fabry-Perot spectrometer, Arnoult et al.12 and Dekker et al.13 measured the HFS constants for three levels of Tb I and five levels of Tb II, respectively. Kumar et al.14 measured the HFS constants A and B for six levels of Tb I by analyzing Doppler-limited high-resolution laser optogalvanic spectra. LIF spectroscopy in hollow cathode discharge (HCD) lamps was used by Furmann et al.,15–17 Stefanska et al.18,19 and Suski et al.20 to measure the HFS constants of 63 Tb I levels of even parity and 290 Tb I levels of odd parity. Fourier transform spectroscopy (FTS) method was used by Lawler et al.21 to determine the HFS constants A of 83 levels and the constants B of 42 levels for Tb II, nine of which were previously unknown. Stefanska et al.22 reported the constants for 12 levels of Tb II using LIF spectroscopy in HCD lamps. Besides experimental investigations, Stefanska et al.19,22 and Furmann et al.17 performed HFS analysis of some levels in the configuration systems 4f85d6s2 + 4f85d26s + 4f96s6p of Tb I and 4f95d of Tb II by semi-empirical calculations.
There are 598 known Tb I and 153 known Tb II levels compiled by the National Institute of Standards and Technology (NIST), USA.23 The HFS constants for 381 levels of Tb I and 90 levels of Tb II have been experimentally determined to date. The HFS constants of many energy levels of Tb I and Tb II are still unknown. In the present work, we measured previously unknown HFS constants for some Tb I and Tb II levels using FTS spectra.
2. FTS spectral data
The FTS spectra of Tb HCD lamps used in this paper came from the digital library of the NSO at Kitt Peak, USA (https://nso.edu/data/historical-archive/). To determine the HFS constants of the Tb I and Tb II levels, we used 13 spectra with different wavenumber ranges and discharge currents, each with a resolution of 0.053 cm−1 and Super blue Si as the detector. Their characteristic parameters are listed in Table 1. According to the spectrum header files, these spectra were measured by J. E. Lawler and M. E. Wickliffe (spectra 12 and 13 by J. E. Lawler) at Kitt Peak with the help of D. Branston and M. Dulick of NSO and G. Nave of NIST in 1997 to 1999 supported by the NSF (USA).21,24 The most used spectra in this work were those with index numbers 5, 11 and 13.
Table 1 Parameters of the archive FTS spectra used in this work. All spectra are publicly available from the digital library of the NSO on Kitt Peak, USA (https://nso.edu/data/historical-archive/)
| Index |
Archive folder and filename |
Buffer gas |
Current (mA) |
Wavenumber range (cm−1) |
Coadds |
| 1 |
FTS49/991130R0.003 |
Ar |
17 |
7929–34998 |
9 |
| 2 |
FTS49/991130R0.004 |
Ar |
22 |
7929–34998 |
9 |
| 3 |
FTS49/991130R0.005 |
Ar |
28 |
0–34998 |
10 |
| 4 |
FTS49/991130R0.006 |
Ar |
28 |
0–34998 |
10 |
| 5 |
FTS49/991130R0.007 |
Ar |
28 |
0–34998 |
50 |
| 6 |
FTS49/991130R0.008 |
Ar |
28 |
0–34998 |
20 |
| 7 |
FTS49/991130R0.009 |
Ar |
28 |
0–34998 |
10 |
| 8 |
FTS49/991201R0.010 |
Ar |
28 |
0–34998 |
50 |
| 9 |
FTS49/991201R0.011 |
Ne |
24 |
0–34998 |
9 |
| 10 |
FTS47/980701R0.008 |
Ne |
25 |
7929–34998 |
8 |
| 11 |
FTS47/980702R0.010 |
Ar |
30 |
7929–34998 |
38 |
| 12 |
FTS44/971220R0.004 |
Ar |
24 |
7929–34998 |
4 |
| 13 |
FTS44/971220R0.007 |
Ar |
30 |
7929–34998 |
16 |
3. HFS analysis
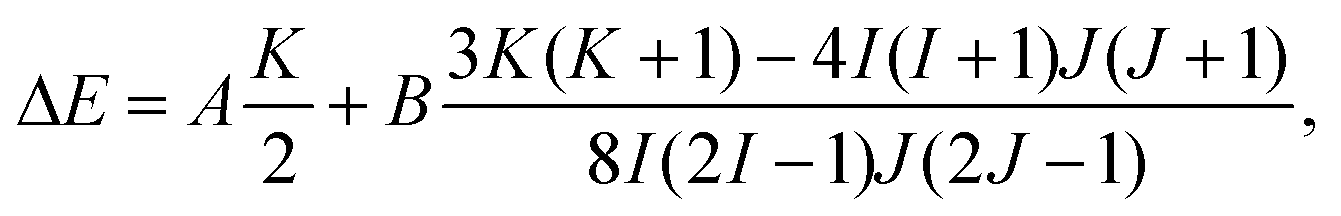
Due to the hyperfine interaction, which is a kind of interaction of atomic electrons with the electromagnetic multipole moments of the nucleus, the energy levels of the fine structure will split. The total energy shift ΔE of an HFS sublevel relative to a fine structure level can be expressed as25| |  | (1) |
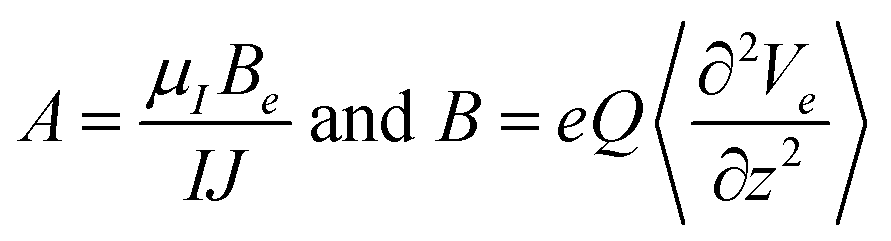
where K = F(F + 1) − J(J + 1) − I(I + 1), I is the nuclear spin, J is the total electronic angular momentum, and F is the quantum number of total angular momentum of the atom with the values from |J – I| to |J + I|. A and B are the magnetic dipole and electric quadrupole HFS constants, and related to the nuclear moments via| | 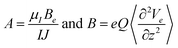 | (2) |
where Be and ∂2Ve/∂2z2 are the magnetic field and the electric field gradient produced by electrons at the nucleus.26
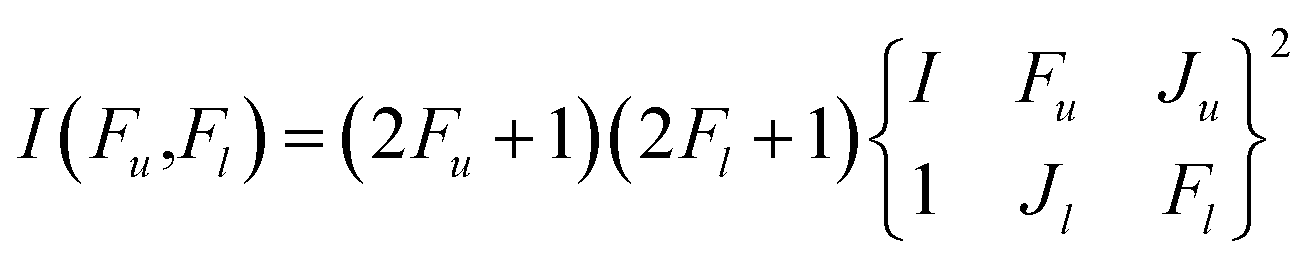
Relative intensities of hyperfine transitions are as follows
| | 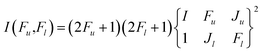 | (3) |
where the indices
u and
l indicate the upper and lower levels, respectively, and the squared factor is a Wigner 6
j symbol.
27 The transition selection rule between HFS levels is
| | | ΔF = 0, ±1 (F = 0↔0 unallowed). | (4) |
We performed fitting analysis of the HFS of Tb I and Tb II spectra using our fitting program that can determine HFS constants based on the theory above-mentioned and the Levenberg–Marquardt (LM) fit method.28 The LM fit method has some advantages over some conventional methods such as the Gauss–Newton and the steepest descent methods, etc. in terms of efficiency, convergence, broad applicability and uncertainty estimation, which are necessary for fitting HFS spectral lines with complex structures of hyperfine transition. The following parameters can be fitted by this program: the A and B values of investigated level, the Doppler linewidth, the center of gravity of the spectral line related to the investigated level, and the natural linewidth of a hyperfine transition. In the fitting process, we fixed the HFS A and B constants of the combining levels and allowed those of the investigated level to vary. The Voigt profile was used to fit the hyperfine components. There is obvious instrumental ringing around many of the observed spectral lines we used, due to insufficient resolving power used in the acquisition of these spectra. A more accurate line profile for these FTS spectral lines is a convolution between the Voigt function and a sinc function.29,30 Therefore, our HFS analysis program uses this type of convolution to fit each hyperfine component.
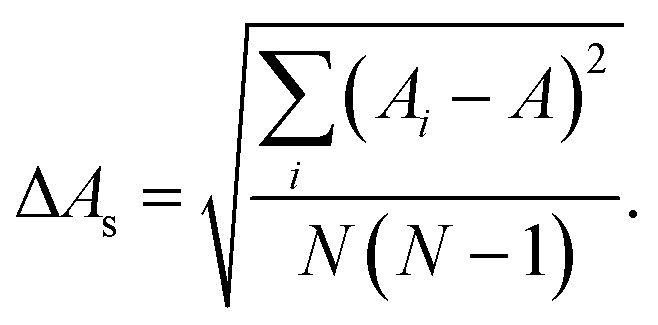
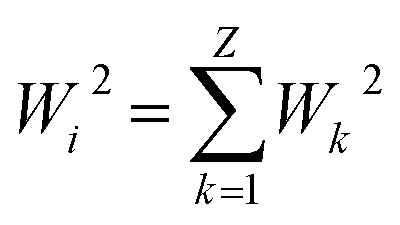
If there are multiple spectral lines with good signal-to-noise ratios for one transition connecting an investigated level, we used all these lines for HFS analyses. The A value from each transition can be determined by
| | 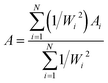 | (5) |
where
N is the number of the spectra used for a transition,
Ai is the
A value from a line.

, where
Z is the number of data points in a fitted line and
Wk2 is the square of the difference between the experimental and the fitting points in the spectral line. The standard uncertainty of the
A value determined from a transition was estimated by
| |  | (6) |
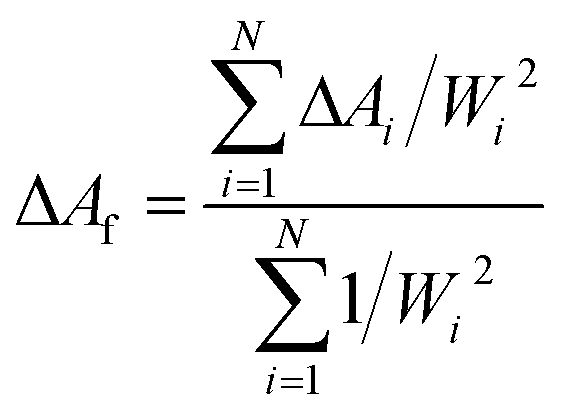
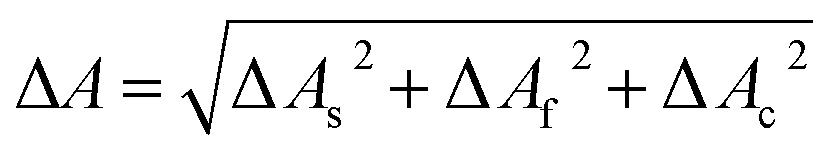
The fitting uncertainty of parameter ΔAf can be determined by
| |  | (7) |
where Δ
Ai is the fitting uncertainty of a spectral line from the LM fit method. The uncertainty Δ
A of the
A value was determined by
| |  | (8) |
where Δ
Ac is the uncertainty of the
A value of the combining level.
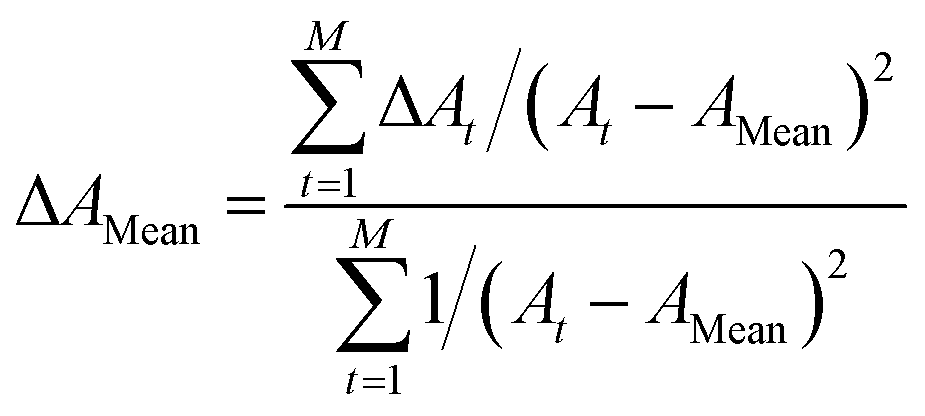
When a measured level has multiple transitions, the final HFS constant AMean of this level is a weighted average of the A values from all transitions, and the weight factor is the inverse of the squares of the uncertainty ΔA. Its uncertainty was evaluated by
| |  | (9) |
where
M is the number of transitions of an investigated level,
At is the
A value from one transition and Δ
At is its uncertainty determined by
eqn (8).
4. Results and discussion
For most of the levels investigated in this work, different FTS spectra were used. Based on the known data of the energy levels of Tb I, Tb II and Tb III as well as those of the buffer gas atom and ions, the line blending among possible transitions in these particles can be preliminarily determined. Of course, there is also the possibility of blending caused by transitions associated with unknown levels, so we used multiple transitions and multiple spectra with different buffer gases where possible to achieve the corroboration between results. In the case of a single transition, although we cannot fully guarantee the accuracy of the results, the agreement between the observed line and the fitted curve is, in general, not good when blending is present, so a reasonable fit of an HFS line pattern is usually a sign that blending may not be an issue. In general, it is difficult to determine HFS constants of both upper and lower levels at the same time. Therefore, we fixed the HFS constants of combining levels to the values measured in literature and optimized the constants of investigated levels in the fits.
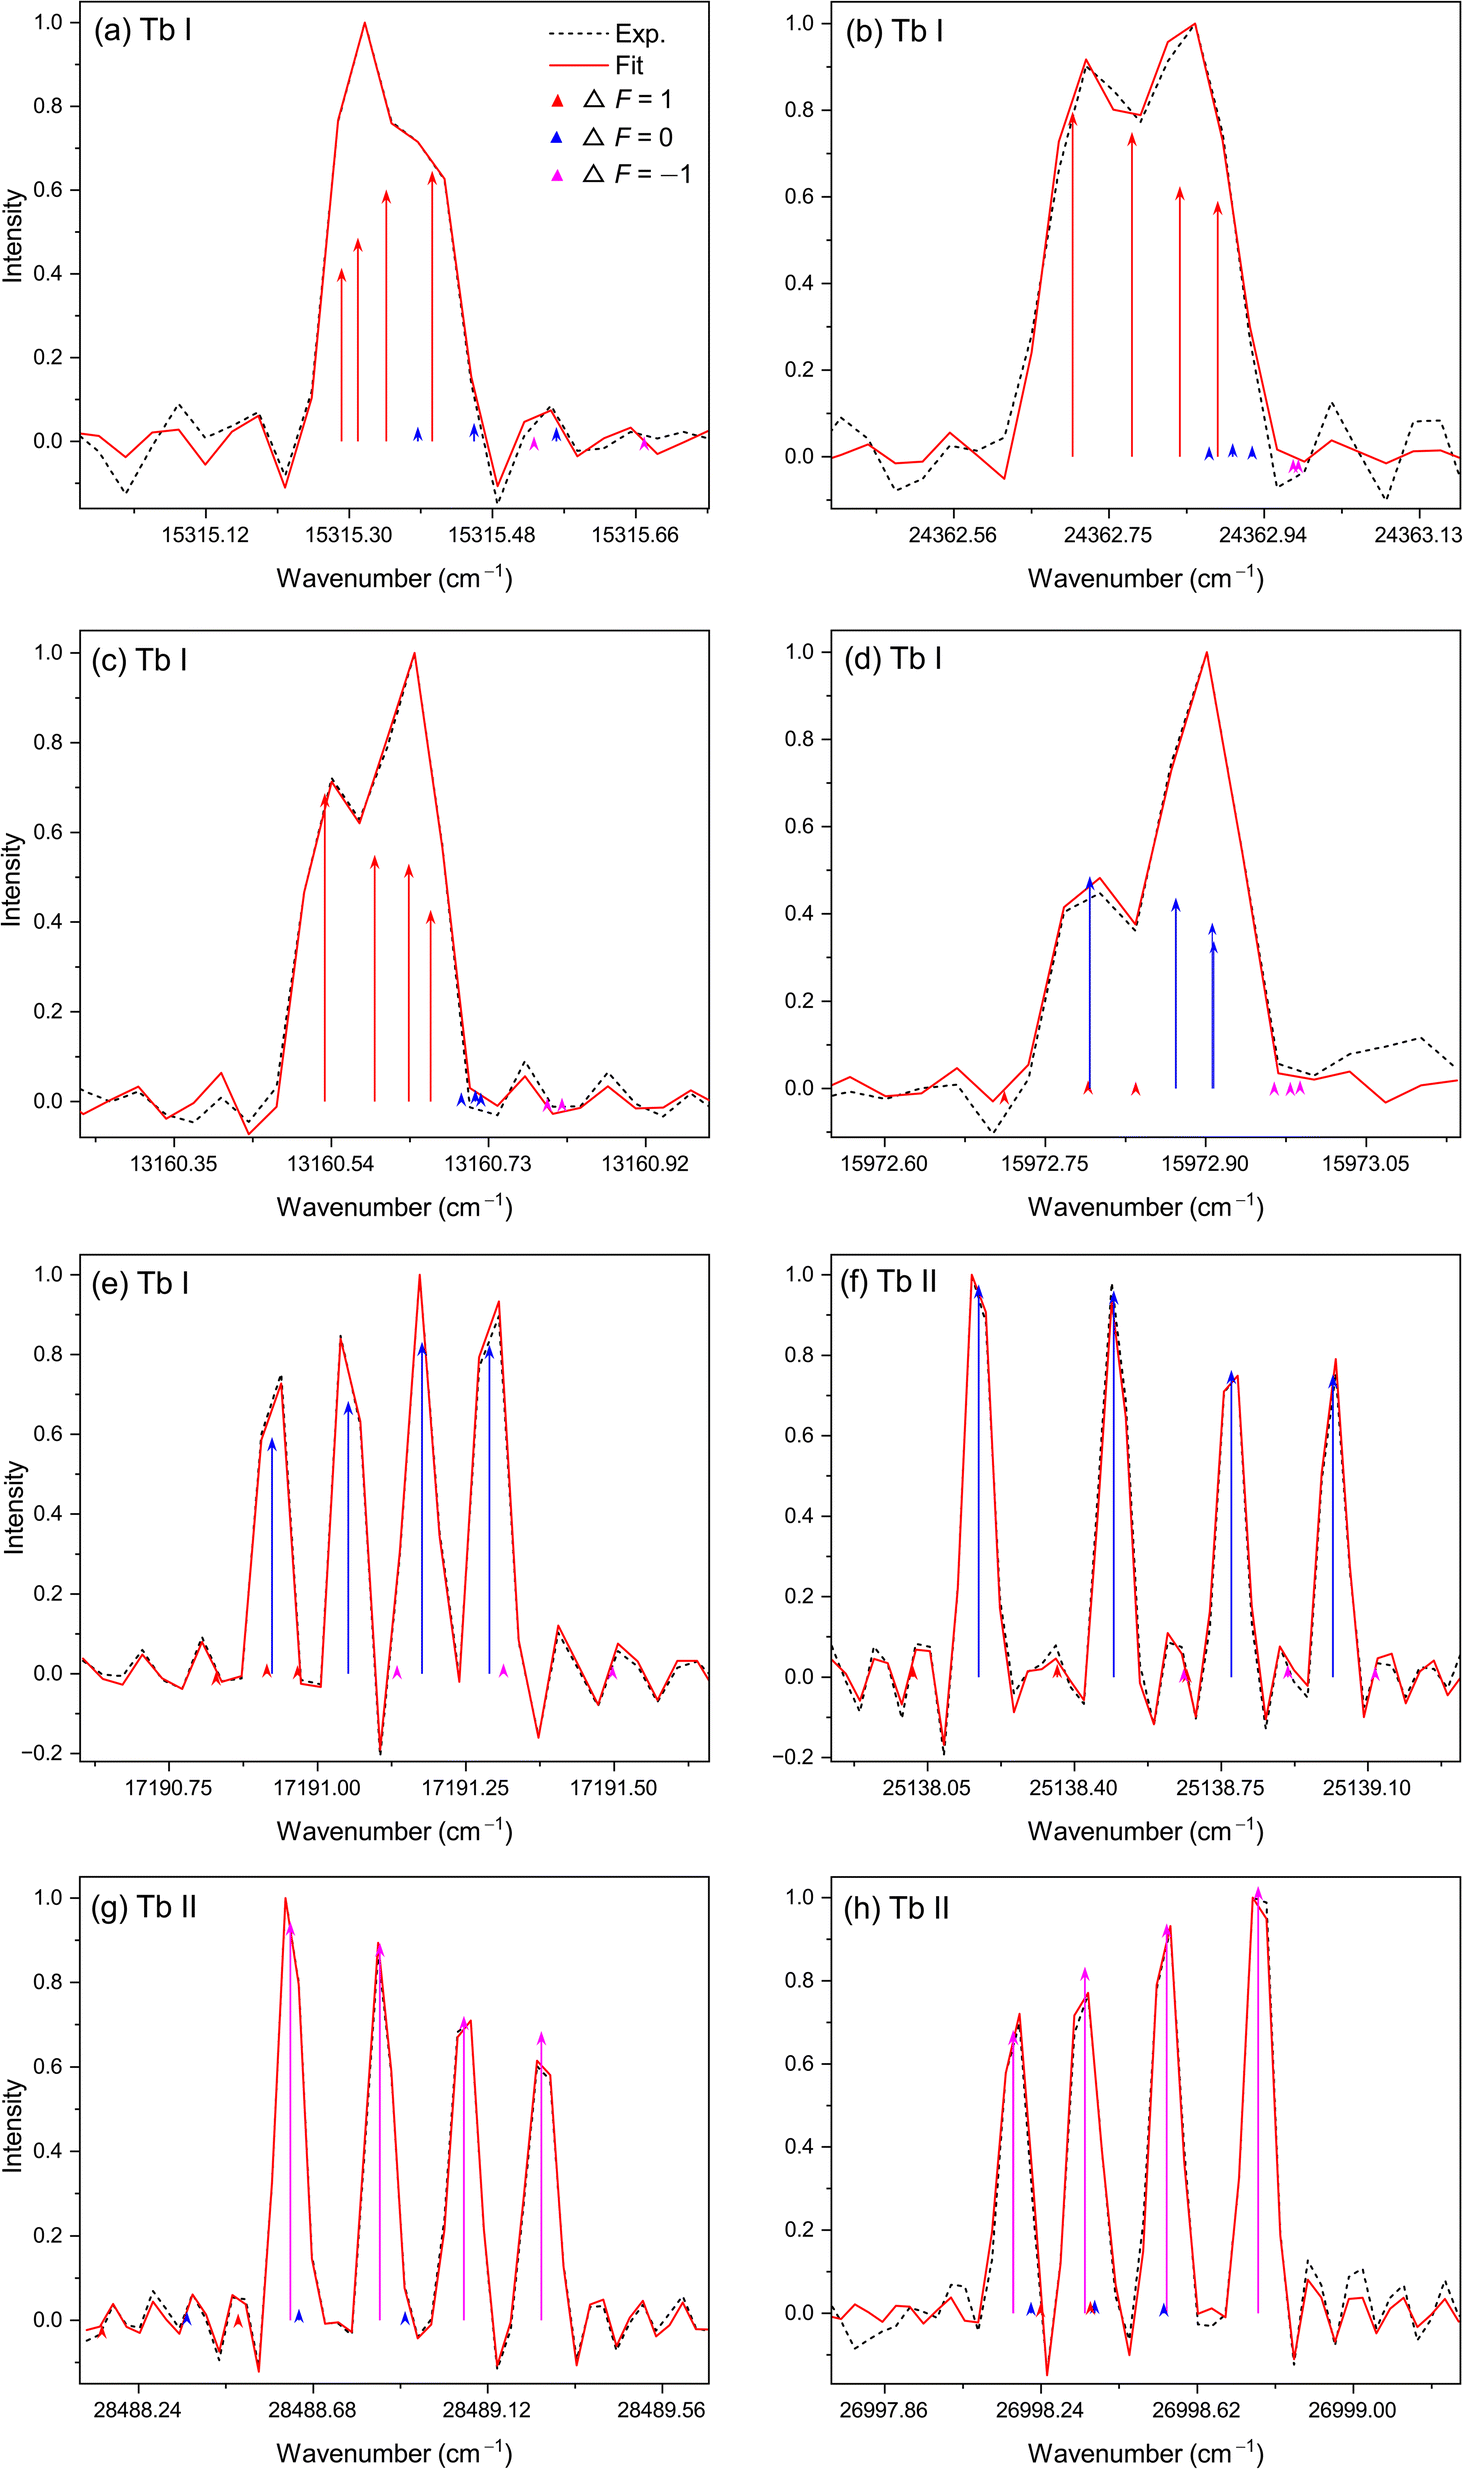
The resulting HFS constants of 45 Tb I levels are listed in Table 2 and those of seven Tb II levels are listed in Table 3 where the columns five to seven give the combining levels and their published experimental HFS constant values. The level information in the first three and fifth columns of Tables 2 and 3 was taken from the NIST database,23 where further original references by Martin et al.31 and Sansonetti et al.32 are cited. Columns four and eight show the number of transitions used for a studied level and the number of lines used for a transition, respectively. For the investigated levels with multiple transitions, the A and B values determined from each transition and their weighted mean AMean and BMean are all listed. The uncertainty estimates of most of the A and B constants are less than 3% and 7%, respectively. Altogether, 73 transitions were investigated which were specially selected with the aims to connect the combining levels whose HFS constants are known. They involve 182 spectral lines from different spectra and these lines have signal-to-noise ratios (SNRs) of above 20, 20–10 and 10–5 with the proportion of 41%, 35% and 24%, respectively. Some examples of typical experimental profiles together with the best fitted line profiles are shown in Fig. 1.
Table 2 HFS constants for Tb I levels measured in this work and comparison with previous experimental results
| Investigated level |
No. of transitions |
Combining level |
No. of lines |
A constant (MHz) |
B constant (MHz) |
| Energy (cm−1) |
Parity |
J
|
Energy (cm−1) |
A (MHz) |
B (MHz) |
This work |
Previous |
This work |
Previous |
|
A
|
A
Mean
|
B
|
B
Mean
|
|
Stefanska et al.18
Childs et al.9
Furmann et al.17
Arnoult et al.12
Childs et al.10
Furmann et al.16
Kumar et al.14
Furmann et al.15
Stefanska et al.19
Suski et al.20
|
| 285.500 |
e |
13/2 |
2 |
21083.72 |
1091(2)a |
457(11)a |
3 |
532(4) |
531(3) |
532.204(2)b |
862(87) |
879(48) |
928.861(30)b |
|
|
|
|
|
24392.79 |
338.8(4)c |
660(6)c |
3 |
530(3) |
|
531(6)d |
886(57) |
|
989(60)d |
| 462.080 |
e |
15/2 |
2 |
21812.08 |
688(3)c |
722(10)c |
3 |
473(4) |
473(1) |
472.643(2)b |
1207(79) |
1148(38) |
1154.239(17)b |
|
|
|
|
|
21837.92 |
885.7(4)e |
1300(5)e |
3 |
473(1) |
|
472.6 (4)e |
1130(44) |
|
1157(5)e |
|
|
|
|
|
|
|
|
|
|
|
471(6)d |
|
|
1169(60)d |
| 509.845 |
e |
11/2 |
2 |
18607.24 |
843.9(8)f |
863(4)f |
3 |
578(3) |
580(2) |
577.465(2)b |
941(68) |
1003(64) |
989.917(30)b |
|
|
|
|
|
19606.52 |
1017.4(2)a |
618(3)a |
3 |
582(2) |
|
571(10)g |
1053(61) |
|
962(20)g |
|
|
|
|
|
|
|
|
|
|
|
573(6)d |
|
|
1049(60)d |
|
|
|
|
|
|
|
|
|
|
|
577.4(4)e |
|
|
995(5)e |
| 2310.090 |
e |
11/2 |
2 |
25724.41 |
552(2)a |
814(37)a |
3 |
400(4) |
403(4) |
405.106(3)b |
|
|
−92.638(50)b |
|
|
|
|
|
26787.51 |
949(3)f |
803(36)f |
3 |
408(5) |
|
405.1(4)e |
|
|
−90(5)e |
| 4646.830 |
e |
17/2 |
3 |
19131.45 |
906(2)f |
1412 (25)f |
2 |
481(5) |
483(3) |
481.738(2)b |
2347(168) |
2299(148) |
2245.914(50)b |
|
|
|
|
|
20534.69 |
926.0(1)a |
1392(2)a |
3 |
482(4) |
|
485(10)g |
2220(149) |
|
2232(20)g |
|
|
|
|
|
21837.92 |
885.7(4)e |
1300(5)e |
3 |
483(2) |
|
481.8(4)e |
2334(137) |
|
2250(5)e |
| 8506.710 |
e |
17/2 |
3 |
28193.17 |
486(2)a |
1142(36)a |
3 |
906(5) |
909(5) |
915(5)h |
|
|
500(30)h |
|
|
|
|
|
30068.35 |
462.0(7)i |
1041(20)i |
2 |
908(4) |
|
915.3(5)i |
|
|
464(37)i |
|
|
|
|
|
30666.00 |
222(3)i |
389(24)i |
3 |
916(7) |
|
|
|
|
|
| 13622.69 |
o |
13/2 |
1 |
462.080 |
472.643(2)b |
1154.239(17)b |
3 |
355(4) |
|
|
510(92) |
|
|
| 14888.11 |
e |
15/2 |
2 |
0.000 |
673.753(2)b |
1449.330(40)b |
1 |
510(16) |
534(17) |
|
|
|
|
|
|
|
|
|
28890.24 |
540.8(7)i |
638(14)i |
1 |
568(19) |
|
|
|
|
|
| 14998.90 |
o |
13/2 |
1 |
509.845 |
577.465(2)b |
989.917(30)b |
3 |
1061(7) |
|
|
413(119) |
|
|
| 15189.23 |
o |
11/2 |
2 |
285.500 |
532.204(2)b |
928.861(30)b |
2 |
1028(12) |
1040(12) |
|
|
|
|
|
|
|
|
|
1371.045 |
602.3(5)e |
1271(5)e |
1 |
1054(13) |
|
|
|
|
|
| 15825.17 |
o |
9/2 |
1 |
509.845 |
577.465(2)b |
989.917(30)b |
3 |
930(11) |
|
|
1271(202) |
|
|
| 16051.64 |
o |
15/2 |
1 |
4646.830 |
481.738(2)b |
2245.914(50)b |
3 |
352(4) |
|
|
1729(100) |
|
|
| 17441.07 |
o |
13/2 |
1 |
2310.090 |
405.106(3)b |
−92.638(50)b |
3 |
874(7) |
|
|
|
|
|
| 17740.60 |
o |
11/2 |
2 |
1371.045 |
602.3(5)e |
1271(5)e |
2 |
1106(26) |
1094(28) |
|
|
|
|
|
|
|
|
|
8277.040 |
981(3)i |
820(24)i |
1 |
1137(62) |
|
|
|
|
|
| 17932.42 |
o |
17/2 |
1 |
8506.710 |
915(5)h |
500(30)h |
3 |
791(6) |
|
|
1008(83) |
|
|
| 19080.13 |
o |
15/2 |
1 |
285.500 |
532.204(2)b |
928.861(30)b |
3 |
1086.4(7) |
|
1087.0(3)j |
1616(22) |
|
1595(5)j |
| 19162.31 |
o |
17/2 |
1 |
462.080 |
472.643(2)b |
1154.239(17)b |
3 |
736(9) |
|
|
|
|
|
| 20928.12 |
o |
13/2 |
2 |
509.845 |
577.465(2)b |
989.917(30)b |
2 |
853(4) |
893(5) |
|
|
|
|
|
|
|
|
|
3719.705 |
354.454(3)b |
72.183(30)b |
1 |
1014(8) |
|
|
|
|
|
| 21397.91 |
o |
15/2 |
3 |
285.500 |
532.204(2)b |
928.861(30)b |
2 |
309(7) |
313(12) |
|
|
|
|
|
|
|
|
|
462.080 |
472.643(2)b |
1154.239(17)b |
1 |
324(13) |
|
|
|
|
|
|
|
|
|
|
5425.060 |
459.6(4)e |
1728(5)e |
2 |
312(12) |
|
|
|
|
|
| 21946.46 |
o |
21/2 |
1 |
12283.30 |
845.9(1)i |
1906 (11)i |
3 |
711(4) |
|
|
2980(207) |
|
|
| 22278.93 |
o |
11/2 |
1 |
509.845 |
577.465(2)b |
989.917(30)b |
3 |
1300.7(7) |
|
|
|
|
|
| 22311.58 |
o |
19/2 |
2 |
11879.20 |
757.6(4)i |
1167(24)i |
1 |
888(1) |
888(1) |
|
|
|
|
|
|
|
|
|
12283.30 |
845.9(1)i |
1906(11)i |
2 |
914(67) |
|
|
|
|
|
| 22524.15 |
o |
11/2 |
1 |
509.845 |
577.465(2)b |
989.917(30)b |
2 |
760(2) |
|
|
|
|
|
| 23031.84 |
e |
15/2 |
1 |
0.000 |
673.753(2)b |
1449.330(40)b |
3 |
479(3) |
|
|
450(96) |
|
|
| 23112.35 |
e |
15/2 |
1 |
0.000 |
673.753(2)b |
1449.330(40)b |
3 |
395(5) |
|
|
|
|
|
| 23191.65 |
o |
9/2 |
1 |
2419.480 |
591.564(7)b |
733.233(70)b |
2 |
235(19) |
|
|
|
|
|
| 23248.17 |
o |
13/2 |
1 |
2310.090 |
405.106(3)b |
−92.638(50)b |
2 |
107(6) |
|
|
|
|
|
| 23438.36 |
o |
11/2 |
1 |
509.845 |
577.465(2)b |
989.917(30)b |
3 |
361(2) |
|
|
929(33) |
|
|
| 23519.94 |
o |
9/2 |
1 |
509.845 |
577.465(2)b |
989.917(30)b |
2 |
887.1(6) |
|
|
229(6) |
|
|
| 24824.89 |
o |
13/2 |
2 |
285.500 |
532.204(2)b |
928.861(30)b |
2 |
269(7) |
280(7) |
|
726(183) |
750(182) |
|
|
|
|
|
|
462.080 |
472.643(2)b |
1154.239(17)b |
2 |
291(7) |
|
|
773(181) |
|
|
| 24891.99 |
o |
17/2 |
1 |
462.080 |
472.643(2)b |
1154.239(17)b |
3 |
242(2) |
|
|
1145(70) |
|
|
| 25373.85 |
e |
13/2 |
1 |
2771.675 |
682.911(3)b |
1167.489(50)b |
3 |
340(1) |
|
|
850(30) |
|
|
| 25908.59 |
o |
7/2 |
1 |
4695.505 |
215.653(15)b |
−401.862(60)b |
3 |
485(3) |
|
491.0(3)j |
|
|
166(87)j |
| 27664.77 |
o |
13/2 |
2 |
2310.090 |
405.106(3)b |
−92.638(50)b |
2 |
586(12) |
586(9) |
592.8(4)j |
1161(284) |
1017(250) |
1014 (41)j |
|
|
|
|
|
3719.705 |
354.454(3)b |
72.183(30)b |
2 |
586(8) |
|
|
918(234) |
|
|
| 27914.33 |
o |
7/2 |
1 |
3174.575 |
652.766(20)b |
267.611(150)b |
2 |
815(13) |
|
821.5(2)j |
|
|
222(4)j |
| 28417.42 |
o |
11/2 |
1 |
6351.750 |
439(2)i |
1122(29)i |
3 |
1004(6) |
|
|
|
|
|
| 28585.93 |
o |
5/2 |
1 |
4695.505 |
215.653(15)b |
−401.862(60)b |
2 |
1164(42) |
|
|
1382(425) |
|
|
| 29041.65 |
o |
7/2 |
1 |
9145.230 |
1069(3)h |
1086(7)h |
3 |
761(3) |
|
|
715(26) |
|
|
| 29861.37 |
o |
11/2 |
1 |
5353.370 |
267(1)i |
−449(10)i |
3 |
494(8) |
|
|
|
|
|
| 30058.22 |
o |
17/2 |
1 |
8506.710 |
915(5)h |
500(30)h |
3 |
755(7) |
|
|
|
|
|
| 30253.95 |
o |
5/2 |
1 |
7839.850 |
606.2(7)c |
429.7(4)c |
2 |
256(25) |
|
|
|
|
|
| 30358.22 |
o |
19/2 |
1 |
4646.830 |
481.8(4)e |
2250(5)e |
3 |
929(2) |
|
888.7(6)j |
2571(71) |
|
−1240(16)j |
| 31093.42 |
o |
7/2 |
1 |
6488.280 |
114.9(3)c |
−498.7(7)c |
3 |
486(34) |
|
|
|
|
|
| 33839.15 |
o |
11/2 |
1 |
13071.30 |
703(4)i |
−203(36)i |
3 |
−251(11) |
|
|
|
|
|
| 34223.95 |
o |
21/2 |
1 |
12283.30 |
845.9(1)i |
1906(11)i |
2 |
309(7) |
|
|
|
|
|
Table 3 HFS constants for Tb II levels measured in this work and comparison with previous experimental results
| Investigated level |
No. of transitions |
Combining level |
No. of lines |
A constant (MHz) |
B constant (MHz) |
| Energy (cm−1) |
Parity |
J
|
Energy (cm−1) |
A (MHz) |
B (MHz) |
This work |
Previous |
This work |
Previous |
|
A
|
A
Mean
|
B
|
B
Mean
|
|
Lawler et al.21
Dekker et al.13
Stefanska et al.22
|
| 0.000 |
o |
8 |
3 |
25138.450 |
487(2)a |
1058(30)a |
3 |
1483(2) |
1483(2) |
1482(30)b |
1465(59) |
1438(71) |
1433(30)b |
|
|
|
|
|
25975.160 |
640(2)a |
1094(60)a |
2 |
1482(2) |
|
|
1453(90) |
|
|
|
|
|
|
|
28488.810 |
664(3)c |
2054(25)c |
2 |
1483(3) |
|
|
1418(46) |
|
|
| 1016.380 |
o |
7 |
3 |
25138.450 |
485(3)c |
1014(64)c |
3 |
−72(3) |
−72(3) |
−71(30)b |
1308(80) |
1323(81) |
1313(30)b |
|
|
|
|
|
25975.160 |
640(2)a |
1094(60)a |
3 |
−72(3) |
|
−72(6)c |
1343(83) |
|
1355(70)c |
|
|
|
|
|
28014.875 |
635.1(4)c |
1373(8)c |
3 |
−72(3) |
|
|
1319(82) |
|
|
| 25138.450 |
e |
8 |
2 |
0.000 |
1482(30)b |
1433(30)b |
3 |
487(30) |
485(7) |
487(2)a |
1046(65) |
1056(70) |
1058(30)a |
|
|
|
|
|
1016.380 |
−72(6)c |
1355(70)c |
3 |
485(7) |
|
485(3)c |
1074(85) |
|
1014(64)c |
| 27244.25 |
e |
7 |
1 |
1016.380 |
−72(6)c |
1355(70)c |
3 |
363(14) |
|
|
|
|
|
| 28014.875 |
e |
8 |
2 |
0.000 |
1482(30)b |
1433(30)b |
3 |
632(30) |
636(7) |
634(2)a |
1396(59) |
1392(63) |
1364(45)a |
|
|
|
|
|
1016.380 |
−72(6)c |
1355(70)c |
3 |
636(7) |
|
635.1(4)c |
1380(112) |
|
1373(8)c |
| 28649.095 |
e |
7 |
2 |
3010.050 |
1542(30)b |
1235(30)b |
3 |
745(30) |
743(5) |
745(3)a |
819(61) |
823(65) |
800(45)a |
|
|
|
|
|
3542.400 |
−14(3)c |
947(74)c |
3 |
743(5) |
|
745(2)c |
840(113) |
|
775(24)c |
| 36602.00 |
e |
8 |
1 |
13518.25 |
508(2)c |
1173(62)c |
2 |
364(8) |
|
|
|
|
|
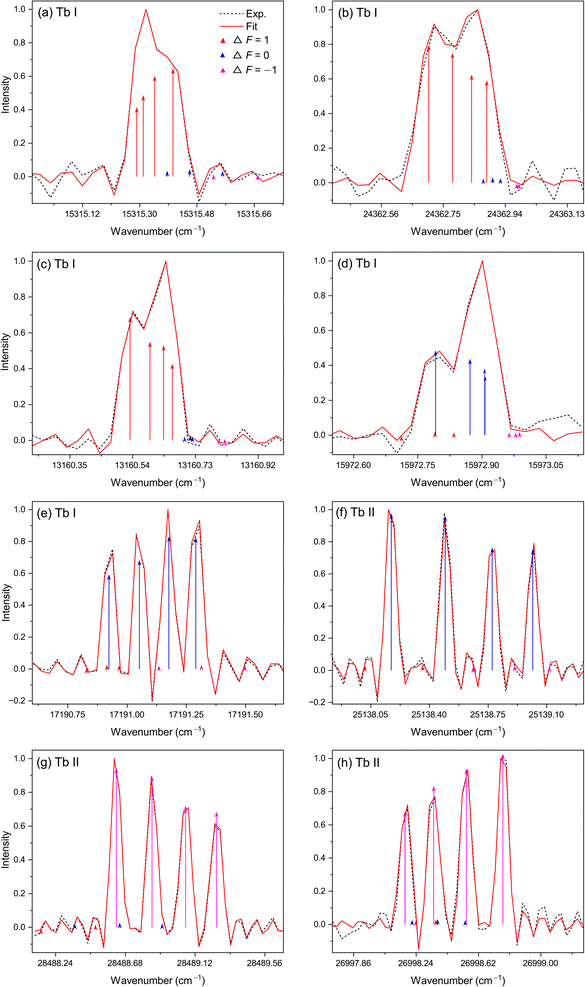 |
| | Fig. 1 Examples of observed (black dashed) and fitted line profiles (red trace). The colored arrows indicate the individual HFS components distinguished by the transition rules. Tb I: (a) 15825.17 → 509.845 cm−1. (b) 24824.89 → 462.080 cm−1. (c) 13622.69 → 462.680 cm−1. (d) 21397.91 → 5425.060 cm−1. (e) 21837.92 → 4646.830 cm−1. Tb II: (f) 25138.450 → 0.00 cm−1. (g) 28488.810 → 0.00 cm−1. (h) 28014.875 → 1016.380 cm−1. The intensity of the spectral line is the normalized intensity. | |
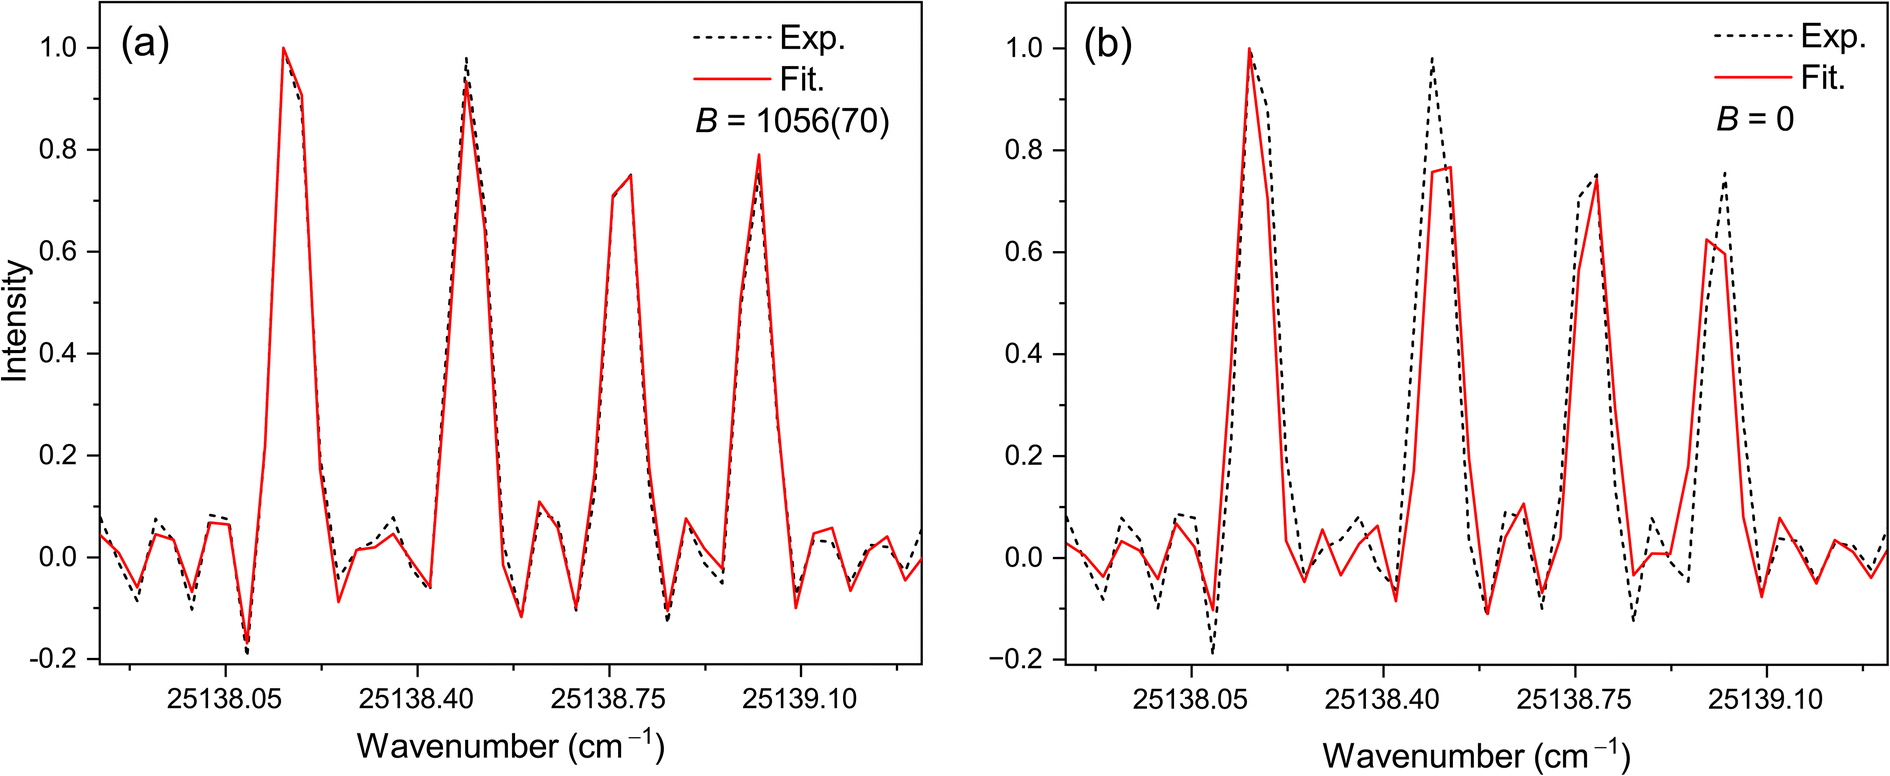
In contrast to the hyperfine interaction of magnetic dipole, the electric quadrupole interaction has little effect on Tb HFS splitting. Since the resolution of the FTS spectra used in the present work is inadequate, we are unable to reliably determine the B constants of some levels. For these levels, regardless of whether B values are involved in the fits, there is almost the same conformity between the measured and fitted spectral lines. Therefore, their B constants were taken to be zero. However, for 21 Tb I levels and five Tb II levels, when B is zero the match between the fitted and experimental curves could not be achieved to a satisfactory degree. For example, Fig. 2 presents the comparison between the fitted curves with and without B constants of the 25138.450 cm−1 level in the fit for the transition to 0.00 cm−1 in Tb II. It is seen that when B was involved in the fit and its value is 1056(70) MHz, there is a significant improvement in conformance between the fitted and experimental curves. In this case, the B constants need to participate in parameter fits.
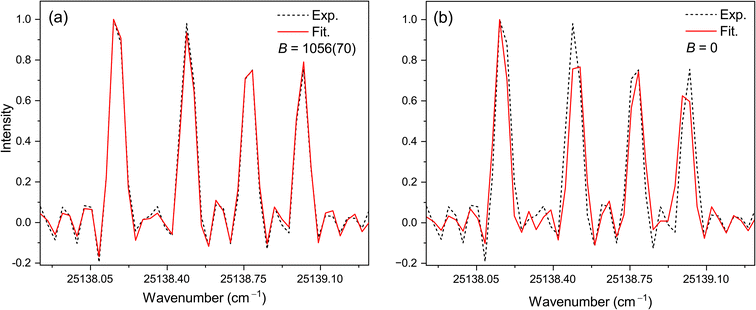 |
| | Fig. 2 Comparison of the fitted line profiles with (a) and without (b) B constant of the Tb II level 25138.450 cm−1 in the fit for the transition to 0.00 cm−1. The unit of B is MHz. | |
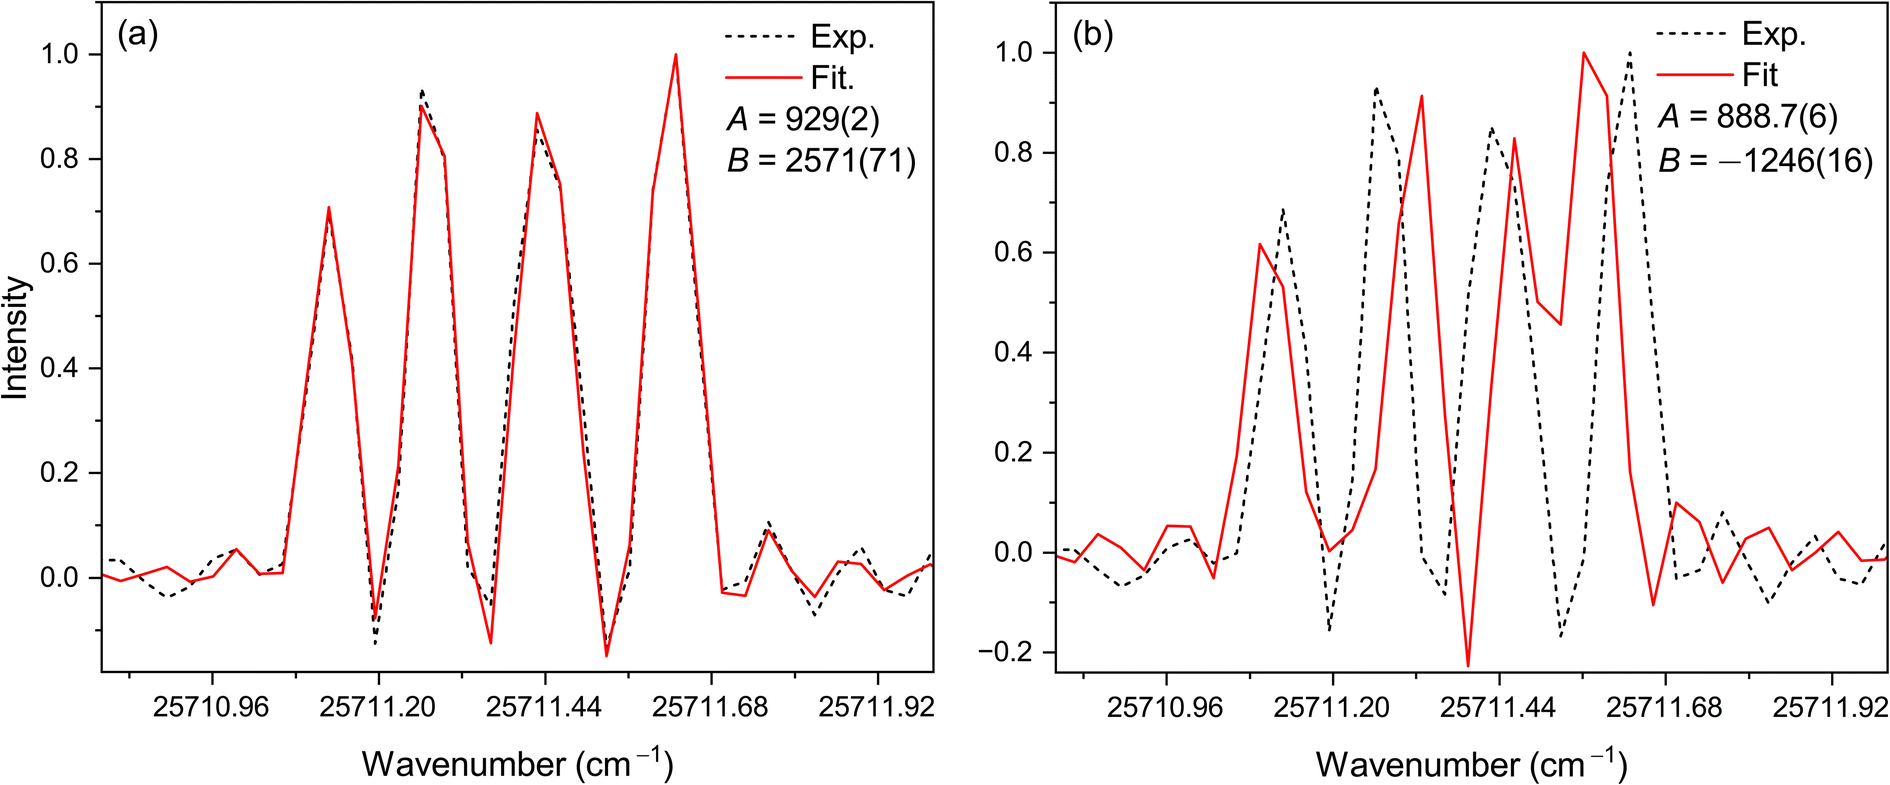
The HFS constant results determined in the present work are in agreement with those previously published values in the literature, except for the A constant of two levels and the A and B constants of one level in Tb I. Our A constants for the two levels at 509.845 and 25908.59 cm−1 agree with the literature values within twice the uncertainties (2σ). The A constant 929(2) MHz of our work for the level at 30358.22 cm−1 was found by analyzing one transition observed in three spectra, a line at 25711.39 cm−1 for which the profiles in these spectra are almost the same, and this has a large difference compared with the A value of 888.7(6) MHz of Suski et al.20 Their B value −1240(16) MHz for this level has the opposite sign to our value of 2571(71) MHz. It should be noted that Suski et al.20 have analysed a different transition, a line at 19027.08 cm−1 with transition down to the level at 11331.14 cm−1 to determine HFS constants for the level at 30358.22 cm−1. Unfortunately, we were unable to observe this line. When we use the A and B values of Suski et al.20 for level 30358.22 cm−1 to simulate the line we observe in our spectra at 25711.39 cm−1 the resulting fit is rather poor compared to the fit with our HFS constants, as shown in Fig. 3. We suggest it would be prudent to check the HFS of this level in future work. The uncertainties in our A and B values are generally larger than those in the literature, which is due primarily to the limitations of relatively low SNR and resolution in the archival spectra that were used in our work.
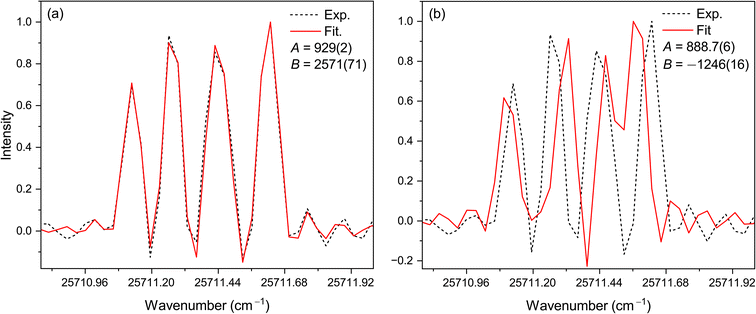 |
| | Fig. 3 Comparison of our HFS fit profiles using A and B HFS constants of our results (left) and those of Suski et al. (right) for the upper level 30358.22 cm−1, for the transition at 25711.39 cm−1 down to the level at 4646.830 cm−1. We observe this line in three spectra, and the fits to the line profiles seen in the other two spectra were similar. The units of A and B are MHz. | |
5. Conclusions
We have determined the HFS constants of 45 levels of Tb I and seven levels of Tb II using archival spectra from NSO Kitt Peak recorded by Fourier transform spectroscopy. For these levels, the results for HFS constants for 34 Tb I levels and two Tb II levels are reported for the first time to our knowledge. The results obtained in this paper are an expansion of experimental HFS data for atomic and ionic terbium, and they will be helpful for insights into atomic structure and more accurate spectral analysis.
Conflicts of interest
There are no conflicts to declare.
Acknowledgements
This work was supported by the National Natural Science Foundation of China (Grant No. U1832114). The authors thank the NSO Kitt Peak (USA) for making available their archival Fourier transform spectra used in this research, and in particular the late J. E. Lawler who, together with M. E. Wickliffe, D. Branston, M. Dulick and G. Nave, measured these spectra.
References
- C. M. Jomaron,
et al., Manganese abundances in mercury-manganese stars, Mon. Not. R. Astron. Soc., 1999, 303(3), 555–564 CrossRef CAS.
- J. J. Cowan,
et al., The chemical composition and age of the metal-poor halo star BD+17°3248, Astrophys. J., 2002, 572, 861 CrossRef CAS.
- P. Beiersdorfer,
et al., Measurement of QED and Hyperfine Splitting in the 2s1/2 − 2p3/2 X-Ray Transition in Li-like 209Bi80+, Phys. Rev. Lett., 1998, 80(14), 3022 CrossRef CAS.
- Y. S. Kozhedub,
et al., Relativistic recoil, electron-correlation, and QED effects on the 2pj − 2s transition energies in Li-like ions, Phys. Rev. A, 2010, 81(4), 042513 CrossRef.
- E. Gomez,
et al., Nuclear Magnetic Moment of 210Fr: A Combined Theoretical and Experimental Approach, Phys. Rev. Lett., 2010, 100(17), 172502 CrossRef PubMed.
- J. M. Baker,
et al., E.p.r. and endor of Tb4+ in Thoria, Proc. Math. Phys. Eng. Sci., 1965, 286(1406), 352–365 CAS.
- Y. Tanaka,
et al., Systematics of ground-state quadrupole moments of odd-A deformed nuclei determined with muonic M x rays, Phys. Rev. C, 1984, 29(5), 1830 CrossRef CAS.
- W. J. Childs,
et al., Hyperfine structure of 4fN6s2 configurations in 159Tb, 161,163Dy, and 169Tm, J. Opt. Soc. Am. B, 1984, 1(1), 22–29 CrossRef CAS.
- W. J. Childs, Hyperfine Structure of Many Atomic Levels of Tb159 and the Tb159 Nuclear Electric-Quadrupole Moment, Phys. Rev. A, 1970, 2(2), 316 CrossRef.
- W. J. Childs and L. S. Goodman, Assignment of unclassified lines in Tb I through high-resolution laser-fluorescence measurements of hyperfine structure, J. Opt. Soc. Am., 1979, 69(6), 815–819 CrossRef CAS.
- W. J. Childs, Use of atomic-beam laser radio-frequency double resonance for interpretation of complex spectra: Tb I as a test case, J. Opt. Soc. Am. B, 1992, 9(2), 191–196 CrossRef CAS.
- C. Arnoult and S. Gerstenkorn, Experimental and theoretical hyperfine structure of low-lying levels of terbium 4f85d6s2 configuration; quadrupole moment of 159Tb, J. Opt. Soc. Am., 1966, 56(2), 177–181 CrossRef CAS.
- J. W. M. Dekker,
et al., Hyperfine structure in Tb II and nuclear moments of 159Tb, Physica, 1970, 46(1), 119–132 CrossRef CAS.
- A. Kumar, H. D. Bist and G. N. Rao, Hyperfine structure Studies of 159Tb by laser optogalvanic spectroscopy, Indian J. Phys., 1990, 64, 459–467 Search PubMed.
- B. Furmann, D. Stefanska and A. Krzykowski, Hyperfifine structure of the 4f85d26s configuration in the Tb atom, J. Phys. B: At. Mol. Opt. Phys., 2016, 49(2), 025001 CrossRef.
- B. Furmann,
et al., Hyperfine structure studies of the odd-parity electronic levels of the terbium atom, J. Quant. Spectrosc. Radiat. Transf., 2019, 237, 106613 CrossRef CAS.
- B. Furmann, D. Stefanska and A. Krzykowski, Hyperfine structure of the 4f85d6s2 configuration of the Tb atom, Spectrochim. Acta Part B At. Spectrosc., 2015, 111, 38–45 CrossRef CAS.
- D. Stefanska and B. Furmann, Hyperfine structure of the odd parity level system in the terbium atom, J. Phys. B: At. Mol. Opt. Phys., 2017, 50(17), 175002 CrossRef.
- D. Stefanska,
et al., Fine and hyperfine structure investigations of even configuration system of atomic terbium, J. Quant. Spectrosc. Radiat. Transf., 2017, 189, 441–456 CrossRef CAS.
- M. Suski,
et al., Hyperfine structure investigations of the odd-parity electronic levels of the terbium atom, J. Quant. Spectrosc. Radiat. Transf., 2023, 298, 108492 CrossRef CAS.
- J. E. Lawler, J. F. Wyart and J. Blaise, Hyperfine Structure in Tb II, Astrophys. J. Suppl., 2001, 137(2), 351 CrossRef CAS.
- D. Stefanska and B. Furmann, Hyperfine structure of the odd-parity configuration 4f95d in singly ionized terbium, J. Quant. Spectrosc. Radiat. Transf., 2017, 200, 113–124 CrossRef CAS.
-
A. Kramida, Y. Ralchenko and J. Reader, NIST ASD Team NIST Atomic Spectra Database (Ver. 5.10) [Online], National Institute of Standards and Technology, Gaithersburg M D, 2022, Available from: https://physics.nist.gov/asd Search PubMed.
- J. E. Lawler and M. E. Wickliffe, Atomic transition probabilities in Tb II with applications to solar and stellar spectra, Astrophys.
J. Suppl., 2001, 137(2), 341 CrossRef CAS.
-
G. K. Woodgate, Elementary Atomic Structure, Clarendon Press, Oxford, 1980 Search PubMed.
- D. H. Forest,
et al., High resolution laser spectroscopy of naturally occurring ruthenium isotopes, J. Phys. G: Nucl. Part. Phys., 2014, 41(2), 025106 CrossRef CAS.
-
R. D. Cowan, The Theory of Atomic Structure and Spectra, Univ of California Press, Berkely, 1981, DOI:10.1525/9780520906150.
-
W. H. Press, et al., Numerical Recipes in Fortran 77: the Art of Scientific Computing, University Press, Cambridge, 1997 Search PubMed.
-
S. P. Davis, M. C. Abrams and J. W. Brault, Fourier Transform Spectrometry, Elsevier, Amsterdam, 2001 Search PubMed.
- M. L. Ding and J. C. Pickering, Measurements of the hyperfine structure of atomic energy levels in Co II, Astrophys. J. Suppl., 2020, 251(2), 24 CrossRef CAS.
-
W. C. Martin, R. Zalubas, and L. Hagan, Atomic Energy Levels: the Rare Earth Elements, U. S. Government Printing Office, Washington D. C., 1978, DOI:10.6028/NBS.NSRDS.60.
- J. E. Sansonetti and W. C. Martin, Handbook of basic atomic spectroscopic data, J. Phys. Chem. Ref. Data, 2005, 34(4), 1559–2259 CrossRef CAS.
|
| This journal is © The Royal Society of Chemistry 2024 |

 *
*

 , where Z is the number of data points in a fitted line and Wk2 is the square of the difference between the experimental and the fitting points in the spectral line. The standard uncertainty of the A value determined from a transition was estimated by