High charge carrier storage capacity and wide range X-rays to infrared photon sensing in LiLuGeO4:Bi3+,Ln3+ (Ln = Pr, Tb, or Dy) for anti-counterfeiting and information storage applications†
Peiran
Huang
,
Zuhui
Wen
,
Yue
Yu
,
Jingyi
Xiao
,
Zhanhua
Wei
* and
Tianshuai
Lyu
 *
*
Xiamen Key Laboratory of Optoelectronic Materials and Advanced Manufacturing, Institute of Luminescent Materials and Information Displays, College of Materials Science and Engineering, Huaqiao University, Xiamen 361021, China. E-mail: lv_tianshuai@126.com; lv_tianshuai@hqu.edu.cn; weizhanhua@hqu.edu.cn
First published on 22nd November 2022
Abstract
X-Ray or 254 nm UV-light charged storage phosphors have various promising applications such as in anti-counterfeiting and information storage. However, developing such storage phosphors with high charge carrier storage capacity remains challenging. In this work, photoluminescence spectroscopy, thermoluminescence (TL), and vacuum-referred binding energy (VRBE) diagram were combined to study the trapping and liberation processes of charge carriers in Bi3+ and/or Ln3+ (Ln = Tb, Pr, or Dy) doped LiLuGeO4. Unintended defects act as good electron trapping centers, while Bi3+, Tb3+, and Pr3+ act as hole-capturing and recombination centers. Dy3+ does not act as an electron trapping center but as a luminescence center by energy transfer from Bi3+ → Dy3+. The ratios of the integrated TL intensities between 303 K and 650 K for LiLuGeO4:0.005Bi3+, LiLuGeO4:0.005Bi3+,0.005Tb3+, or LiLuGeO4:0.005Bi3+,0.005Dy3+ after X-ray charging to that of the state-of-the-art BaFBr(I):Eu2+ is about 1.24, 0.59, and 0.90, respectively. More than 10 h or 40 h afterglow was measurable in both LiLuGeO4:0.005Bi3+ and LiLuGeO4:0.005Bi3+,0.005Tb3+ after X-ray or 254 nm UV-light charging. The stored charge carriers stored can be efficiently excited to produce optically stimulated luminescence with a wide range 365 nm UV-light to 850 nm infrared laser beam. Proof-of-concept colour-tailorable afterglow, X-ray irradiation time or sample mass-dependent dosimetry, and optically-stimulated luminescence with a wide range of 365 nm UV-light to 850 nm infrared laser stimulation will be demonstrated for anti-counterfeiting, information storage, and display applications in the developed Bi3+ and/or Ln3+-doped LiLuGeO4. This work not only reports Bi3+ and/or Ln3+ doped LiLuGeO4 storage phosphors with excellent charge carrier storage capacity but also deepens our understanding of the afterglow and storage phosphors and luminescence mechanisms, which can guide us to explore new afterglow and storage phosphors for multimode applications.
1. Introduction
Afterglow or storage phosphor is an inorganic compound that traps free electrons and holes in compound lattice defects after exposure to ionizing radiation or high energy photons such as 254 nm UV-light.1–5 The stored charge carriers can later be excited to yield rapid photon emission by thermal,6,7 optical,8,9 or mechanical stimulation.10–12 Because of this feature, storage phosphors have many promising applications in X-ray computed tomography (CT),13 dosimeters for radiation detection,14–16 information storage,17,18 anti-counterfeiting,19 and even exploring mechanoluminescence materials for smart compression force sensing.12,20–22 There is a request to develop new afterglow and storage phosphors for exploring new applications such as advanced anti-counterfeiting and information storage.6,23In a storage phosphor, there are electron and hole-trapping centers that can temporarily store the free charge carriers. The duration that charge carriers are captured in compound lattice defects is determined by both the electron and hole trapping depths and their atomic distribution in compound lattices.24 Compared with thermal energy, light such as the 656 nm red laser can be generated at a low cost and can be easily tailored to excite the stored charge carriers in traps to generate optically stimulated luminescence for various applications. For example, information can be stored in a storage phosphor-based imaging plate by X-ray exposure and later be read out by utilizing different energy photon stimulation.25–28 Particularly, the feature of optically stimulated luminescence with a wide range of energy photon stimulation is highly expected for X-ray charged storage phosphor-based computed tomography or exploring advanced anti-counterfeiting applications.29 Currently, developing X-ray or 254 nm UV-light charged storage phosphors with high charge carrier storage capacity and with a wide range of energy photon stimulation remains challenging. Many scientists have focussed on the study of inorganic compounds with persistent luminescence features after exposure to ultraviolet instead of X-rays. The charge carrier capture and release processes are often not deeply studied and always remain unclear. BaFBr(I):Eu2+ has still been the state-of-the-art storage phosphor until now.29 However, it is hygroscopic. It is then necessary to explore new storage phosphors with high chemical stability, high charge carrier storage capacity, and a wide range of energy photon stimulated luminescence features for exploiting advanced anti-counterfeiting, information storage, and display applications.
In an afterglow or storage phosphor, the emission wavelength is determined by the properties of the recombination and luminescence centers. An object can be correctly seen under white light illumination in the dark. There is an interest to develop white afterglow phosphors.19,30–32 White afterglow phosphors are rarely reported until now since it remains challenging to find a recombination and luminescence center that can give afterglow emission in the entire visible spectral range.33 Afterglow phosphors with emission in the ultraviolet range from 315 to 400 nm (UVA) have attracted scientists’ attention in recent years because of their potential applications such as in sterilization and special tagging for anti-counterfeiting.34,35 Compared with afterglow phosphors with emission in the visible spectral range, the UVA afterglow phosphors have rarely been reported.36–38 Therefore, it is interesting to develop a white afterglow phosphor together with the UVA afterglow for anti-counterfeiting applications.
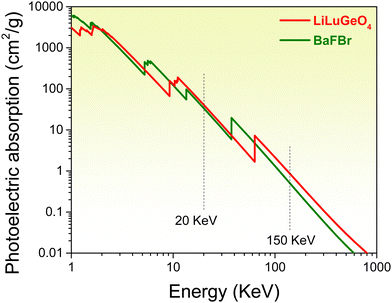
ARE(Si, Ge)O4 (A = Li or La; RE = Y or Lu) family compounds are interesting compounds for studying the luminescence mechanism.39,40 In T. Lyu's previous work in ref. 37 and 41 the vacuum-referred binding energy diagram of LiLuGeO4 together with bismuth and lanthanide levels was reported. However, it has not been utilized to explore afterglow or storage phosphors. In ref. 42, an UVA afterglow phosphor LiLuGeO4:Bi3+,Yb3+ was reported. More than 15 h of the afterglow was measured in LiLuGeO4:Bi3+,Yb3+ after 254 nm UV-light charging in the dark. The optically-stimulated luminescence property was studied by 980 nm infrared laser stimulation. The charge carrier trapping processes are not fully clear and the TL properties after exposure to X-rays still remain unknown. Fig. 1 shows that the photoelectric absorption coefficients of LiLuGeO4 at 20 and 150 keV are about 1.2 and 1.7 times higher than those of BaFBr, respectively. This means that LiLuGeO4 is a promising compound to explore the X-ray charged storage phosphors. To the best of our knowledge, Bi3+ and/or Ln3+ (Ln = Tb, Pr, or Dy) doped LiLuGeO4 has not been studied yet.
In this work, we will combine photoluminescence spectroscopy, vacuum-referred binding energy (VRBE) diagram, and thermoluminescence (TL) to study charge carrier trapping and liberation processes in Bi3+ and/or Ln3+ (Ln = Tb, Pr, or Dy) doped LiLuGeO4. Unintended defects act as good electron trapping centers, while Bi3+, Tb3+, and Pr3+ act as hole-capturing and recombination centers. The role of Dy3+ and the energy transfer processes from Bi3+ to Dy3+, Tb3+, or Pr3+ will be analyzed. The ratios of the TL intensities of the LiLuGeO4:0.005Bi3+, LiLuGeO4:0.005Bi3+,0.005Tb3+, LiLuGeO4:0.005Bi3+,0.005Dy3+, and LiLuGeO4:0.005Bi3+,0.005Pr3+ charged by X-rays to that of the commercial BaFBr(I):Eu2+ are about 1.24, 0.59, 0.90, and 0.26, respectively. More than 10 h or 40 h afterglow is recordable in the LiLuGeO4:0.005Bi3+ and LiLuGeO4:0.005Bi3+,0.005Tb3+ after X-ray or 254 nm UV-light charging. The charge carriers stored in Bi3+ and/or Ln3+-doped LiLuGeO4 can be efficiently excited to generate optically stimulated luminescence with a wide range of 365 nm UV-light (3.4 eV) to 850 nm infrared laser beam (1.46 eV).
We will demonstrate colour-tailorable afterglow, X-ray irradiation time or sample mass-dependent dosimetry, and optically stimulated luminescence with a wide range of 365 nm UV-light to 850 nm infrared laser stimulation in the developed Bi3+ and/or Ln3+ (Ln = Tb, Pr, or Dy) doped LiLuGeO4 for proof-of-concept anti-counterfeiting, information storage, and display applications. This work not only reports Bi3+ and/or Ln3+ doped LiLuGeO4 with excellent charge carrier storage capacity but also deepens our understanding of the afterglow and storage phosphors and luminescence mechanisms, which can guide us to explore new afterglow and storage phosphors for multimode applications.
2. Experimental
All utilized starting chemicals were purchased from Shanghai Aladdin chemical company. They were stored in a dried room and utilized without further treatment. Bi3+ and/or Ln3+ (Ln = Tb, Pr, or Dy) doped LiLuGeO4 compounds were synthesized by using a typical high-temperature solid-state reaction method. An excess of 10% lithium above the LiLuGeO4 compound stoichiometry ratio was utilized because of the loss of part of lithium at 1150 °C. The appropriate mixtures of Li2CO3 (99.99%), Lu2O3 (99.99%), GeO2 (99.99%), Bi2O3 (99.99%), Tb4O7 (99.99%), Pr6O11 (99.99%), and Dy2O3 (99.99%) were well mixed in an agate mortar with the help of acetone solution. The mixed powders were first heated at 800 °C for 2 h and then at 1150 °C for 6 h in a covered aluminium crucible under an ambient atmosphere. The synthesized compounds were well-ground prior to further measurements.The structures of the synthesized compounds were checked using a Japan Rigaku Smar/SmartLa X-ray diffraction setup. Room temperature (RT) photoluminescence excitation (PLE), photoluminescence emission (PL) spectra, and RT isothermal afterglow spectra as a function of time were recorded using an FLS920 fluorescence spectrometer (Edinburgh Instrument Ltd). The FLS920 spectrometer contains an efficient single photon-counting R928P photomultiplier (Hamamatsu, Japan) and a Xe900 xenon lamp. X-ray excited emission intensity as a function of time, thermoluminescence (TL) glow curves, optically stimulated luminescence (OSL), and RT isothermal decay curves were measured using the facility that combines a TUB00083-2 X-ray tube (MOXTEK, Ltd), a 1.5 W Hg lamp, a Hamamatsu R928P photomultiplier, a SCHOTT BG-39 filter, and a thermostat working in the temperature range from RT (298 K) to 773 K. The TL intensities were corrected by both the sample mass and the irradiation time. For optically stimulated luminescence measurements, different energy excitation sources were used, i.e., a commercial white light-emitting-diode (WLED, ∼50 mW cm−2), 365 nm UV-light from a lamp (∼400 μW cm−2), 850 nm infrared laser (∼2.6 mW cm−2), and a typical 656 nm red laser (∼8.2 mW cm−2). For all TL measurements, a constant sample mass of 0.0300 g was utilized. Prior to TL measurements, all samples were heated to ∼673 K at a heating rate of 1 K s−1 in the dark to remove randomly stored charge carriers in traps. For afterglow photographs, 254 nm UV light from a commercial lamp (WFH-204BS, Qiwei Ltd, China) was utilized as the excitation source. All photographs were taken with an iPhone 6s Plus or a Nikon D850 camera.
3. Results
3.1. Photoluminescence spectroscopy and afterglow spectra
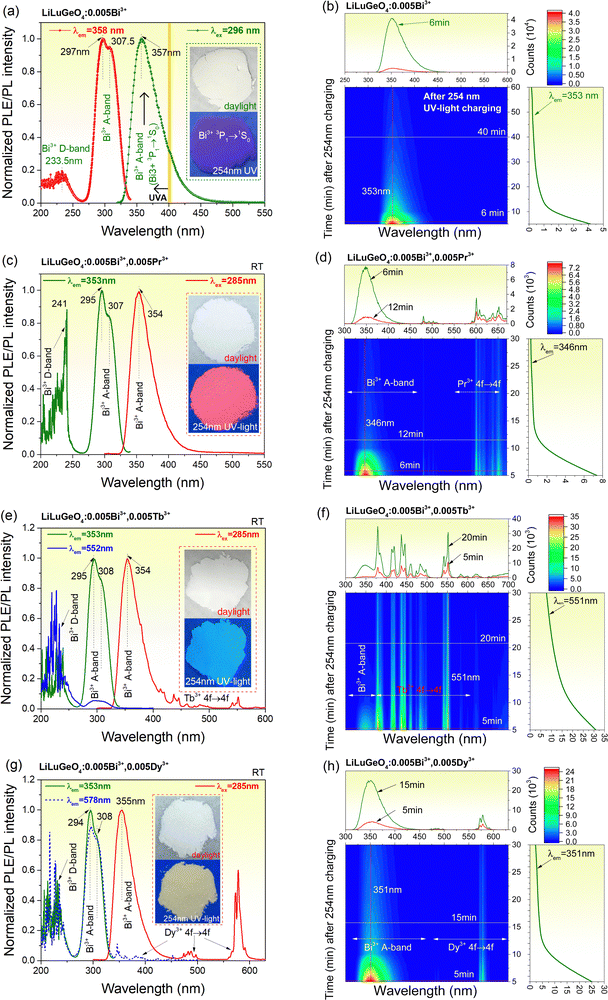
Fig. 2(a) shows the RT PLE and PL spectra of LiLuGeO4:0.005Bi3+. Upon 296 nm excitation, an emission band peaked at about 357 nm, and extended from 300 to 500 nm. Similar to that in ref. 41, this emission band is assigned to the characteristic Bi3+ 3P1 → 1S0 (A-band) emission. About 86% of the emission spectrum appears in the ultraviolet A (UV-A) spectral range from 315 to 400 nm.35,43,44 The excitation spectrum monitored at 358 nm gives rise to an excitation band peaked at 233.5 nm and two strong excitation bands peaked at 297 nm and 307.5 nm. Similar to ref. 39 and 41, the 233.5 nm excitation band is assigned to the charge transfer from the Bi3+ 1S0 ground state to the conduction band (CB), i.e., the Bi3+ D-band. The excitation bands peaked at 297 nm and 307.5 nm are attributed to the characteristic Bi3+ excitation A-band (1S0 → 3P1) with the Jahn–Teller splitting of the 3P1 excited state.45,46Fig. 2(b) shows the 2D contour plot of the RT isothermal afterglow spectra as a function of time in the dark for LiLuGeO4:0.005Bi3+ after charging with the Hg lamp (254 nm UV-light). An afterglow of more than 1 h was measurable in LiLuGeO4:0.005Bi3+. The afterglow spectra in Fig. 2(b) and Fig. S2 (ESI†) are consistent with the photoluminescence spectrum in Fig. 2(a), indicating that Bi3+ is the recombination and luminescence center in LiLuGeO4:0.005Bi3+.Fig. 2(c) shows the RT PLE (λem = 353 nm) and PL (λex = 285 nm) spectra of LiLuGeO4:0.005Bi3+,0.005Pr3+, which are similar to those of the LiLuGeO4:0.005Bi3+, as shown in Fig. 2(a). Fig. 2(d) shows the 2D contour plot of RT isothermal afterglow spectra for LiLuGeO4:0.005Bi3+,0.005Pr3+ after charging with 254 nm UV-light. The afterglow spectrum constitutes the Bi3+ A-band and the characteristic Pr3+ 4f → 4f emissions from 475 to 675 nm. An afterglow of more than 0.5 h was measurable after charging with 254 nm UV-light.
Fig. 2(e) shows RT PLE and PL spectra of LiLuGeO4:0.005Bi3+,0.005Tb3+. The excitation spectrum monitored at 353 nm is similar to that in Fig. 2(a). Upon Bi3+ A-band excitation at 285 nm, not only the Bi3+ A-band emission but also the typical Tb3+ 4f → 4f emissions appeared. The excitation spectrum monitored at the Tb3+ 552 nm emission constitutes the excitation Bi3+ A-band and D-band. This means that there is an energy transfer process from Bi3+ to Tb3+ in LiLuGeO4:0.005Bi3+,0.005Tb3+. Fig. 2(f) shows the RT isothermal afterglow spectra of LiLuGeO4:0.005Bi3+,0.005Tb3+ after charging with 254 nm UV-light. The afterglow spectrum constitutes both the Bi3+ A-band and the characteristic Tb3+ 4f → 4f emissions, which can be measured for more than 0.5 h in the dark.
Fig. 2(g) shows the RT PLE and PL spectra for LiLuGeO4:0.005Bi3+,0.005Dy3+. Upon the Bi3+ A-band excitation at 285 nm, both the characteristic Bi3+ A-band and the Dy3+ 4f → 4f emissions appeared. Since ∼86% of the Bi3+ A-band emission appeared in the UVA spectral range, LiLuGeO4:0.005Bi3+,0.005Dy3+ appeared as the yellow powder because of the Dy3+ 4f → 4f emissions from 550 to 600 nm upon 254 nm UV-light illumination, as demonstrated in the inset in Fig. 2(g). The excitation spectrum monitored at the Bi3+ A-band emission at 353 nm shares the same shape as that monitored at the typical Dy3+ 4f → 4f emission at 578 nm. This means that there is an energy transfer process from Bi3+ to Dy3+. Fig. 2(h) shows the RT isothermal afterglow spectra for LiLuGeO4:0.005Bi3+,0.005Dy3+ after charging with 254 nm UV-light. The afterglow spectrum constitutes both the characteristic Bi3+ A-band and Dy3+ 4f → 4f emissions. More than 0.5 h Bi3+ and Dy3+ afterglow are recordable in the dark.
3.2. Charge carrier trapping and release liberation processes in LiLuGeO4:0.005Bi3+ and LiLuGeO4:0.005Bi3+,0.005Ln3+ (Ln = Tb, Pr, or Dy)
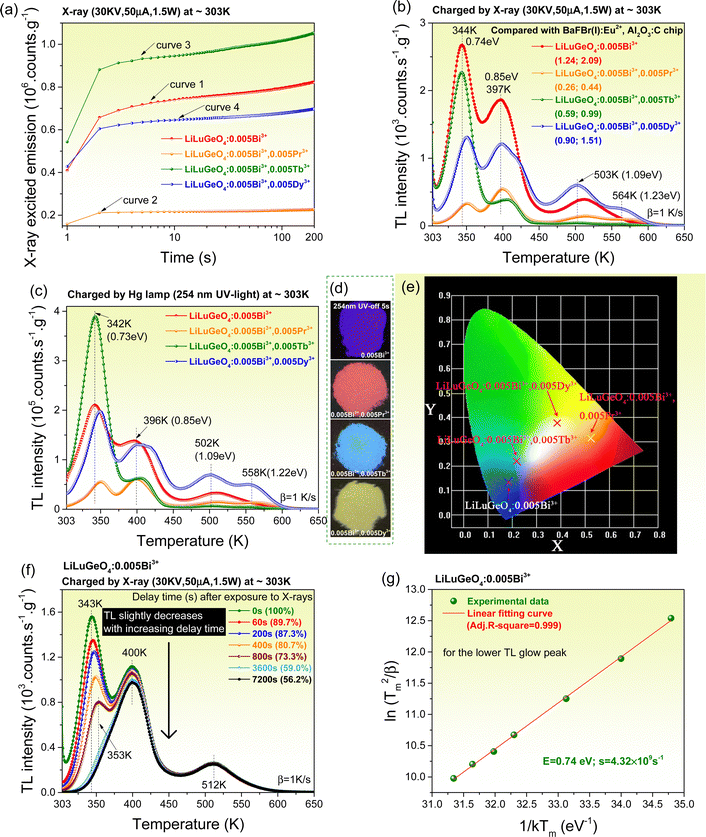
To understand the afterglow properties shown in Fig. 2, the charge carrier capture and liberation processes in Bi3+ and/or Ln3+ (Ln = Tb, Pr, or Dy) doped LiLuGeO4 storage phosphors were further studied. Fig. 3(a) shows the X-ray excited integrated emission intensities from 300 to 750 nm as a function of X-ray exposure time for Bi3+ and/or Ln3+ doped LiLuGeO4. In Fig. 3(a), all emission intensities gradually increase with increasing time. This is because the traps are getting fully filled with increasing time and more free charge carriers are available, which can be recombined to generate direct luminescence. LiLuGeO4:0.005Bi3+,0.005Tb3+ has the strongest X-ray excited emission intensity (curve 3).Fig. 3(b) shows the TL glow curves recorded at a heating rate (β) of 1 K s−1 for LiLuGeO4:0.005Bi3+ and LiLuGeO4:0.005Bi3+,0.005Ln3+ (Ln = Tb, Pr, or Dy) after exposure to X-rays. All samples share common TL glow peaks near 344, 397, 503, and 564 K, which are attributed to the liberation of the electrons from unintended defects in LiLuGeO4. The ratios of the integrated TL intensity from 303 to 650 K of Bi3+ and/or Ln3+-doped LiLuGeO4 to that of the state-of-the-art BaFBr(I):Eu2+ and Al2O3:C chip are shown in the legend in Fig. 3(b).
Fig. 3(c) shows the TL glow curves measured at β = 1 K s−1 for the Bi3+ and/or Ln3+-doped LiLuGeO4 after exposure to a Hg lamp (254 nm UV-light). All samples share the common TL glow peaks near 342, 396, 502, and 558 K, which are similar to those shown in Fig. 3(b). The TL intensities obtained by charging at 254 nm UV-light in Fig. 3(c) were about two hundred times stronger than those in Fig. 2(b) obtained by X-ray charging. LiLuGeO4:0.005Bi3+,0.005Tb3+ showed the strongest TL glow band peaked at near 342 K and extended from 303 to ∼375 K. Other samples show the same ∼342 K TL glow peak, but with relatively weaker intensities. Fig. 3(d) and (e) show the afterglow photographs and the corresponding afterglow colour coordinates for LiLuGeO4:0.005Bi3+ and LiLuGeO4:0.005Bi3+,0.005Ln3+ (Ln = Tb, Pr, or Dy) recorded at 5 s after charging with 254 nm UV-light in the dark. The effect of the Tb3+ concentration on the afterglow properties was studied in LiLuGeO4:0.005Bi3+,xTb3+ (x = 0–0.012) storage phosphors. Their X-ray excited emission intensities as a function of time and thermoluminescence glow curves after charging with X-ray or 254 nm UV-light were measured and are shown in Fig. S5–S7 (ESI†).
To further unravel the afterglow property, the charge carrier liberation process was studied for LiLuGeO4:0.004Bi3+. Fig. 3(f) shows the fading characteristics of the TL glow curves of LiLuGeO4:0.004Bi3+ after the first exposure to X-rays and then with different delay durations from 0 s–2 h in the dark. With an increase in the delay time, the TL glow band that peaked at 343 K rapidly decreased, and the TL band that peaked at 400 K slightly decreased. The ratios of the integrated TL intensity from 303 to 650 K with no delay time to that with different delay times from the 60–7200 s are shown as the percentages in the legend of Fig. 3(f).
Fig. S4 (ESI†) gives the TL glow curves for the X-ray charged LiLuGeO4:0.005Bi3+ recorded at different heating rates from β = 0.4–6.4 K s−1. The electron tapping depths were roughly estimated by using a variable rate plot, as demonstrated in Fig. 3(g), and the first-order TL-recombination kinetics equation:47–51
 | (1) |
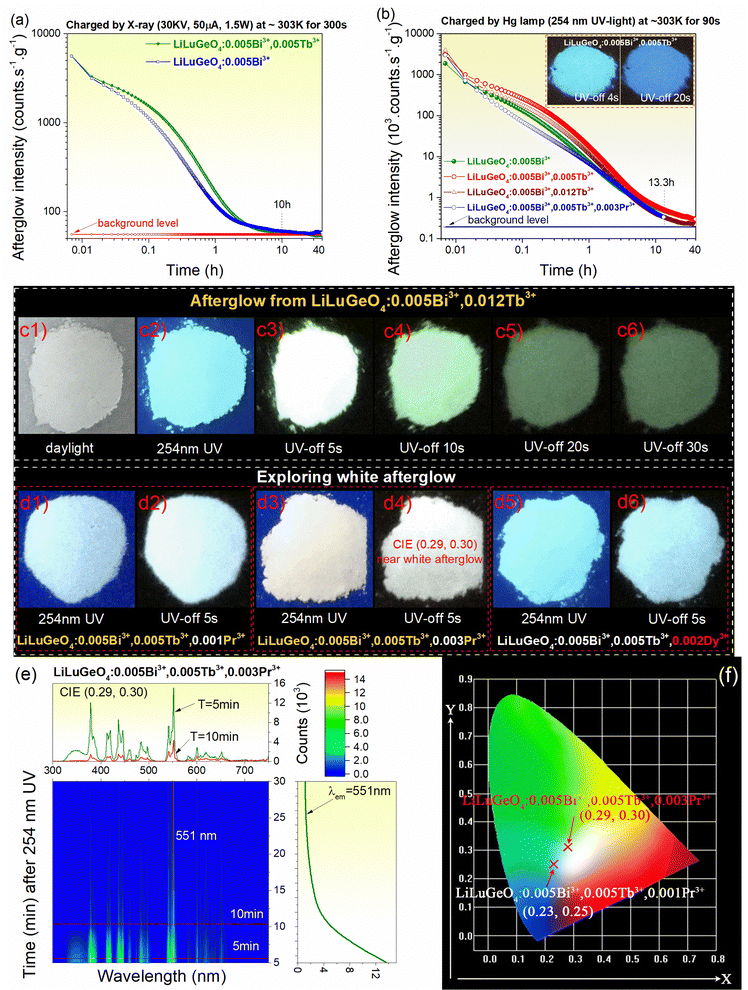
Fig. 4(a) and (b) show the RT isothermal decay curves for Bi3+ and/or Ln3+ (Ln = Tb) doped LiLuGeO4 after exposure to X-rays or 254 nm UV light. An afterglow of more than 10 h was measurable in LiLuGeO4:0.005Bi3+ and LiLuGeO4:0.005Bi3+,0.012Tb3+ after charging with X-rays, as shown in Fig. 4(a). More than 40 h of afterglow was recordable in LiLuGeO4:0.005Bi3+, LiLuGeO4:0.005Bi3+, 0.005Tb3+, and LiLuGeO4:0.005Bi3+,0.012Tb3+ after 254 nm UV-light charging in the dark, as shown in Fig. 4(b). More than 13.3 h of white afterglow was measurable using the 254 nm UV light on LiLuGeO4:0.005Bi3+,0.005Tb3+,0.003Pr3+.
Compared with the afterglow photograph of LiLuGeO4:0.005Bi3+,0.005Tb3+, as shown in the inset in Fig. 4(b), more green afterglow with good emission intensity appears in the optimized LiLuGeO4:0.005Bi3+,0.012Tb3+ after charging with 254 nm UV-light, as demonstrated in Fig. 4(c1)–(c6).
Fig. 4(d1)–(d6) show that the white afterglow can be designed by combining the recombination and luminescence centers of Bi3+, Tb3+, Pr3+, or Dy3+ in LiLuGeO4. Fig. 4(e) shows a 2D contour plot for the RT isothermal afterglow spectra for LiLuGeO4:0.005Bi3+, 0.005Tb3+,0.003Pr3+ after 254 nm UV-light charging. It appeared as white with afterglow colour coordinates of (0.29, 0.30), as shown in Fig. 4(f).
3.3. Evaluating Bi3+ and/or Ln3+ (Ln = Tb, Pr, or Dy) doped LiLuGeO4 as potential dosimeters for wide-range X-ray to infrared photon sensing
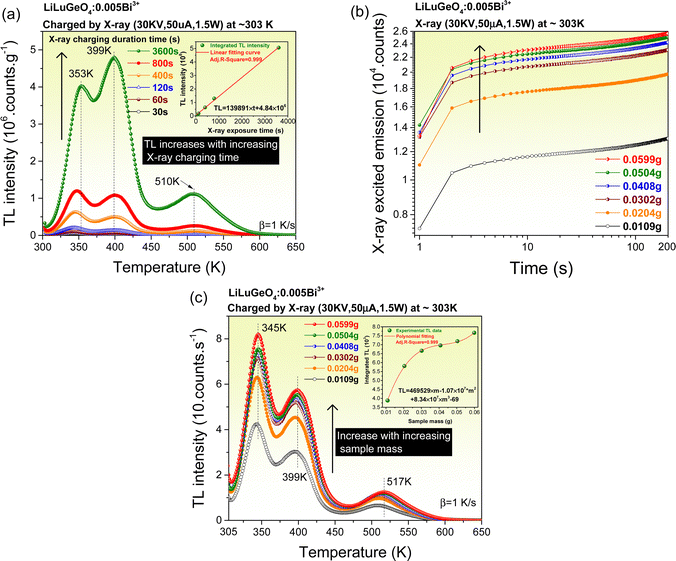
To explore the wide-range, X-ray to infrared photon-sensing, applications, the synthesized Bi3+ and/or Ln3+ (Ln = Tb, Pr, or Dy) doped LiLuGeO4 storage phosphors as potential dosimeters were evaluated. Fig. 5(a) shows the TL glow curves of LiLuGeO4:0.005Bi3+ after exposure to X-rays with a different duration from 30 s–1 h in the dark. The integrated TL intensities between 300 and 650 K as a function of X-ray exposure time are shown in the inset in Fig. 5(a), which can be well fitted by a linear equation of TL = 139891 × t + 4.84 × 10⁶, where TL is the integrated TL intensity from 300 to 650 K and the t is the X-ray exposure time. The integrated TL intensity increases linearly with increasing X-ray exposure time. It implies that the synthesized LiLuGeO4:0.005Bi3+ can be used as a potential dosimeter for X-ray sensing.7,8,14,16Fig. 5(b) shows the X-ray excited integrated emission intensities from 300 to 750 nm as a function of the sample mass changed from 0.0109 g to 0.0599 g for LiLuGeO4:0.005Bi3+. The emission intensity increases with increasing sample mass.
Fig. 5(c) shows the TL glow curves of LiLuGeO4:0.005Bi3+ with different sample masses varied from 0.0109–0.0599 g after exposure to X-rays in the dark. The integrated TL intensities between 305 K and 650 K as a function of sample mass can be fitted by a polynomial formula, as shown in the inset in Fig. 5(c). The TL intensity gradually increases with increasing the sample mass. It means that more LiLuGeO4:0.005Bi3+ storage phosphors can be charged by X-rays since X-rays are penetrative. It indicates that the LiLuGeO4:0.005Bi3+ with different sample masses can be used as a mass-dependent optical battery for X-ray sensing.6
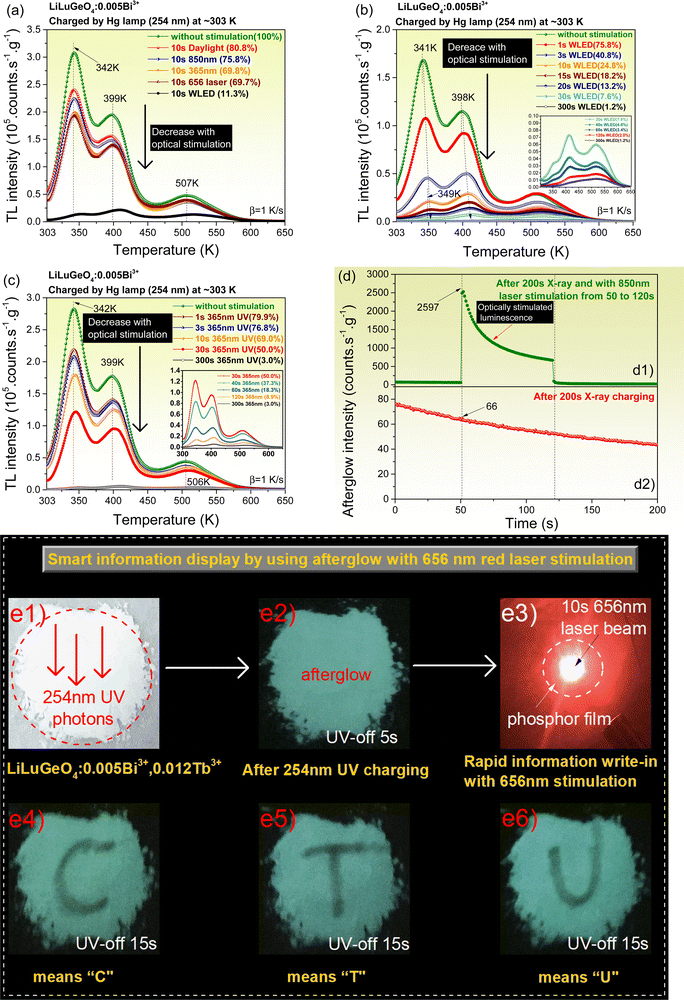
Charge carrier release processes by optical stimulation were studied in the Bi3+ and/or Ln3+ (Ln = Tb, Pr, or Dy) doped LiLuGeO4. Fig. 6(a)–(c) show the TL glow curves measured at a heating rate of 1 K s−1 for LiLuGeO4:0.005Bi3+ after the first exposure to 254 nm UV-light and then followed by different energy photon stimulation at different durations in the dark. The ratios of the integrated TL intensity from 303 to 650 K with no optical stimulation to that with optical stimulation are shown as percentages in the insets in Fig. 6(a)–(c). The stored charge carriers in LiLuGeO4:0.005Bi3+ can be efficiently liberated to yield optically stimulated Bi3+ luminescence using a wide range of 365 nm UV-light to 850 nm infrared laser. The same applies to other Bi3+ and/or Ln3+ doped LiLuGeO4 compounds, as demonstrated in Fig. S8–S13 (ESI†).
Fig. 6(d1) shows the RT isothermal decay curve of LiLuGeO4:0.005Bi3+ after the first exposure to X-rays and then followed by 850 nm infrared laser stimulation from 50–120 s. Compared with the RT isothermal afterglow intensity without stimulation, as shown in Fig. 6(d2), about 39 times stronger optically stimulated Bi3+ luminescence appeared, as shown in Fig. 6(d1), when the 850 nm infrared laser was switched on. This 850 nm infrared laser stimulated Bi3+ emission because of the liberation of stored charge carriers in the X-ray charged LiLuGeO4:0.005Bi3+, which was confirmed by the TL measurements, as shown in Fig. S13 (ESI†).
Fig. 6(a) and Fig. S8 (ESI†) show that about 30% and 39% of the stored charge carriers in LiLuGeO4:0.005Bi3+ and LiLuGeO4:0.005Bi3+,0.005Tb3+ are liberated by 656 nm red laser stimulation with a duration of 10 s. It means that the phosphor area after being stimulated by the 656 nm red laser beam stimulation will give rise to weaker afterglow intensity compared with other phosphor areas without optical stimulation. A proof-of-concept smart and rapid information display for anti-counterfeiting applications is proposed by utilizing the afterglow from the 254 nm UV-light charged LiLuGeO4:0.005Bi3+,0.012Tb3+ with selective optical stimulation using a 656 nm laser beam, as demonstrated in Fig. 6(e1)–(e3). Different afterglow texts of “C”, “T”, and “U” were visible in the dark as shown in Fig. 6(e4)–(e6) by using this method.
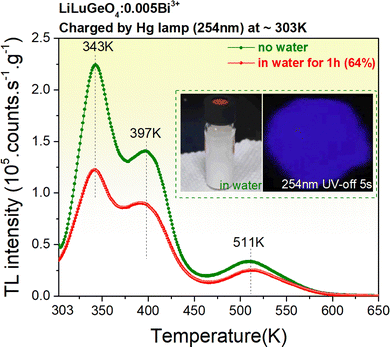
Fig. 7 shows the TL glow curves recorded at a heating rate of 1 K/s after the exposure to 254 nm UV-light for LiLuGeO4:0.005Bi3+ storage phosphor, which was placed in water with a duration of 60 minutes. The ratio of the integrated TL intensity without water treatment to that with water treatment is shown as a percentage of ∼64% in the legend in Fig. 7. This indicates that the synthesized LiLuGeO4:0.005Bi3+ storage phosphor has good chemical stability.
3.4. Exploring anti-counterfeiting, information storage, and display applications
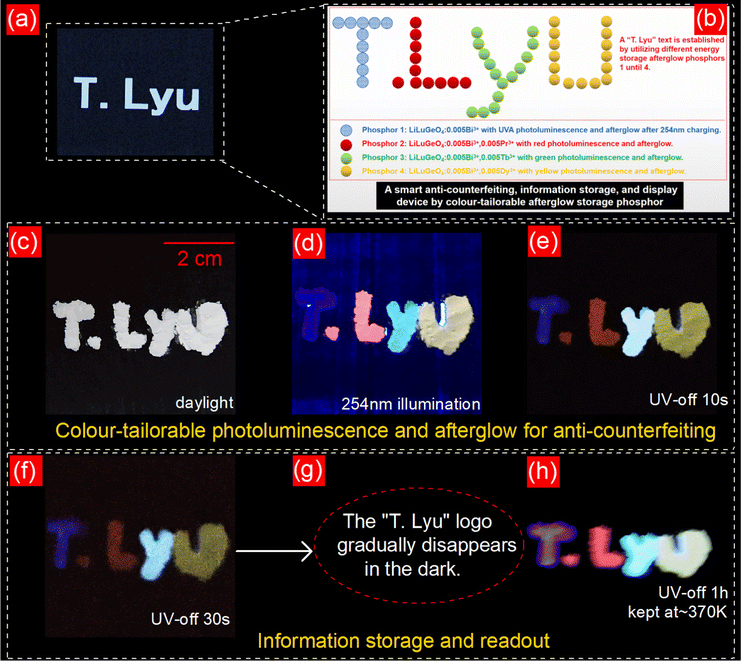
The developed Bi3+ and/or Ln3+ (Ln = Tb, Pr, or Dy) doped LiLuGeO4 storage phosphors were explored for anti-counterfeiting, information storage, and display applications. Fig. 8(a) shows a logo of “T. Lyu”, which is the name of the first mentioned corresponding author for this work. Fig. 8(b) demonstrates how the logo of “T. Lyu” can be constituted using different Bi3+ and/or Ln3+ (Ln = Tb, Pr, or Dy) doped LiLuGeO4 storage phosphors. Fig. 8(c) shows the real logo of “T. Lyu”, which appears as white colour text. Fig. 8(d) and (e) show that a colourful “T. Lyu” text is visible during 254 nm UV-light illumination or after 254 nm UV-light in the dark. This feature is realized by using the colour-tailorable photoluminescence and afterglow from the utilized Bi3+ and/or Ln3+ doped LiLuGeO4 storage phosphors, as explained in Fig. 8(b).Fig. 8(f) and (g) show that the information about “T. Lyu” text is stored upon charging with 254 nm UV-light and the afterglow text gradually disappeared in the dark. After 1 h of waiting in the dark, the stored information of the “T. Lyu” text logo can be read out by heating the logo at about 370 K, as shown in Fig. 8(h).
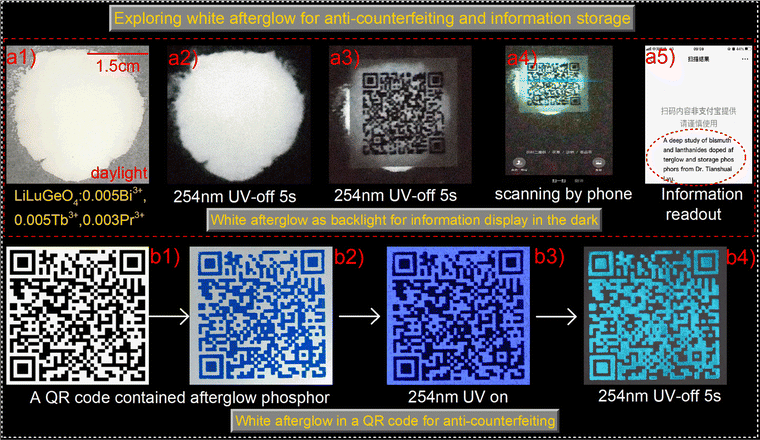
To explore advanced anti-counterfeiting, information storage, and display applications, the white afterglow from the 254 nm UV-light charged LiLuGeO4:0.005Bi3+,0.005Tb3+,0.003Pr3+ was exploited. Fig. 9(a1) and (a2) show that intense white afterglow appeared in the LiLuGeO4:0.005Bi3+,0.005Tb3+,0.003Pr3+ based films after charging with 254 nm UV-light. A QR code was printed on a sheet of commercial paper. The 254 nm-charged LiLuGeO4:0.005Bi3+,0.005Tb3+, 0.003Pr3+-based film was placed underneath the paper. The QR code was visible in the dark, as shown in Fig. 9(a3), which can be scanned using a mobile phone to read out the hidden information of “A deep study of bismuth and lanthanides doped afterglow and storage phosphors from Dr Tianshuai Lyu.” as demonstrated in Fig. 9(a4) and (a5).
Fig. 9(b1) and (b2) show that the QR code was printed on commercial paper by using a screening printing method with blue ink dispersed with afterglow phosphor LiLuGeO4:0.005Bi3+,0.005Tb3+,0.003Pr3+. The phosphor powder was sifted through a 200 mesh screen. A blue afterglow QR code appears in the dark after charging with 254 nm UV-light as shown in Fig. 9(b3) and (b4).
4. Discussion
4.1. Charge carrier trapping and release processes in Bi3+ and/or Ln3+ (Ln = Tb, Pr, or Dy) doped LiLuGeO4
In T. Lyu's previous work described in ref. 41, the vacuum-referred binding energies (VRBE) of Bi3+ and different lanthanide levels in LiLuGeO4 were reported. The VRBE diagram of LiLuGeO4 predicts that the ground state of Dy2+ is located inside the conduction band. It means that Dy3+ did not act as an electron-trapping center in LiLuGeO4. Dy3+ indeed acts as a luminescence center to generate colour-tailorable photoluminescence and afterglow, as shown in Fig. 2(g), 3(d), 4(d6) and 8 because of the characteristic Dy3+ 4f → 4f emissions in the spectral range from 450 to 600 nm. Dy3+ emissions were realized via the energy transfer process from Bi3+ to Dy3+ as evidenced from the photoluminescence excitation spectra of LiLuGeO4:0.005Bi3+,0.005Dy3+, as shown in Fig. 2(g). The VRBE diagram of LiLuGeO4 predicts that Tb3+ acted as the about 2.2 eV deep hole capturer and recombination center. Both the characteristic Bi3+ A-band and Tb3+ 4f → 4f emissions appeared in the afterglow spectra, as shown in Fig. 2(f). The afterglow intensity of Tb3+ was much stronger than that of Bi3+. A possible reason is that a part of the Tb3+ 4f → 4f emissions was realized via the energy transfer from Bi3+ to Tb3+, as evidenced by the photoluminescence excitation and emission spectra of LiLuGeO4:0.005 Bi3+,0.005Tb3+, as shown in Fig. 2(e).Fig. 3(b) and (c) show the TL glow curves of LiLuGeO4:0.005Bi3+ and LiLuGeO4:0.005Bi3+,0.005Ln3+ (Ln = Pr, Tb, or Dy) storage phosphors after exposure to X-rays or 254 nm UV-light. All samples share the common TL glow peaks at 344, 397, 503, and 564 K with corresponding trapping depths of 0.74, 0.85, 1.09, and 1.23 eV, respectively. These trap depths are less deep compared with those of the hole trapping centers of Bi3+ (1.40 eV), Pr3+ (2.0 eV), and Tb3+ (2.20 eV), as predicted from the VRBE diagram of LiLuGeO4.41 We, therefore, assign the common TL glow peaks at ∼344, 397, 503, and 564 K to unintended defects in Bi3+ and/or Ln3+-doped LiLuGeO4, which act as the electron trapping centers. Fig. 2 confirmed that indeed Bi3+, Pr3+, and Tb3+ act as the hole-trapping and recombination centers in LiLuGeO4. Based on the above results and the VRBE diagram of LiLuGeO4 shown in ref. 41, possible charge carrier trapping and liberation processes in Bi3+ and Ln3+-doped LiLuGeO4 are proposed, as illustrated in Fig. 10. Upon exposure to X-rays, free electrons in the conduction band and free holes in the valence band are formed (arrow 1a). The free holes can be migrated in the valence band (arrow 2) and then can be captured by Bi3+, Pr3+, or Tb3+ (arrow 3), generating Bi4+, Pr4+, or Tb4+, respectively. The electrons can be migrated in the conduction band (arrow 4) and then can be captured by different unintended electron trapping defects (arrow 5) which are named the trap-A until trap-D with trap depths of 0.74, 0.85, 1.09, and 1.23 eV. Since the trapping depths of trap-A until trap-D are less deeper than those of Bi3+, Pr3+, and Tb3+ hole trapping centers, the electrons stored in the trap-A until trap-D are first liberated (arrow 6) to recombine with the holes stored in Bi4+, Pr4+, or Tb4+, yielding characteristic Bi3+ A-band, Pr3+, and Tb3+ 4f → 4f emissions during the TL-readout (arrow 7). For 254 nm UV-light charging, free electrons in the conduction band are created by the electron transfer from Bi3+via the Bi3+ D-band excitation (arrow 1b).
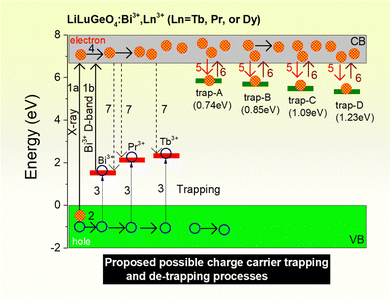 | ||
| Fig. 10 The proposed capturing and release processes of electrons and holes in LiLuGeO4:Bi3+, Ln3+ (Ln = Tb, Pr, or Dy) storage phosphors studied in this work. | ||
Fig. 6 and Fig. S8–S13 (ESI†) show that the stored charged carriers in Bi3+ or/and Ln3+ (Ln = Tb, Pr, or Dy) doped LiLuGeO4 can be efficiently liberated by optically stimulated luminescence with 365 nm UV-light (3.4 eV) to 850 nm infrared laser (1.5 eV). The energies of the stimulation photons in the range from 1.5 to 3.4 eV are larger than the trapping depths of trap-A until trap-D in the range from 0.74 to 1.23 eV. Upon optical stimulation, the electrons stored in trap-A until trap-D are excited to the conduction band, which then can be recombined with the holes trapped at Bi4+, Pr4+, or Tb4+ to produce the typical Bi3+ A-band emission, as demonstrated in Fig. 6(d1), Pr3+ or Tb4+ 4f → 4f emissions.
4.2. Evaluating anti-counterfeiting, information storage, and display applications
Fig. 2 shows that Bi3+, Pr3+, Tb3+, and Dy3+ are special recombination and luminescence centers, which have emission wavelength in the UVA (Fig. 2(a)), red (Fig. 2(d)), blue to green (Fig. 2(f)), and orange spectral range (Fig. 2(h)). It means that a good combination of Bi3+, Pr3+, Tb3+, or Dy3+ can be used to design colour-tailorable photoluminescence and afterglow for anti-counterfeiting applications. This idea was verified and realized as carefully demonstrated in Fig. 3(d), (e), 4 and 8. Note that Bi3+ has about 14% emission in the blue range from 400 to 475 nm, as demonstrated in LiLuGeO4:0.005Bi3+ (Fig. 2(a)). It means that Bi3+ emission in the blue range can be utilized to realize colour-tailorable afterglow in Bi3+ and Ln3+ co-doped LiLuGeO4. To verify this, LiLuGeO4:0.005Tb3+,yBi3+ (y = 0, 0.001, 0.005, 0.01, and 0.015) compounds were prepared and their 2D contour plots of RT isothermal afterglow spectra after 254 nm UV-light charging in the dark are shown in Fig. S18 (ESI†). With the Bi3+ co-doping, the Bi3+ A-band emission in the blue range appears in LiLuGeO4:0.005Tb3+,yBi3+. Fig. S19 (ESI†) further demonstrates that, with increasing y, the afterglow colour coordinate can be slightly tailored from (0.25, 0.29) to (0.22, 0.23), which is more closer to the blue colour range.Fig. 5(c) shows that the integrated TL intensity of LiLuGeO4:0.005Bi3+ increases with an increase in the sample mass. A logo can be made by using LiLuGeO4:0.005Bi3+ with different masses in various areas. After X-ray charging, a phosphor mass-dependent afterglow logo will appear in the dark. Fig. 6(e1)–(e6) demonstrate that afterglow texts of “C”, “T”, and “U” can be smartly designed and rapidly realized by using the strong afterglow from the 254 nm UV-light charged LiLuGeO4:0.005Bi3+,0.012Tb3+ based film with 656 nm red laser stimulation for 10 s. These above features can be combined to design advanced afterglow logos for potential anti-counterfeiting applications.
Fig. 5(a) shows that the integrated TL intensity of LiLuGeO4:0.005Bi3+ linearly increases with increasing X-ray exposure time. It means that the developed LiLuGeO4:0.005Bi3+ storage phosphor can be utilized as a potential dosimeter for X-ray sensing. Particularly, the ratio of the integrated TL intensity of LiLuGeO4:0.005Bi3+ after X-ray charging to that of the state-of-the-art BaFBr(I):Eu2+ is about 1.24 in Fig. 3(b). Considering the excellent charge carrier storage capacity in LiLuGeO4:0.005Bi3+ during X-ray exposure, the proof-of-concept information storage of X-ray imaging application is to be expected using a silicon gel film dispersed with the LiLuGeO4:0.005Bi3+ storage phosphor.8,12,19,37,52 Similar information storage and readout have been already demonstrated by using the “T. Lyu” logo, as shown in Fig. 8(f)–(h) and a QR code in Fig. 9 with 254 nm UV-light charging.
5. Conclusions
Photoluminescence spectroscopy, vacuum referred binding energy (VRBE) diagram, and thermoluminescence techniques were combined to study the capturing and liberation processes of the free electrons and holes in Bi3+ and/or Ln3+ (Ln = Tb, Pr, or Dy) doped LiLuGeO4 storage phosphors. After X-ray or 254 nm UV-light charging, common TL glow peaks appeared at about 344, 397, 503, and 564 K with a heating rate of 1 K s−1. These are attributed to unintended electron trapping defects in Bi3+ and/or Ln3+ doped LiLuGeO4. During the TL-readout, the electrons trapped at the unintended electron trapping detects were liberated to recombine with the holes stored at the hole trapping centers of Bi4+, Tb4+, or Pr4+, generating the typical Bi3+ A-band in the UVA (∼86%) and blue (∼14%) spectral range, Tb3+, or Pr3+ 4f → 4f emissions. Energy transfer processes from Bi3+ → Tb3+ and Bi3+ → Dy3+ partly contributed to the photoluminescence or thermally stimulated 4f → 4f emissions of Tb3+ and Dy3+. The ratios of the integrated TL intensities from 303 to 650 K for LiLuGeO4:0.005Bi3+, LiLuGeO4:0.005Bi3+,0.005Tb3+, or LiLuGeO4:0.005Bi3+,0.005Dy3+ after X-ray charging using an X-ray tube operated at 30 KV, 50 μA, 1.5 W to that of the state-of-the-art BaFBr(I):Eu2+ were about 1.24, 0.59, and 0.90, respectively. More than 10 h or 40 h afterglow was recordable in the LiLuGeO4:0.005Bi3+ and LiLuGeO4:0.005Bi3+,0.005Tb3+ after charging with X-ray or 254 nm UV-light in the dark. More than 13.3 h white afterglow with a colour coordinate of (0.29, 30) appeared in the 254 nm UV-light charged LiLuGeO4:0.005Bi3+,0.005Tb3+,0.003Pr3+. The charge carriers stored in Bi3+ and/or Ln3+ doped LiLuGeO4 can be efficiently excited to produce optically stimulated luminescence with a wide range of 365 nm UV-light (3.4 eV) to 850 nm infrared laser beam (1.46 eV). Proof-of-concept colour-tailorable afterglow, X-ray irradiation time or sample mass-dependent dosimetry, and optically stimulated luminescence with a wide range of 365 nm UV-light to 850 nm infrared laser stimulation were demonstrated for anti-counterfeiting, information storage, and display applications by using the developed Bi3+ and/or Ln3+ (Ln3+= Tb, Pr, or Dy)-doped LiLuGeO4 storage phosphors. This work not only reports Bi3+ and/or Ln3+ (Ln3+= Tb, Pr, or Dy)-doped LiLuGeO4 storage phosphors with excellent charge carrier storage capacities but also deepens our understanding of the afterglow and storage phosphors and luminescence mechanisms, which can guide us to explore new afterglow and storage phosphors for multimode applications.Conflicts of interest
There are no conflicts of interest to declare.Acknowledgements
This was financially supported by Dr Tianshuai Lyu's projects on the topic of persistent luminescence and storage phosphors, i.e., the National Natural Science Foundation of China (No. 12104170), the Fundamental Research Funds for the Central Universities (No. ZQN-1023), and the Scientific Research Funds from Huaqiao University (No. 21BS106).References
- H. Suo, X. Zhang and F. Wang, Controlling X-ray-activated persistent luminescence for emerging applications, Trends Chem., 2022, 4, 726–738 CrossRef.
- H. Luo, A. J. J. Bos and P. Dorenbos, Charge Carrier Trapping Processes in RE2O2S (RE = La, Gd, Y, and Lu), J. Phys. Chem. C, 2017, 121, 8760–8769 CrossRef.
- Q. Peng, T. Wang, H. Tang, T. Ji, W. Wang, J. Xiao, X. Li, Z. Liu, J. Qiu, X. Yu and X. Xu, Up-Converted Long Persistent Luminescence from CsPbBr3 Nanocrystals in Glass, Laser Photonics Rev., 2022, 2200449, DOI:10.1002/lpor.202200449.
- M. Pan, Y. Zhong, H. Lin, H. Bao, L. Zheng, R. Hong, B. Dai, D. Yu, D. Zhang and S. Zhuang, Multilevel optical data storage in a Eu2+/Ho3+ doped Ba2SiO4 phosphor with linear mapping between ultraviolet excitation and a thermoluminescence/photostimulated luminescence response, J. Mater. Chem. C, 2022, 10, 496–505 RSC.
- T. Yanagida, G. Okada and N. Kawaguchi, Ionizing-radiation-induced storage-luminescence for dosimetric applications, J. Lumin., 2019, 207, 14–21 CrossRef.
- X. Wang, X. Zhang, S. Yan, H. Liu and Y. Zhang, Nearly-Unity Quantum Yield and 12-Hour Afterglow from a Transparent Perovskite of Cs2NaScCl6:Tb, Angew. Chem., Int. Ed., 2022, 61 Search PubMed.
- E. G. Yukihara, S. W. S. McKeever, C. E. Andersen, A. J. J. Bos, I. K. Bailiff, E. M. Yoshimura, G. O. Sawakuchi, L. Bossin and J. B. Christensen, Luminescence dosimetry, Nat. Rev. Methods Primers, 2022, 2, 26 CrossRef.
- T. Lyu, P. Dorenbos, C. Li and Z. Wei, Wide Range X-Ray to Infrared Photon Detection and Energy Storage in LiTaO3:Bi3+,Dy3+ Perovskite, Laser Photonics Rev., 2022, 16, 2200055 CrossRef.
- H. Nanto and G. Okada, Optically stimulated luminescence dosimeters: principles, phosphors and applications, Jpn. J. Appl. Phys., 2022 DOI:10.35848/1347-4065/ac9106.
- S. Zhou, Y. Cheng, J. Xu, H. Lin, W. Liang and Y. Wang, Design of Ratiometric Dual-Emitting Mechanoluminescence: Lanthanide/Transition-Metal Combination Strategy, Laser Photonics Rev., 2022, 16, 2100666 CrossRef.
- X. Yang, Y. Cheng, J. Xu, H. Lin and Y. Wang, Stress Sensing by Ratiometric Mechanoluminescence: A Strategy Based on Structural Probe, Laser Photonics Rev., 2022, 2200365 CrossRef.
- T. Lyu, P. Dorenbos, P. Xiong and Z. Wei, LiTaO3:Bi3+,Tb3+,Ga3+,Ge4+: A Smart Perovskite with High Charge Carrier Storage Capacity for X-Ray Imaging, Stress Sensing, and Non-Real-Time Recording, Adv. Funct. Mater., 2022, 32, 2206024, DOI:10.1002/adfm.202206024.
- P. Leblans, D. Vandenbroucke and P. Willems, Storage Phosphors for Medical Imaging, Materials, 2011, 4, 1034 CrossRef.
- D. Van der Heggen, R. Zilenaite, E. Ezerskyte, V. Fritz, K. Korthout, D. Vandenberghe, J. De Grave, J. Garrevoet, L. Vincze, D. Poelman, J. J. Joos and P. F. Smet, A Standalone, Battery-Free Light Dosimeter for Ultraviolet to Infrared Light, Adv. Funct. Mater., 2022, 32, 2109635 CrossRef.
- N. Shrestha, E. G. Yukihara, D. Cusumano and L. Placidi, Al2O3:C and Al2O3:C,Mg optically stimulated luminescence 2D dosimetry applied to magnetic resonance guided radiotherapy, Radiat. Meas., 2020, 138, 106439 CrossRef.
- J. R. Cameron, F. Daniels, N. Johnson and G. Kenney, Radiation Dosimeter Utilizing the Thermoluminescence of Lithium Fluoride, Science, 1961, 134, 333–334 CrossRef.
- Y. Wang, D. Chen, Y. Zhuang, W. Chen, H. Long, H. Chen and R.-J. Xie, NaMgF3:Tb3+@NaMgF3 Nanoparticles Containing Deep Traps for Optical Information Storage, Adv. Opt. Mater., 2021, 9, 2100624 CrossRef.
- J. Du, S. Lyu, K. Jiang, D. Huang, J. Li, R. Van Deun, D. Poelman and H. Lin, Deep-level trap formation in Si-substituted Sr2SnO4:Sm3+ for rewritable optical information storage, Mater. Today Chem., 2022, 24, 100906 CrossRef.
- T. Lyu, P. Dorenbos, C. Li, S. Li, J. Xu and Z. Wei, Unraveling electron liberation from Bi2+ for designing Bi3+-based afterglow phosphor for anti-counterfeiting and flexible X-ray imaging, Chem. Eng. J., 2022, 435, 135038 CrossRef.
- F. Lin, X. Li, C. Chen, X. Pan, D. Peng, H. Luo, L. Jin, Y. Zhuang and R.-J. Xie, Modeling Polyhedron Distortion for Mechanoluminescence in Mixed-Anion Compounds RE2O2S:Ln3+, Chem. Mater., 2022, 34, 5311–5319 CrossRef.
- Y. Zhuang, X. Li, F. Lin, C. Chen, Z. Wu, H. Luo, L. Jin and R.-J. Xie, Visualizing Dynamic Mechanical Actions with High Sensitivity and High Resolution by Near-Distance Mechanoluminescence Imaging, Adv. Mater., 2022, 34, 2202864 CrossRef.
- Y. Bai, X. Guo, B. Tian, Y. Liang, D. Peng and Z. Wang, Self-Charging Persistent Mechanoluminescence with Mechanics Storage and Visualization Activities, Adv. Sci., 2022, 9, 2203249 CrossRef.
- C. Richard and B. Viana, Persistent X-ray-activated phosphors: mechanisms and applications, Light: Sci. Appl., 2022, 11, 123 CrossRef PubMed.
- J. Ueda, S. Miyano and S. Tanabe, Formation of Deep Electron Traps by Yb3+ Codoping Leads to Super-Long Persistent Luminescence in Ce3+-Doped Yttrium Aluminum Gallium Garnet Phosphors, ACS Appl. Mater. Interfaces, 2018, 10, 20652–20660 CrossRef.
- Y. Zhuang, L. Wang, Y. Lv, T.-L. Zhou and R.-J. Xie, Optical Data Storage and Multicolor Emission Readout on Flexible Films Using Deep-Trap Persistent Luminescence Materials, Adv. Funct. Mater., 2018, 28, 1705769 CrossRef.
- H. Zhao, Y. Cun, X. Bai, D. Xiao, J. Qiu, Z. Song, J. Liao and Z. Yang, Entirely Reversible Photochromic Glass with High Coloration and Luminescence Contrast for 3D Optical Storage, ACS Energy Letters, 2022, 7, 2060–2069 CrossRef.
- X. Bai, Y. Cun, Z. Xu, Y. Zi, A. A. Haider, A. Ullah, I. Khan, J. Qiu, Z. Song and Z. Yang, Multiple Anti-Counterfeiting and optical storage of reversible dual-mode luminescence modification in photochromic CaWO4: Yb3+, Er3+, Bi3+ phosphor, Chem. Eng. J., 2022, 429, 132333 CrossRef.
- Z. Hu, X. Huang, Z. Yang, J. Qiu, Z. Song, J. Zhang and G. Dong, Reversible 3D optical data storage and information encryption in photo-modulated transparent glass medium, Light: Sci. Appl., 2021, 10, 140 CrossRef.
- A. Dobrowolska, A. J. J. Bos and P. Dorenbos, High Charge Carrier Storage Capacity in Lithium Lutetium Silicate Doped with Cerium and Thulium, Phys. Status Solidi RRL, 2019, 13, 1800502 CrossRef.
- R.-P. Wei, Z.-H. Ju, J.-X. Ma, D. Zhang, Z.-P. Zang and W.-S. Liu, A novel white afterglow phosphorescent phosphor Ca3SnSi2O9: Dy3+, J. Alloys Compd., 2009, 486, L17–L20 CrossRef.
- Z. Wang, J. Xu, Z. Ju, S. Zhao, P. Pei, X. Ma and W. Liu, Novel white-emitting afterglow phosphor Na2CaSn2Ge3O12:Dy3+: Preparation, photoluminescence, and phosphorescence properties, J. Alloys Compd., 2021, 856, 157230 CrossRef.
- N. Isabella, J. M. Carvalho, L. Pekka, M. Jaakko, M. Fikret, P. Markus, H. Hanna, P. Sari, H. Harri, S. Jari and L. Mika, Lanthanide and Heavy Metal Free Long White Persistent Luminescence from Ti Doped Li–Hackmanite: A Versatile, Low-Cost Material, Adv. Funct. Mater., 2017, 27, 1606547 CrossRef.
- J. Ueda, S. Miyano, J. Xu, P. Dorenbos and S. Tanabe, Development of White Persistent Phosphors by Manipulating Lanthanide Ions in Gadolinium Gallium Garnets, Adv. Photonics Res., 2021, 2, 2000102 CrossRef.
- L. Liu, J. Shi, X. Sun, Y. Zhang, J. Qin, S. Peng, J. Xu, L. Song and Y. Zhang, Thermo-responsive hydrogel-supported antibacterial material with persistent photocatalytic activity for continuous sterilization and wound healing, Composites, Part B, 2022, 229, 109459 CrossRef.
- Z. Zhou, P. Xiong, H. Liu and M. Peng, Ultraviolet-A Persistent Luminescence of a Bi3+-Activated LiScGeO4 Material, Inorg. Chem., 2020, 59, 12920–12927 CrossRef PubMed.
- S. Miao, Y. Liang, D. Chen, S. Yan, J. Liu, W. Wang and J. Bi, Enabling narrowband cyan photoluminescence and long-lasting ultraviolet-A persistent luminescence in Bi3+ single-doped Sr3Sc2Ge3O12 phosphor by selective site occupation, J. Mater. Chem. C, 2022, 10(38), 14211–14219 RSC.
- T. Lyu and P. Dorenbos, Towards information storage by designing both electron and hole detrapping processes in bismuth and lanthanide-doped LiRE(Si,Ge)O4 (RE = Y, Lu) with high charge carrier storage capacity, Chem. Eng. J., 2020, 400, 124776 CrossRef.
- C. Wang, Y. Jin, J. Zhang, X. Li, H. Wu, R. Zhang, Q. Yao and Y. Hu, Linear charging-discharging of an ultralong UVA persistent phosphor for advanced optical data storage and wide-wavelength-range detector, Chem. Eng. J., 2022, 139558 Search PubMed.
- Z. Qiao, X. Wang, C. Heng, W. Jin and L. Ning, Exploring Intrinsic Electron-Trapping Centers for Persistent Luminescence in Bi3+-Doped LiREGeO4 (RE = Y, Sc, Lu): Mechanistic Origin from First-Principles Calculations, Inorg. Chem., 2021, 60, 16604–16613 CrossRef PubMed.
- X. Wang, C. Heng, Z. Qiao and L. Ning, First-principles study on luminescent properties of Bi3+-doped ALuGeO4 (A = Li, Na): Insights into effects of host cation on emission wavelength, J. Lumin., 2022, 244, 118700 CrossRef.
- T. Lyu and P. Dorenbos, Vacuum referred binding energies of bismuth and lanthanide levels in ARE(Si,Ge)O4 (A = Li, Na; RE = Y, Lu); towards designing charge carrier trapping processes for energy storage, Chem. Mater., 2020, 32, 1192–1209 CrossRef.
- H. Cai, Z. Song and Q. Liu, Infrared-photostimulable and long-persistent ultraviolet-emitting phosphor LiLuGeO4:Bi3+,Yb3+ for biophotonic applications, Mater. Chem. Front., 2021, 5, 1468–1476 RSC.
- Y. Zhang, D. Chen, W. Wang, S. Yan, J. Liu and Y. Liang, Long-lasting ultraviolet-A persistent luminescence and photostimulated persistent luminescence in Bi3+-doped LiScGeO4 phosphor, Inorg. Chem. Front., 2020, 7, 3063–3071 RSC.
- X. Wang and Y. Mao, Emerging Ultraviolet Persistent Luminescent Materials, Adv. Opt. Mater., 2022, 10, 2201466 CrossRef.
- W. Wang, Z. Sun, X. He, Y. Wei, Z. Zou, J. Zhang, Z. Wang, Z. Zhang and Y. Wang, How to design ultraviolet emitting persistent materials for potential multifunctional applications: a living example of a NaLuGeO4:Bi3+,Eu3+ phosphor, J. Mater. Chem. C, 2017, 5, 4310–4318 RSC.
- A. Fukuda, Jahn-Teller Effect on the Structure of the Emission Produced by Excitation in the A Band of KI: Tl-Type Phosphors. Two Kinds of Minima on the 3T1u Adiabatic Potential-Energy Surface, Phys. Rev. B: Solid State, 1970, 1, 4161–4178 CrossRef.
- A. J. J. Bos, Fundamentals of Radiation Dosimetry, AIP Conference Proceedings, 2011, 1345, 5-23.
- F. You, A. J. J. Bos, Q. Shi, S. Huang and P. Dorenbos, Thermoluminescence investigation of donor (Ce3+, Pr3+, Tb3+) acceptor (Eu3+, Yb3+) pairs in Y3Al5O12, Phys. Rev. B: Condens. Matter Mater. Phys., 2012, 85, 115101 CrossRef.
- J. Ueda, P. Dorenbos, A. J. J. Bos, K. Kuroishi and S. Tanabe, Control of electron transfer between Ce3+ and Cr3+ in the Y3Al5-xGaxO12 host via conduction band engineering, J. Mater. Chem. C, 2015, 3, 5642–5651 RSC.
- T. Lyu and P. Dorenbos, Charge carrier trapping processes in lanthanide doped LaPO4, GdPO4, YPO4, and LuPO4, J. Mater. Chem. C, 2018, 6, 369–379 RSC.
- T. Lyu and P. Dorenbos, Bi3+ acting both as an electron and as a hole trap in La-, Y-, and LuPO4, J. Mater. Chem. C, 2018, 6, 6240–6249 RSC.
- T. Lyu and P. Dorenbos, Vacuum-Referred Binding Energies of Bismuth and Lanthanide Levels in LiTaO3 Perovskite: Toward Designing Energy Storage Phosphor for Anti-Counterfeiting, X-Ray Imaging, and Mechanoluminescence, Laser Photonics Rev., 2022, 16, 2200304 CrossRef.
Footnote |
| † Electronic supplementary information (ESI) available. See DOI: https://doi.org/10.1039/d2qm01098d |
| This journal is © the Partner Organisations 2023 |

