Graphene oxide promotes aggregation-induced emission in binary solvent mixtures†
Souvik
Pandit
 ,
Sanyukta
Bhattacharjee
 and
Debabrata
Seth
 *
*
Department of Chemistry, Indian Institute of Technology Patna, Patna 801103, Bihar, India. E-mail: debabrata@iitp.ac.in; Tel: +91-6115-233028
First published on 4th April 2023
Abstract
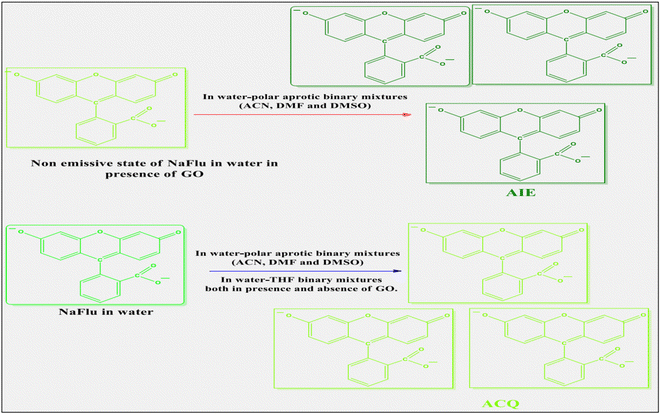
The role of graphene oxide (GO) in quenching the emission properties of various organic fluorophores is well known. However, promoting prototropism of various organic fluorophores or inducing fluorescence enhancement is less documented in the literature. The role of GO on the emission properties of fluorophores in binary-solvent mixtures is not very well studied. In this article, we report the photophysical behavior of fluorescein (NaFlu) molecules in the presence as well as in the absence of GO, in neat solvents and water–polar aprotic solvent binary mixtures. In the presence of GO, addition of polar aprotic solvents promotes solvent-induced aggregation of NaFlu in water, i.e. aggregation-induced emission (AIE), since due to the aggregate formation there is a restriction in the intramolecular rotation of NaFlu molecules, and the chances of non-radiative relaxation pathways decreases. In the absence of GO, NaFlu forms aggregates which leads to π–π coplanar interactions between NaFlu molecules leading to excimer species formation that prefers to decay through non-radiative pathways thus promoting an aggregation-caused quenching (ACQ) phenomenon. Therefore, the presence of GO facilitates the AIE of NaFlu molecules in different binary solvent mixtures. This property of GO will be helpful to create novel GO nanocomposites for device and biosensor applications.
1. Introduction
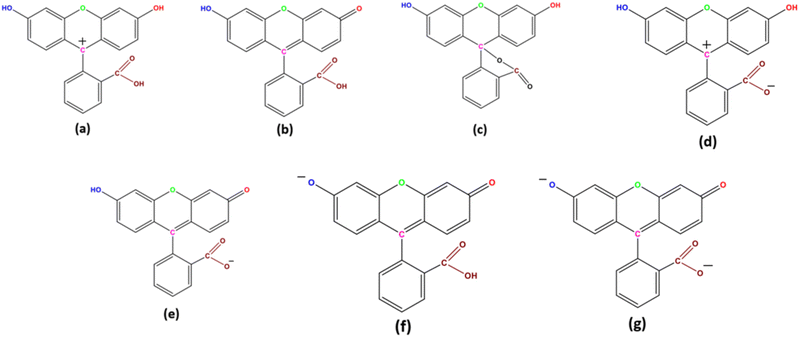
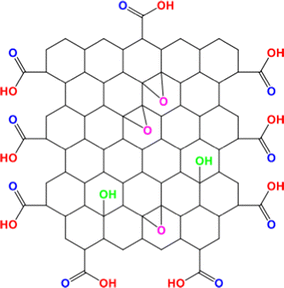
Fluorescein is known to exist in seven different prototropic forms as shown in Scheme 1: four charged forms and three neutral forms each exhibiting distinguishable photophysical properties.1 High photo-stability and a high quantum yield are some of the many unique spectroscopic properties that fluorescein exhibits. This is due to the presence of a rigid and large pi-conjugated structure that fluorescein possesses.2 Fluorescein is widely used as a standard molecule for calculating the quantum yield,3 and it exhibits a wide array of applications known to mankind.4–13One of the notable members of the graphene family is graphene oxide (GO).14 GO is known to form stable colloidal suspensions.15Scheme 2 showcases the various functional groups on the surface of GO. GO has drawn the attention of the scientific community owing to its unique set of properties16–18 and due to its diverse applications.19–26
Binary mixtures involving non-aqueous and aqueous solvents are very interesting systems owing to the non-ideal properties and anomalous behavior of binary mixtures. Substances which are less soluble in neat solvents are readily soluble in binary mixtures.27 To comprehend the diverse set of properties of binary mixtures, one must know the composition of the involved components.28 In most cases it has been seen that binary solvents function as an inhomogeneous mixture and are non-ideal to both dynamical properties such as cluster diffusion, solvation energy, etc. and static properties such as refractive index, viscosity, etc.28–33
A few studies are reported in the literature regarding the photophysical changes of a few organic fluorophores induced by GO. GO is known for enhancing the fluorescence of a hydrophilic molecule 7-(diethylamino)-coumarin-3-carboxylic acid (7-DCA). GO acts both as an enhancer and a quencher of fluorescence of 7-DCA depending upon the solvent choice.34 GO also promotes prototropism of lumichrome,35 Nile blue A (NB)36 and the oxazine-170 perchlorate (OXO) molecule.37 GO induces hydrogen abstraction as well as hydrogen elimination as a result of which prototropism occurs.36,37 This is mainly due to the presence of various oxygen functional groups on the GO surface. Therefore, to further understand the role of GO, we have chosen the fluorescein (NaFlu) molecule to comprehend its photophysical changes in binary solvent mixtures (water–polar aprotic solvents). The solvatochromism of NaFlu in aqueous aprotic solvents is reported in the literature, where the authors have reported that hydrogen bonding causes hypsochromic shift whereas polarity leads to bathochromic shift.2 The solvatochromic properties of the NaFlu dye in a water–alcohol mixture are documented in the literature which states that the spectral shift NaFlu undergoes is influenced by polarity as well as hydrogen bonding acidity of the medium under investigation.38,39 In this work we found another interesting property of GO, promoting aggregation-induced emission (AIE) of NaFlu in binary solvent mixtures. π–π coplanar interactions between NaFlu molecules lead to excimer species formation that prefers to decay through non-radiative pathways thus promoting an aggregation-caused quenching (ACQ) phenomenon. Therefore, the presence of GO facilitates the AIE of NaFlu molecules in different binary solvent mixtures.
2. Materials and methods
2.1 Materials
Sodium fluorescein (NaFlu) was bought from Sigma-Aldrich and used without further purification. From Sigma-Aldrich, GO was purchased and used as received. The various solvents used in this project were acetonitrile (ACN), N,N-dimethyl formamide (DMF), dimethyl sulphoxide (DMSO), tetrahydrofuran (THF) and triple distilled water.2.2 Sample preparation
In 4 mL of each solvent, 2 mg of GO was dissolved, i.e. 0.5 mg mL−1 is the concentration of GO prepared. All the prepared GO dispersions were sonicated in a cold water bath for 1 h. This was performed to dispense the heat generated during the ultrasonication process. The concentration of NaFlu throughout all the experiments was 1 × 10⁻⁵ M.2.3 Instrumentation
The actual spectral changes of NaFlu in the presence of GO were corrected using the inner filter effect which is shown in eqn (1).
 | (1) |
3. Results and discussion
3.1 Steady-state absorption and fluorescence measurements
| [FQ] = K [F][Q] | (2) |
| [F] = [F0] − [FQ] | (3) |
| [Q] = [Q0] − [FQ] | (4) |
 | (5) |
 | (6) |
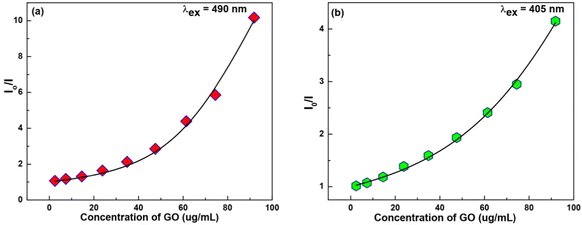
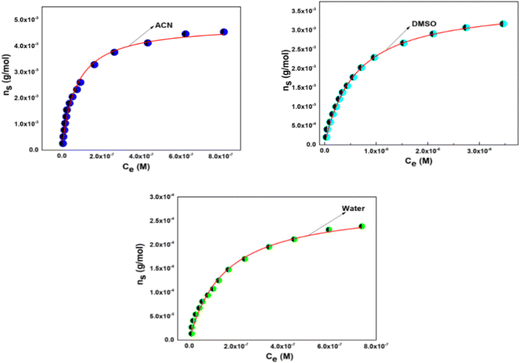
Isotherms obtained are then fitted by using the hyperbolic form of the Langmuir model shown in eqn (7):
 | (7) |
| Solvent | n m (mol g−1) | K L (L mol−1) | R 2 |
|---|---|---|---|
| ACN | (4.85 ± 0.09) × 10−3 | (1.40 ± 0.08) × 107 | 0.993 |
| DMSO | (3.71 ± 0.03) × 10−3 | (1.70 ± 0.04) × 106 | 0.998 |
| Water | (2.85 ± 0.07) × 10−4 | (6.60 ± 0.44) × 106 | 0.993 |
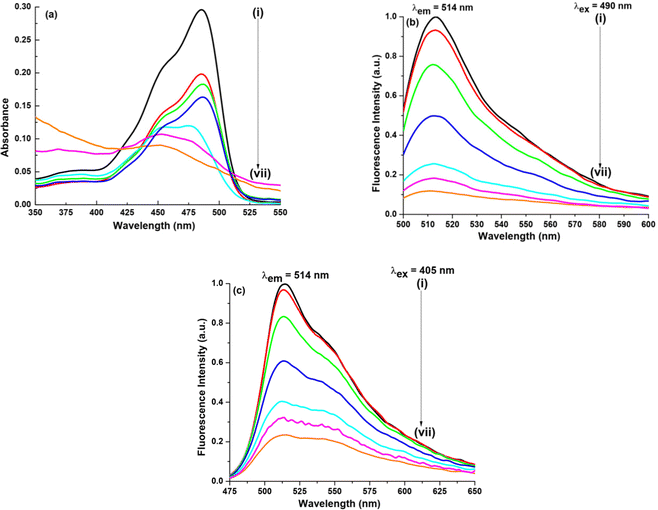
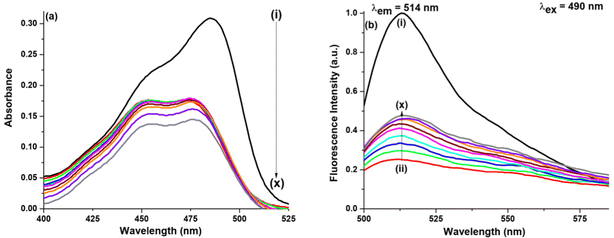
(a) Water–ACN. ACN is also known to form a few hydrogen bonds with water molecules, eventually thus forming clusters. At χACN < 0.2 (where χ means the mole fraction), ACN molecules rupture water structures to a slight extent and water molecules are still self-associated via hydrogen bonding. Hence, in our work since χACN < 0.1, no rupture of water molecules occurs.27 In the presence of GO as shown in Fig. 4, on addition of ACN (χACN = 0.004), no such change occurs either in the absorption peak position or in the absorption intensity. On addition of ACN (χACN = 0.062), however, the intensity amplitude of the 452 nm peak slightly decreases, whereas the intensity amplitude of the 475 nm peak slightly increases. Though the increase or decrease is marginal it is enough to understand that ACN modulates or better to say interacts with NaFlu molecules in the presence of GO in a very subtle manner. In the case of emission spectra, we have used two excitation wavelengths which are 490 nm and 405 nm. The corresponding emission spectra using an excitation wavelength of 405 nm for all other binary mixtures in the presence of GO are provided in Fig. S2 (ESI†). On gradual addition of ACN in the NaFlu GO system, it is evident that there is enhancement of fluorescence intensity, i.e. GO, which was responsible for quenching the fluorescence of NaFlu, now on addition of ACN to the medium promotes increment of fluorescence intensity of NaFlu. We have added ACN up to a point where the fluorescence intensity reaches the saturation value. Fluorescence resonance energy transfer (FRET), formation of non-emissive supramolecular moiety, hydrogen bonding and pi–pi interaction between the different oxygen related functional groups on GO surface are responsible for fluorescence quenching. Now on gradual addition of ACN since the enhancement of intensity occurs, we propose that ACN acts as an enhancer of fluorescence by diminishing the factors to some extent responsible for fluorescence quenching. For the final addition of ACN (χACN = 0.062), to the NaFlu–GO mixture in water, the ABQY value of NaFlu increases to 0.42 when compared to the ABQY value of the NaFlu–GO mixture in water which is 0.34. In the absence of GO, on gradual addition of ACN, it is seen that there is no change in the absorption peak position except that the absorption intensity gradually decreases and ACN, instead of promoting fluorescence intensity, acts as a quencher, and the emission maxima remain the same (514 nm) as shown in Fig. S3 (ESI†). In the absence of GO, for the final addition of ACN (χACN = 0.062), to NaFlu in water, the ABQY value decreases to 0.63 when compared to the ABQY value of NaFlu in neat water which is 0.92.
(b) Water–DMF. In the case of DMF, there are basically three stages of hydrogen bonding in a water–DMF binary mixture. When the volume fraction (V) of DMF, i.e. VDMF, is less than 0.4, addition of DMF to water strengthens the hydrogen bonding network in water. However, when VDMF = 0.4, the tetrahedral structure of water is destroyed, and DMF and water molecules form complexes which are DMF·3H2O and DMF·2H2O. Finally, when VDMF reaches 0.8, the DMF–water complex is converted to the DMF·H2O structure due to the instability of the DMF·nH2O complex.64
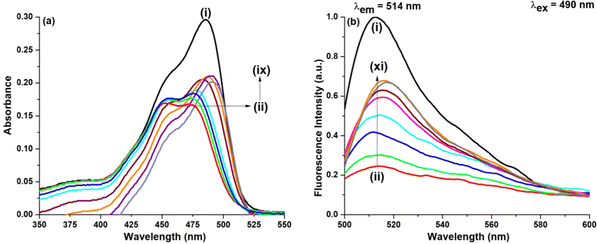
In the presence of GO as shown in Fig. 5, when DMF is added the photophysical change that NaFlu undergoes is very astounding. Initially for a low DMF concentration (χDMF = 0.003), there is no such change except that the absorption intensity value increases but on gradual addition, it is observed that not only the absorption intensity value increases but the peaks at 475 nm and 452 nm experience a bathochromic shift by 12 nm and 8 nm. In short, we can infer that there is a distinguishable conversion of the monoanionic form to the dianionic form of NaFlu in the presence of GO in a water medium. When excited at 490 nm, on addition of DMF, the fluorescence intensity of NaFlu, which was quenched on addition of GO, is now drastically enhanced on addition of DMF (χDMF = 0.080) since at this point the intensity reaches the saturation value with no change in the emission position (514 nm). The corresponding spectra at the excitation wavelength are provided in the ESI.† In fact, DMF is a better enhancer than the rest of the solvents used in our study, which will be discussed later. For the addition of DMF (χDMF = 0.080), to the NaFlu–GO mixture in water, the ABQY value of NaFlu increases to 0.70. In the absence of GO, however, the trend observed in the case of DMF is almost the same, just like ACN. On addition of DMF (χDMF = 0.080), there is no considerable shift in the peak position, which is accompanied by a decrease in the absorption intensity, and DMF promotes quenching of the fluorescence intensity with the emission position appearing at 516 nm as shown in Fig. S3 (ESI†). In the absence of GO, for the addition of DMF (χDMF = 0.080), to NaFlu in water, the ABQY value decreases to 0.60 compared to the ABQY value of NaFlu in neat water (0.92).
(c) Water–DMSO. In the case of water–DMSO binary solvents it is well known that one DMSO molecule associates itself with two water molecules via hydrogen bonding, and hydrogen bonding between DMSO and water is more stable than hydrogen bonding between water molecules themselves. When χDMSO is 0.21 and 0.35, the water structure is unaffected by DMSO but at χDMSO = 0.35, not only DMSO-2H2O complexes are formed but also a deviation from ideal mixing occurs, and DMSO forms complexes with two or three water molecules. Deviation of physical properties occurs when the mole fraction of DMSO is between 0.30 and 0.40. The presence of “micromicelle” arrangements in a water–DMSO mixture when χDMSO = 0.10–0.20, which accounts for the anomalous behaviour of water–DMSO binary mixtures, is also shown. Hence based on the literature, it is evident that the water–DMSO mixture exhibits anomalous behaviour when χDMSO = 0.10–0.20 and 0.30–0.40. In our case, χDMSO < 0.10 and thus there is no anomalous behaviour of water–DMSO binary mixtures in our study.27
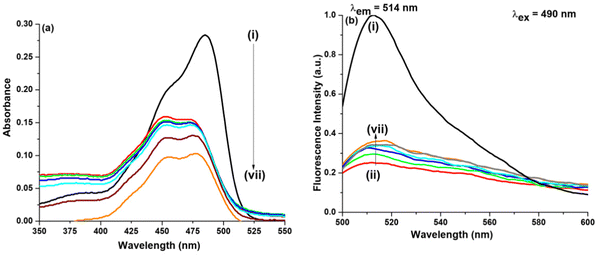
In the presence of GO as shown in Fig. 6, on addition of DMSO (χDMSO = 0.004), no such change either in the absorption peak position or the absorption intensity was observed. On gradual addition until the final addition of DMSO, the intensity amplitude of the 452 nm peak slightly decreases, whereas the intensity amplitude of the 475 nm peak slightly increases accompanied by a decrease in the absorption intensity. Here too we can say DMSO interacts with NaFlu molecules in the presence of GO. In the case of emission spectra, we have used two excitation wavelengths which are 490 nm and 405 nm. The corresponding spectra using an excitation wavelength of 405 nm for all other binary mixtures are provided in the ESI.† On gradual addition of DMSO to the NaFlu–GO system, it is evident that there is an increment in the fluorescence intensity, i.e. GO, which quenched the fluorescence intensity of NaFlu, now on adding DMSO to the medium enhances the fluorescence intensity. We have added DMSO (χDMSO = 0.060) since at this point the fluorescence intensity saturates. Since on gradual addition of DMSO, the intensity enhances, we propose that DMSO acts as an enhancer of fluorescence with the emission peak being intact at 514 nm. For the addition of DMSO (χDMSO = 0.060), to the NaFlu–GO mixture in water, the ABQY value of NaFlu increases to 0.44. Now in the absence of GO, on final addition of DMSO, it is seen that there is no such change in the absorption peak position except that the absorption intensity decreases and DMSO acts as a quencher as shown in Fig. S3 (ESI†). In the absence of GO, for the addition of DMSO (χDMSO = 0.060), to NaFlu in water, the ABQY value decreases to 0.74 compared to the ABQY value of NaFlu in neat water (0.92).
(e) Water–THF. At room temperature, THF is miscible with water at any composition.65 X-Ray scattering data reveal that the total number of water–THF and water–water bonds decreases with increasing the χTHF.65 However, the water–THF bonds are indistinguishable from the water–water hydrogen bonds. In water–THF mixtures microheterogeneity occurs when χTHF is in between 0.10 and 0.50.65 Also at low THF concentrations, the hydrogen bond of the water–water network is little affected by the hydrogen bonds formed between water and THF molecules.66 Since in our work the χTHF value is less than 0.10, there is no possibility of microheterogeneity in the water–THF binary mixtures in our study.
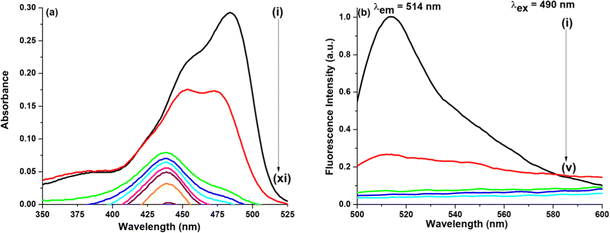
On addition of THF as shown in Fig. 7 (χTHF = 0.002), the peak at 452 nm experiences a blue shift by 15 nm, hence a new peak at 437 nm is formed with a decrease in the absorption intensity. This shows that on addition of THF to the NaFlu–GO system in water, a neutral form of the dye (437 nm) tends to exist. On excitation at 490 nm, the emission peak position remains the same (514 nm) but the intensity progressively decreases. For the addition of THF (χTHF = 0.022) to the NaFlu–GO mixture in water, the ABQY value of NaFlu decreases to 0.08. Now in the absence of GO, on addition of THF (χTHF = 0.022), it is seen that there is a prominent change in the absorption peak position with a decrease in the absorption intensity. The peak at 487 nm completely undergoes a blue shift by 12 nm and thus generates a shoulder maximum at 475 nm. The main absorption peak is generated at 435 nm which corresponds to the neutral form of the dye as shown in Fig. 7. In the absence of GO, for the addition of THF (χTHF= 0.022), to NaFlu in water, the ABQY value decreases to 0.05 when compared to the ABQY value of NaFlu in neat water (0.92). In the NaFlu–water system, THF acts as a quencher and the emission maxima remain the same (514 nm) when excited at 490 nm. The corresponding spectra using an excitation wavelength of 405 nm both in the presence and in the absence of GO are provided in Fig. S2 and S3 (ESI†) respectively.
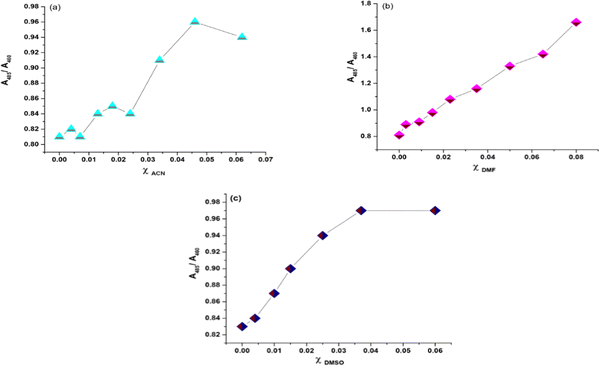
We have plotted the absorption ratio of  of NaFlu vs. the mole fraction of polar aprotic solvents which are ACN, DMF and DMSO as shown in Fig. 8. The plots obtained exhibit a non-linear correlation with the mole fraction of polar aprotic solvents indicating that hydrogen bond formation, solvation and non-ideal behaviour contribute to the obtained spectrum.27
3.3 Time-resolved fluorescence emission (TRFE)
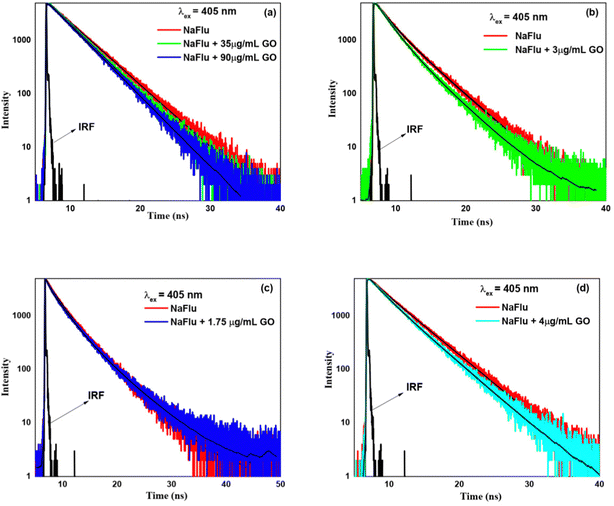
(A) Water–ACN. On addition of ACN (χACN = 0.004), the lifetime value becomes 3.42 ns as shown in Table S3 (ESI†). However, on addition of ACN (χACN = 0.062), the lifetime value increases to 3.75 ns. All the decays exhibit a monoexponential character. From this, it is evident that ACN decreases the rate of non-radiative transition of NaFlu molecules in the NaFlu–GO system. In the absence of GO, for the addition of ACN (χACN = 0.062), the emission decay is monoexponential in nature, and the lifetime value is 3.89 ns (Fig. 10).
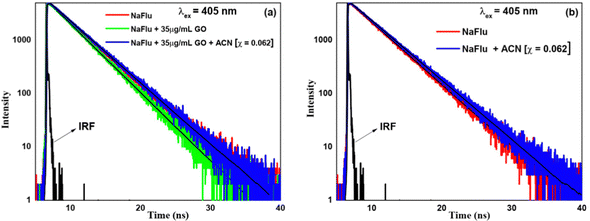 | ||
| Fig. 10 Fluorescence emission decays of NaFlu in (a) a water–ACN binary mixture in the presence of GO and (b) a water–ACN binary mixture in the absence of GO. | ||
(B) Water–DMF. In the presence of GO, on addition of DMF the lifetime value consistently increases, and all the decays showcase monoexponential characteristics. On addition of DMF (χDMF = 0.009), the lifetime value becomes 3.51 ns, and it is 4.02 ns for the addition of DMF (χDMF = 0.080). From this, it is evident that DMF decreases the rate of non-radiative transition in the NaFlu–GO system. In the absence of GO, for the addition of DMF (χDMF = 0.080), the decay remains monoexponential in nature and the lifetime value becomes 4.03 ns as shown in Fig. 11.
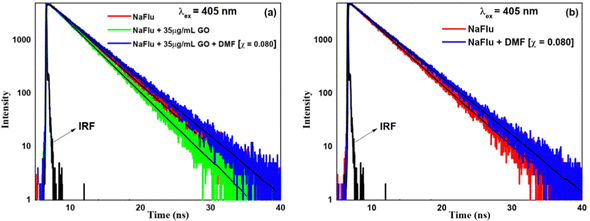 | ||
| Fig. 11 Fluorescence emission decays of NaFlu in (a) a water–DMF binary mixture in the presence of GO and (b) a water–DMF binary mixture in the absence of GO. | ||
(C) Water–DMSO. In the case of DMSO and in the presence of GO, on addition of DMSO (χDMSO = 0.004), the lifetime value becomes 3.37 ns. However, on addition of DMSO (χDMSO = 0.060), the lifetime value increases to 3.66 ns. From this, it is evident that DMSO decreases the rate of non-radiative transition of NaFlu molecules in the NaFlu–GO system. In the absence of GO, for the addition of DMSO (χDMSO = 0.060), the lifetime decay remains monoexponential in nature, and the lifetime value becomes 3.85 ns (Fig. 12).
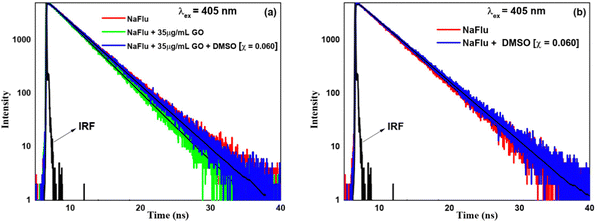 | ||
| Fig. 12 Fluorescence emission decays of NaFlu in (a) a water–DMSO binary mixture in the presence of GO and (b) a water–DMSO binary mixture in the absence of GO. | ||
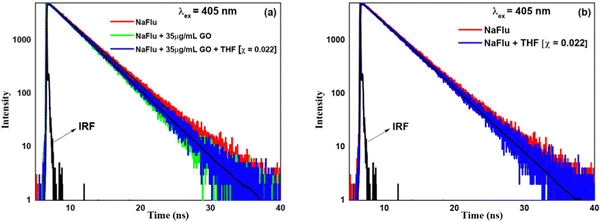
(D) Water–THF. In the presence of GO, on addition of THF (χTHF = 0.002), the lifetime value becomes 3.14 ns, i.e. no prominent change. However, on addition of THF (χTHF = 0.022), the lifetime value increases and remains monoexponential in nature with a lifetime value of 3.31 ns. From this, it is evident that THF, similar to other solvents, decreases the rate of non-radiative transition of NaFlu molecules in the NaFlu–GO system. In the absence of GO, for the addition of THF (χTHF = 0.022), the decay remains monoexponential in nature, and the lifetime value becomes 3.56 ns (Fig. 13).
3.4 Raman spectral study
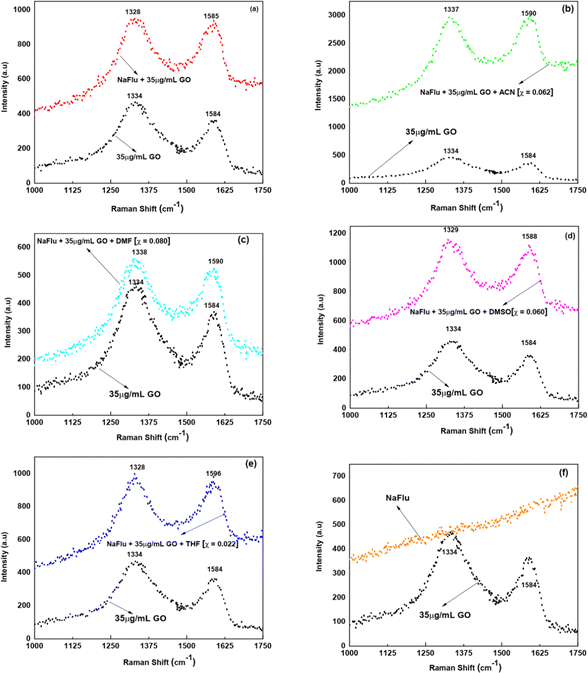
Raman spectroscopy is a powerful, fast, and vital tool to characterize and determine the various diverse set of properties of carbon based materials such as fullerenes, diamond as well as graphite.68 Raman spectroscopy showcases important features of graphene type materials.68 Therefore, in unravelling GO's structural properties, Raman spectroscopy comes in very handy.69 Two distinctive Raman peaks at 1586–1596 cm−1 and at 1336–1347 cm−1 are known to be formed. The presence of E2g vibrational modes of carbon and sp2 carbon atoms leads to the formation of the G band of GO which is at 1586–1596 cm−1. The disordered sp3 carbon atoms present in GO generate the D band which is at 1336–1347 cm−1.34 The parameter to comprehend the defects in bonding, the sp3/sp2 fraction of carbon and disordered carbon content, in graphene oxide is the I(D)/I(G) ratio.70,71 Several studies present in the literature demonstrate that there is a decrease72,73 and an increase74,75 in the I(D)/I(G) ratio. In our work as shown in Fig. 14 we were interested to examine whether there is any surface modification of GO in the presence of binary mixtures both in the presence and in the absence of NaFlu. The I(D)/I(G) ratio of GO for all systems is in between 1.00 and 1.20. Thus, even though there is no prominent change in the I(D)/I(G) ratio, the distinctive peaks of GO, which are the D band and the G band, undergo a shift to both longer and shorter wavelengths followed by an enhancement in the Raman intensity. Thus even though GO does not undergo any drastic modification in its surface morphology, the change in Raman intensity along with shifts in the peak position explains the interaction of GO with the involved species via H-bonding, non-covalent interaction or π–π stacking. Also there are no Raman spectra of NaFlu in the region where GO exhibits Raman peaks as seen in Fig. 14. In the absence of NaFlu the Raman spectra are shown in Fig. S7 (ESI†).3.5 Field emission scanning electron microscopy (FE-SEM) images of GO in different solvent mixtures
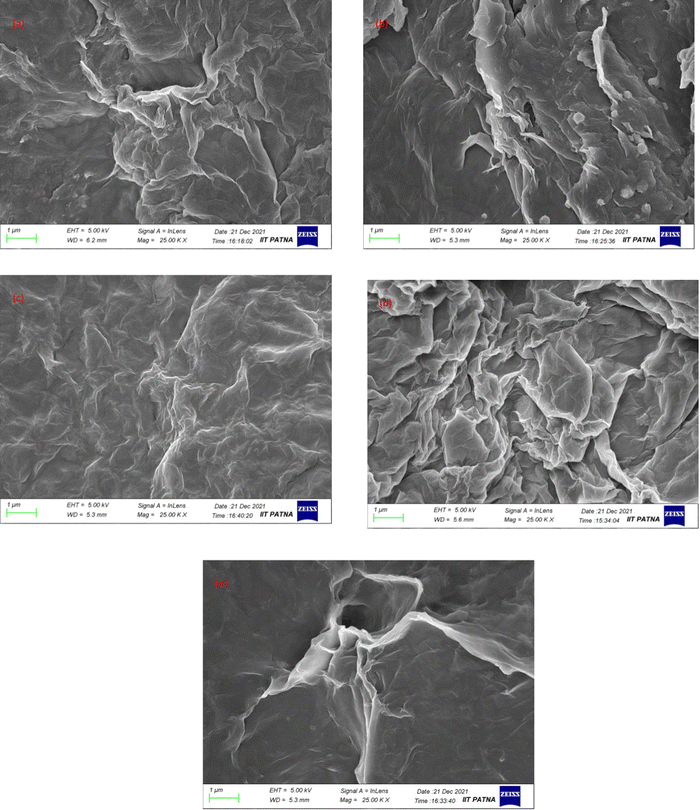
The field emission scanning electron microscopy (FE-SEM) images of GO in the presence and in the absence of NaFlu in water as well as in water–binary mixtures were obtained. The samples were first prepared and then dropped on carbon tape, dried and left overnight. Then the prepared samples were coated with gold using the ion-sputtering technique.For comprehending the surface morphology of GO in different environments, FE-SEM is an important technique. FE-SEM images of GO in different solvents in the absence as well as in the presence of NaFlu in different media are shown in Fig. S8 (ESI†) and Fig. 15 respectively. The images of GO in different media are almost the same, which explains there is no change in the GO surface morphology. We observe that in the presence as well as in the absence of NaFlu, the surface morphology of GO in different solvent mixtures undergoes no such appreciable change. In brief FE-SEM data illustrate no structural modifications GO undergoes both in the presence and in the absence of NaFlu in different solvent mixtures.
3.6 Fluorescence lifetime imaging microscopy (FLIM)
FLIM is a unique tool to comprehend the lifetime distribution of NaFlu with GO in the solid dried state. FLIM images were obtained using a DCS-120 laser scanning confocal microscope system of Becker and Hickl (GmbH) which is equipped with an inverted optical microscope of Zeiss, controlled by a galvo-drive unit (Becker and Hickl GDA-120). DCS-120 which is equipped with a polarizing beam splitter and a hybrid GaAsP photodetector was the detector. For all the systems, we have used a 40× objective (NA: 0.75) in the microscope. The IRF of the system is less than 100 ps. The FLIM study was performed to understand the lifetime distribution of NaFlu in the presence of GO in different solvent mixtures. FLIM images (Fig. S9, ESI†) of NaFlu in the presence of GO in solvent mixtures and their corresponding intensity images are shown in Fig. S9 (ESI†) and the lifetime data are shown in Table S4 (ESI†). From the obtained images and lifetime value data, it is clear that the NaFlu molecules are adsorbed on the GO surface, and the fluorescence lifetime data of NaFlu suggest that there is homogeneous distribution of NaFlu in GO in different solvent mixtures.4. Conclusions
In a nutshell, we have monitored the photophysical behavior of NaFlu molecules in the presence as well as in the absence of GO, in neat solvents and water–polar aprotic solvent binary mixtures. In water, on gradual addition of GO, the fluorescence intensity value of NaFlu decreases since GO acts as a quencher. However, on addition of ACN, DMF and DMSO to the NaFlu–GO system in water, the emission intensity increases. This is because polar aprotic solvents promote solvent induced aggregation of NaFlu in water, and thus AIE is very prominent since due to the aggregate formation there is a restriction in the intramolecular rotation of NaFlu molecules, and the chances of non-radiative relaxation pathways decrease which eventually leads to the AIE phenomenon. However, in the absence of GO and in the water–THF system (presence/absence of GO) NaFlu forms aggregates which leads to π–π coplanar interactions between NaFlu molecules leading to excimer formation that prefers to decay through nonradioactive pathways thus promoting the ACQ phenomenon. NaFlu molecules undergo dominant static quenching in the presence of GO with positive deviation from usual linear curvature. The adsorption of NaFlu in GO in water, ACN and DMSO is also reported in our work. The excitation spectra data also resonate with the steady state absorption data, i.e. justifies the form conversion of NaFlu molecules and the existence of different emissive states in the medium. To support the AIE and ACQ characteristics of NaFlu in different binary mixtures the ABQY value of NaFlu was determined in water as well as in binary mixtures both in the presence and in the absence of GO. In the presence of GO, the ABQY value of NaFlu increases when compared to that of the NaFlu–GO system in water, after addition of ACN, DMF, or DMSO to the mixture, showing aggregation-induced emission (AIE) characteristics. In the absence of GO, the ABQY value of NaFlu was decreased when compared to NaFlu in water, after addition of ACN, DMF, DMSO and THF to NaFlu in water, showing aggregation-caused quenching (ACQ) characteristics. The TRFE data also show that the rate of non-radiative transition decreases and thus the lifetime value of NaFlu in water–binary solvent mixtures increases. The Raman spectra, FESEM data and FLIM data also show that there is no change in the surface morphology of GO in water–binary solvent mixtures. In this work, NaFlu exhibits dual nature, i.e. ACQ and AIE in binary solvent mixtures. ACQ is observable in the absence of GO and AIE is observed in the presence of GO.Conflicts of interest
The authors declare no conflicts of interest.Acknowledgements
All the authors are thankful to the Indian Institute of Technology Patna, India for the research facilities. S. P. and S. B. are thankful to the Indian Institute of Technology Patna for the research fellowship.References
- P. D. McQueen, S. Sagoo, H. Yao and R. A. Jockusch, On the intrinsic photophysics of fluorescein, Angew. Chem., Int. Ed., 2010, 49, 9193–9196 CrossRef CAS PubMed.
- F. Naderi and A. Farajtabar, Solvatochromism of fluorescein in aqueous aprotic solvents, J. Mol. Liq., 2016, 221, 102–107 CrossRef CAS.
- A. M. Brouwer, Standards for photoluminescence quantum yield measurements in solution (IUPAC Technical Report), Pure Appl. Chem., 2011, 83, 2213–2228 CrossRef CAS.
- D. M. Al-Aqmar, H. I. Abdelkader and M. T. Abou Kana, Spectroscopic properties and amplified spontaneous emission of fluorescein laser dye in ionic liquids as green media, Opt. Mater., 2015, 47, 573–581 CrossRef CAS.
- J. Y. Jin, H. G. Kim, C. H. Hong, E. K. Suh and Y. S. Lee, White light emission from a blue LED, combined with a sodium salt of fluorescein dye, Synth. Met., 2007, 157, 138–141 CrossRef CAS.
- M. M. Abutalib, M. Shkir, I. S. Yahia, S. AlFaify, A. M. El-Naggar and V. Ganesh, Thickness dependent optical dispersion and nonlinear optical properties of nanocrystalline fluorescein dye thin films for optoelectronic applications, Optik, 2016, 127, 6601–6609 CrossRef CAS.
- K. Sasazawa, Y. Yamada, A. Fujisawa, T. Saitoh, K. Ueno, K. Oharu and H. Sawada, Preparation of self-assembled fluorinated molecular aggregates, fluorescein nanocomposites: an extremely enhanced light absorption in nanocomposites, Colloid Polym. Sci., 2005, 283, 812–816 CrossRef CAS.
- M. C. Rosu, R. C. Suciu, M. D. Lazar and I. Bratu, The influence of alizarin and fluorescein on the photoactivity of Ni, Pt and Ru-doped TiO2 layers, Mater. Sci. Eng., B, 2013, 178, 383–390 CrossRef CAS.
- W. A. Farooq, A. Fatehmulla, F. Yakuphanoglu, I. S. Yahia, S. M. Ali, M. Atif, M. Aslam and W. Tawfik, Photovoltaic characteristics of solar cells based on nanostructured titanium dioxide sensitized with fluorescein sodium salt, Theor. Exp. Chem., 2014, 50, 121–126 CrossRef CAS.
- R. Sasai and M. Morita, Luminous relative humidity sensing by anionic fluorescein dyes incorporated into layered double hydroxide/1-butanesulfonate hybrid materials, Sens. Actuators, B, 2017, 238, 702–705 CrossRef CAS.
- H. Wang, G. Zhou, C. Mao and X. Chen, A fluorescent sensor bearing nitroolefin moiety for the detection of thiols and its biological imaging, Dyes Pigm., 2013, 96, 232–236 CrossRef CAS.
- V. Patil, V. Padalkar and N. Sekar, Environment-sensitive benzoxazole based fluorescein derivatives: Synthesis and application to the design of ON–OFF fluorescent chemosensors for microenvironment, J. Lumin., 2015, 158, 243–251 CrossRef CAS.
- J. Murube, Fluorescein: Its use in investigation of lacrimal characteristics, Ocul. Surf., 2013, 4, 212–218 CrossRef PubMed.
- K. S. Novoselov, A. K. Geim, S. V. Morozov, D. E. Jiang, Y. Zhang, S. V. Dubonos, I. V. Grigorieva and A. A. Firsov, Electric field effect in atomically thin carbon films, Science, 2004, 306, 666–669 CrossRef CAS PubMed.
- V. C. Sanchez, A. Jachak, R. H. Hurt and A. B. Kane, Biological interactions of graphene-family nanomaterials: an interdisciplinary review, Chem. Res. Toxicol., 2012, 25, 15–34 Search PubMed.
- C. Bussy, H. Ali-Boucetta and K. Kostarelos, Safety considerations for graphene: lessons learnt from carbon nanotubes, Acc. Chem. Res., 2013, 46, 692–701 CrossRef CAS PubMed.
- P. Zhu, B. G. Sumpter and V. Meunier, Electronic, thermal, and structural properties of graphene oxide frameworks, J. Phys. Chem. C, 2013, 117, 8276–8281 CrossRef CAS.
- A. A. Balandin, Thermal properties of graphene and nanostructured carbon materials, Nat. Mater., 2011, 10, 569–581 CrossRef CAS PubMed.
- S. Stankovich, D. A. Dikin, R. D. Piner, K. A. Kohlhaas, A. Kleinhammes, Y. Jia, Y. Wu, S. T. Nguyen and R. S. Ruoff, Synthesis of graphene-based nanosheets via chemical reduction of exfoliated graphite oxide, Carbon, 2007, 45, 1558–1565 CrossRef CAS.
- G. Zhao, J. Li, X. Ren, C. Chen and X. Wang, Few-layered graphene oxide nanosheets as superior sorbents for heavy metal ion pollution management, Environ. Sci. Technol., 2011, 45, 10454–10462 CrossRef CAS PubMed.
- C. Chung, Y. K. Kim, D. Shin, S. R. Ryoo, B. H. Hong and D. H. Min, Biomedical applications of graphene and graphene oxide, Acc. Chem. Res., 2013, 46, 2211–2224 CrossRef CAS PubMed.
- V. Georgakilas, J. N. Tiwari, K. C. Kemp, J. A. Perman, A. B. Bourlinos, K. S. Kim and R. Zboril, Noncovalent functionalization of graphene and graphene oxide for energy materials, biosensing, catalytic, and biomedical applications, Chem. Rev., 2016, 116, 5464–5519 CrossRef CAS PubMed.
- Y. Yin, K. Hu, A. M. Grant, Y. Zhang and V. V. Tsukruk, Biopolymeric nanocomposites with enhanced interphases, Langmuir, 2015, 31, 10859–10870 CrossRef CAS PubMed.
- J. Zhang, L. Chen, B. Shen, L. Chen, J. Mo and J. Feng, Dual-sensitive graphene oxide loaded with proapoptotic peptides and anticancer drugs for cancer synergetic therapy, Langmuir, 2019, 35, 6120–6128 CrossRef CAS PubMed.
- H. Kim, R. Namgung, K. Singha, I. K. Oh and W. J. Kim, Graphene oxide–polyethylenimine nanoconstruct as a gene delivery vector and bioimaging tool, Bioconjugate Chem., 2011, 22, 2558–2567 CrossRef CAS PubMed.
- C. H. Lu, C. L. Zhu, J. Li, J. J. Liu, X. Chen and H. H. Yang, Using graphene to protect DNA from cleavage during cellular delivery, Chem. Commun., 2010, 46, 3116–3118 RSC.
- R. Sahoo, R. Jana and D. Seth, Photophysics of harmaline in solvent mixtures, J. Mol. Liq., 2019, 275, 84–90 CrossRef CAS.
- S. Roy, S. Banerjee, N. Biyani, B. Jana and B. Bagchi, Theoretical and computational analysis of static and dynamic anomalies in water− DMSO binary mixture at low DMSO concentrations. The, J. Phys. Chem. B, 2011, 115, 685–692 CrossRef CAS PubMed.
- J. B. Mills, C. T. Mant and R. S. Hodges, One-step purification of a recombinant protein from a whole cell extract by reversed-phase high-performance liquid chromatography, J. Chromatogr. A, 2006, 1133, 248–253 CrossRef CAS PubMed.
- U. D. Neue, HPLC columns. Theory, Technology, and Practice, 1997 Search PubMed.
- T. Welton and C. Reichardt, Solvents and solvent effects in organic chemistry, John Wiley & Sons, 2011 Search PubMed.
- S. S. N. Murthy, Some insight into the physical basis of the cryoprotective action of dimethyl sulfoxide and ethylene glycol, Cryobiology, 1998, 36, 84–96 CrossRef CAS PubMed.
- U. Taşdemir, S. Büyükleblebici, P. B. Tuncer, E. Coşkun, T. Özgürtaş, F. N. Aydın, O. Büyükleblebici and İ. S. Gürcan, Effects of various cryoprotectants on bull sperm quality, DNA integrity and oxidative stress parameters, Cryobiology, 2013, 66, 38–42 CrossRef PubMed.
- A. Bapli, R. K. Gautam, S. Seth, R. Jana, S. Pandit and D. Seth, Graphene oxide as an enhancer of fluorescence, Chem. – Asian J., 2020, 15, 1296–1300 CrossRef CAS PubMed.
- A. Bapli, R. Jana, S. Pandit and D. Seth, Selective prototropism of lumichrome in the liposome/graphene oxide interface: A detailed spectroscopic study, J. Mol. Liq., 2021, 339, 116738 CrossRef CAS.
- A. Bapli, S. Seth, S. Pandit and D. Seth, Graphene oxide-controlled neutral versus cationic form of a red emitting dye: enhancement of fluorescence by graphene oxide, Chem. Commun., 2021, 57, 11855–11858 RSC.
- S. Pandit, S. Seth, A. Bapli, S. Bhattacharjee and D. Seth, Graphene Oxide Induced Prototropism in Different Solvents: Enhancement of Fluorescence Induced by Graphene Oxide, J. Mol. Liq., 2023, 120880 CrossRef CAS.
- F. Naderi, A. Farajtabar and F. Gharib, Solvatochromic and preferential solvation of fluorescein in some water–alcoholic mixed solvents, J. Mol. Liq., 2014, 190, 126–132 CrossRef CAS.
- A. C. Morosanu, D. G. Dimitriu and D. O. Dorohoi, Excited state dipole moment of the fluorescein molecule estimated from electronic absorption spectra, J. Mol. Struct., 2019, 1180, 723–732 CrossRef CAS.
- S. De and R. Kundu, Spectroscopic studies with fluorescein dye—Protonation, aggregation and interaction with nanoparticles, J. Photochem. Photobiol., A, 2011, 223, 71–81 CrossRef CAS.
- R. Sjöback, J. Nygren and M. Kubista, Absorption and fluorescence properties of fluorescein, Spectrochim. Acta, Part A, 1995, 51, L7–L21 CrossRef.
- M. Anju, A. K. Akhila and N. K. Renuka, Non-covalently functionalised rGO–fluorescein unit for selective detection of fluoride ions, Nano-Struct. Nano-Objects, 2020, 24, 100606 CrossRef CAS.
- C. J. Shih, S. Lin, R. Sharma, M. S. Strano and D. Blankschtein, Understanding the pH-dependent behavior of graphene oxide aqueous solutions: a comparative experimental and molecular dynamics simulation study, Langmuir, 2012, 28, 235–241 CrossRef CAS PubMed.
- J. Kim, L. J. Cote, F. Kim, W. Yuan, K. R. Shull and J. Huang, Graphene oxide sheets at interfaces, J. Am. Chem. Soc., 2010, 132, 8180–8186 CrossRef CAS PubMed.
- Z. Liu, J. T. Robinson, X. Sun and H. Dai, PEGylated nanographene oxide for delivery of water-insoluble cancer drugs, J. Am. Chem. Soc., 2008, 130, 10876–10877 CrossRef CAS PubMed.
- J. S. Park, H. K. Na, D. H. Min and D. E. Kim, Desorption of single-stranded nucleic acids from graphene oxide by disruption of hydrogen bonding, Analyst, 2013, 138, 1745–1749 RSC.
- J. Kim, S. J. Park and D. H. Min, Emerging approaches for graphene oxide biosensor, Anal. Chem., 2017, 89, 232–248 CrossRef CAS PubMed.
- P. Mandal, M. Bardhan and T. Ganguly, A detailed spectroscopic study on the interaction of Rhodamine 6G with human hemoglobin, J. Photochem. Photobiol., B, 2010, 99, 78–86 CrossRef CAS PubMed.
- D. Li, M. B. Müller, S. Gilje, R. B. Kaner and G. G. Wallace, Processable aqueous dispersions of graphene nanosheets, Nat. Nanotechnol., 2008, 3, 101–105 CrossRef CAS PubMed.
- R. F. Delgadillo and L. J. Parkhurst, Spectroscopic properties of fluorescein and rhodamine dyes attached to DNA, Photochem. Photobiol., 2010, 86, 261–272 CrossRef CAS PubMed.
- X. F. Zhang, X. Cui, Q. Liu and F. Zhang, Multiple-Charge Separation in Nanoscale Artificial Photosynthetic Models, Chem. Phys. Chem., 2008, 9, 1514–1518 CrossRef CAS PubMed.
- X. F. Zhang, X. Cui, Q. Liu and F. Zhang, Photoinduced multi-electron transfer in the D n–A system consisting of multi-phthalocyanines linked to one carbon nanotube, Phys. Chem. Chem. Phys., 2009, 11, 3566–3572 RSC.
- E. Ciotta, P. Prosposito and R. Pizzoferrato, Positive curvature in Stern–Volmer plot described by a generalized model for static quenching, J. Lumin., 2019, 206, 518–522 CrossRef CAS.
- D. Peak, T. C. Werner, R. M. Dennin Jr and J. K. Baird, Fluorescence quenching at high quencher concentrations, J. Chem. Phys., 1983, 79, 3328–3335 CrossRef CAS.
- J. Keizer, Nonlinear fluorescence quenching and the origin of positive curvature in Stern–Volmer plots, J. Am. Chem. Soc., 1983, 105, 1494–1498 CrossRef CAS.
- D. K. Singh, P. K. Iyer and P. K. Giri, Role of molecular interactions and structural defects in the efficient fluorescence quenching by carbon nanotubes, Carbon, 2012, 50, 4495–4505 CrossRef CAS.
- J. Wang, D. Wang, E. K. Miller, D. Moses, G. C. Bazan and A. J. Heeger, Photoluminescence of water-soluble conjugated polymers: Origin of enhanced quenching by charge transfer, Macromolecules, 2000, 33, 5153–5158 CrossRef CAS.
- E. Ciotta, S. Paoloni, M. Richetta, P. Prosposito, P. Tagliatesta, C. Lorecchio, I. Venditti, I. Fratoddi, S. Casciardi and R. Pizzoferrato, Sensitivity to heavy-metal ions of unfolded fullerene quantum dots, Sensors, 2017, 17, 2614 CrossRef PubMed.
- K. Campbell, A. Zappas, U. Bunz, Y. S. Thio and D. G. Bucknall, Fluorescence quenching of a poly (para-phenylene ethynylenes) by C60 fullerenes, J. Photochem. Photobiol., A, 2012, 249, 41–46 CrossRef CAS.
- A. Paudics, S. Farah, I. Bertóti, A. Farkas, K. László, M. Mohai, G. Sáfrán, A. Szilágyi and M. Kubinyi, Fluorescence probing of binding sites on graphene oxide nanosheets with Oxazine 1 dye, Appl. Surf. Sci., 2021, 541, 148451 CrossRef CAS.
- D. Ding, K. Li, B. Liu and B. Z. Tang, Bioprobes based on AIE fluorogens, Acc. Chem. Res., 2013, 46, 2441–2453 CrossRef CAS PubMed.
- Z. He, C. Ke and B. Z. Tang, Journey of aggregation-induced emission research, ACS Omega, 2018, 3, 3267–3277 CrossRef CAS PubMed.
- N. Klonis, A. H. Clayton, E. W. Voss Jr and W. H. Sawyer, Spectral properties of fluorescein in solvent–water mixtures: applications as a probe of hydrogen bonding environments in biological systems, Photochem. Photobiol., 1998, 67, 500–510 CAS.
- B. Yang, H. Lang, Z. Liu, S. Wang, Z. Men and C. Sun, Three stages of hydrogen bonding network in DMF–water binary solution, J. Mol. Liq., 2021, 324, 114996 CrossRef CAS.
- M. Katayama and K. Ozutsumi, The number of water–water hydrogen bonds in water-tetrahydrofuran and water-acetone binary mixtures determined by means of X-ray scattering, J. Solution Chem., 2008, 37, 841–856 CrossRef CAS.
- L. C. G. Freitas and J. M. M. Cordeiro, Monte Carlo simulation of water-tetrahydrofuran mixtures, J. Mol. Struct.: THEOCHEM, 1995, 335(1–3), 189–195 CrossRef.
- S. Feng, S. Gong and G. Feng, Aggregation-induced emission and solid fluorescence of fluorescein derivatives, Chem. Commun., 2020, 56, 2511–2513 RSC.
- J. B. Wu, M. L. Lin, X. Cong, H. N. Liu and P. H. Tan, Raman spectroscopy of graphene-based materials and its applications in related devices, Chem. Soc. Rev., 2018, 47, 1822–1873 RSC.
- D. López-Díaz, M. Lopez Holgado, J. L. García-Fierro and M. M. Velázquez, Evolution of the Raman spectrum with the chemical composition of graphene oxide, J. Phys. Chem. C, 2017, 121, 20489–20497 CrossRef.
- A. C. Ferrari and J. Robertson, Interpretation of Raman spectra of disordered and amorphous carbon, Phys. Rev. B: Condens. Matter Mater. Phys., 2000, 61, 14095 CrossRef CAS.
- M. A. Pimenta, G. Dresselhaus, M. S. Dresselhaus, L. G. Cancado, A. Jorio and R. Saito, Studying disorder in graphite-based systems by Raman spectroscopy, Phys. Chem. Chem. Phys., 2007, 9, 1276–1290 RSC.
- J. I. Paredes, S. Villar-Rodil, P. Solís-Fernández, A. Martínez-Alonso and J. M. D. Tascon, Atomic force and scanning tunneling microscopy imaging of graphene nanosheets derived from graphite oxide, Langmuir, 2009, 25, 5957–5968 CrossRef CAS PubMed.
- Y. Zhou, Q. Bao, L. A. L. Tang, Y. Zhong and K. P. Loh, Hydrothermal dehydration for the “green” reduction of exfoliated graphene oxide to graphene and demonstration of tunable optical limiting properties, Chem. Mater., 2009, 21, 2950–2956 CrossRef CAS.
- S. Stankovich, D. A. Dikin, R. D. Piner, K. A. Kohlhaas, A. Kleinhammes, Y. Jia, Y. Wu, S. T. Nguyen and R. S. Ruoff, Synthesis of graphene-based nanosheets via chemical reduction of exfoliated graphite oxide, Carbon, 2007, 45, 1558–1565 CrossRef CAS.
- Y. Xu, H. Bai, G. Lu, C. Li and G. Shi, Flexible graphene films via the filtration of water-soluble noncovalent functionalized graphene sheets, J. Am. Chem. Soc., 2008, 130, 5856–5857 CrossRef CAS PubMed.
Footnote |
| † Electronic supplementary information (ESI) available: Absorption, emission, time-resolved emission, Raman spectra, FE-SEM, and FLIM images. See DOI: https://doi.org/10.1039/d3nj00995e |
| This journal is © The Royal Society of Chemistry and the Centre National de la Recherche Scientifique 2023 |

