Design and development of a porous nanorod-based nickel-metal–organic framework (Ni-MOF) for high-performance supercapacitor application
Rakhee
Bhosale
 ,
Sneha
Bhosale
,
Pramod
Kumbhar
,
Dattatray
Narale
,
Rachana
Ghaware
,
Chitra
Jambhale
,
Sneha
Bhosale
,
Pramod
Kumbhar
,
Dattatray
Narale
,
Rachana
Ghaware
,
Chitra
Jambhale
 and
Sanjay
Kolekar
 *
*
Analytical Chemistry and Materials Science Research Laboratory, Department of Chemistry, Shivaji University, Kolhapur 416 004, India. E-mail: sskolekar@gmail.com
First published on 6th March 2023
Abstract
Metal–organic frameworks have received increasing attention as promising electrode materials in supercapacitors. In this study, we synthesized a nickel-metal–organic framework (Ni-MOF) by a simple and low-cost reflux condensation technique using non-hazardous trimesic acid as an organic ligand. The structures and morphologies of the Ni-MOF material were characterized by X-ray diffraction, Fourier-transform infrared spectroscopy, and scanning electron microscopy techniques. The prepared Ni-MOF was found to have a rod-like morphology and these morphologies can provide beneficial paths for electrolyte ion penetration, obtaining an enlarged contact area between the active material and electrolyte. The Ni-MOF had a considerable specific surface area of 398.4 m2 g−1. Further, its highly porous structure offered excellent supercapacitor performance. The charge-storage mechanism of the electrodes was investigated by cyclic voltammetry, charge–discharge cycling, and electrochemical impedance spectroscopy using 2 M KOH as an electrolyte in a three-electrode assembly. The specific capacitance of the Ni-MOF was found to be 1956.3 F g−1 at a current density of 5 mA cm−2 by GCD studies and it retained 81.13% of its initial capacitance even after 3000 GCD cycles at a 35 mA cm−2 current density. An as-fabricated Ni-MOF//activated carbon hybrid supercapacitor (HSC) exhibited a specific energy of 98.15 W h kg−1 at a specific power of 1253.47 W kg−1 and excellent capacity retention of 99.29% over 3000 cycles. The results of this study imply a great potential of the Ni-MOF for application in efficient and sustainable energy-storage devices.
Introduction
In the 21st century, the production of energy from different sources has tremendously increased, and its transformation is also increasing day by day in different ways with the ever-increasing demands from industry, buildings, utilities, and transportation.1 The increasing demand for energy and fuel due to the ever-increasing world population has become one of the important worries for all the global prime economies. Today there is an urgent need for environmentally friendly renewable energy resources to solve the problems related to the dwindling reserves of fossil fuels.2,3 In this regard, energy-conversion and -storage technologies have acquired significant attention to support the future use of renewable energy sources. Many researchers from around the globe are devoted to developing sustainable energy sources, like wind, solar, hydropower, and tidal energy, to address the shortage of fossil fuels and to reduce carbon emissions and global warming. Hence, from various points of view, electrochemical energy-storage devices (EESDs), like rechargeable batteries, supercapacitors, fuel cells, and hybrid devices, have an important part to play in strategies to produce various amounts of energy and power density to meet the demands from different application scenarios.4–6Supercapacitors (SCs), also known as electrochemical capacitors, offer the advantages of batteries as well as conventional capacitors, and have consequently become extraordinary energy-storage devices for large power output applications.7,8 SCs generally offer a fast charging–discharging process (1–10 s), large power density (500–10![[thin space (1/6-em)]](https://www.rsc.org/images/entities/char_2009.gif) 000 W kg−1), high cycling stability (>500
000 W kg−1), high cycling stability (>500![[thin space (1/6-em)]](https://www.rsc.org/images/entities/char_2009.gif) 000 h), and easy operation. However, current SCs have a low energy density (1–10 W h kg−1), which remains a prime challenge in the development of SC technologies. To conquer the drawback of their low energy density, there is a need for the development of high-performance electrode materials for SCs.9,10 Due to their profitable features, such as high power density, excellent cycling stability, exceptional rate capability, and eco-friendliness, SCs have become key components in many fields, such as aerospace, electronic communications, and electric transport, and thus have attracted increasing attention, but still, there is a need for further advancements in SCs to meet the excessive energy demand of modern society.11 A supercapacitor is like a battery, which means it stores and releases electricity, but instead of storing energy in the form of chemicals, supercapacitors store electricity in a static state, making them better at rapidly charging and discharging energy. Supercapacitors can be mainly divided into two types based on the charge-storage mechanism. The first type is electric double-layer supercapacitors (EDLCs). In EDLCs, the capacitance is obtained from the electrostatic charge assembled at the electrode/electrolyte interface; hence, it is completely dependent on the surface area of the electrode materials that is available to electrolyte ions. The other type is pseudocapacitors, in which the capacitance comes from the reversible redox reactions between the electrolyte and electroactive species on the surface of the electrodes under the applied potential.12–14 The electrochemical performance of a supercapacitor device depends on numerous parameters, like choosing its constituents, the synthesis route used for the electrode materials, the potential window of the electrodes, the choice of electrolytes, and the type of current collectors, binders, and separators.15,16
000 h), and easy operation. However, current SCs have a low energy density (1–10 W h kg−1), which remains a prime challenge in the development of SC technologies. To conquer the drawback of their low energy density, there is a need for the development of high-performance electrode materials for SCs.9,10 Due to their profitable features, such as high power density, excellent cycling stability, exceptional rate capability, and eco-friendliness, SCs have become key components in many fields, such as aerospace, electronic communications, and electric transport, and thus have attracted increasing attention, but still, there is a need for further advancements in SCs to meet the excessive energy demand of modern society.11 A supercapacitor is like a battery, which means it stores and releases electricity, but instead of storing energy in the form of chemicals, supercapacitors store electricity in a static state, making them better at rapidly charging and discharging energy. Supercapacitors can be mainly divided into two types based on the charge-storage mechanism. The first type is electric double-layer supercapacitors (EDLCs). In EDLCs, the capacitance is obtained from the electrostatic charge assembled at the electrode/electrolyte interface; hence, it is completely dependent on the surface area of the electrode materials that is available to electrolyte ions. The other type is pseudocapacitors, in which the capacitance comes from the reversible redox reactions between the electrolyte and electroactive species on the surface of the electrodes under the applied potential.12–14 The electrochemical performance of a supercapacitor device depends on numerous parameters, like choosing its constituents, the synthesis route used for the electrode materials, the potential window of the electrodes, the choice of electrolytes, and the type of current collectors, binders, and separators.15,16
Metal–organic frameworks (MOFs) are attractive materials to fulfil the requirement for next-generation energy-storage technologies because of their extraordinary properties, such as high porosity, many accessible active sites, high surface area, extraordinary stability, vast structural and chemical tunability, tailorable pore size, and pre-and post-synthesis structural modifiability. Also, MOFs are a unique type of nanoporous materials formed by coordinated metal nodes and organic linkers. MOF-based materials have been utilized in many applications, including energy storage and conversion, catalysis, gas separation, drug delivery, hydrogen storage, gas adsorption, and purification.17–20 Concurrently, due to the strong coordination capability of transition metals (TMs), TMs are often used as the metal centres of MOFs, and they also offer the advantages of possessing variable valences and good electrochemical properties, which means they can work as pseudocapacitive redox centres.21 MOFs can be feasibly included in a supercapacitor by two strategies: by directly utilizing the MOF as an electrode material for supercapacitors or by utilizing MOF-derived materials, like nanoporous carbon, oxides, sulfides, ferrites, which can be evolved and then utilized as electrode materials, such as the Ni, Co, Zn, Cu, and Fe-based MOFs, which have been reported previously to possess good supercapacitive performance.22–31 However, the current, MOFs show poor electrical conductivity; therefore, scientists have taken efforts to increase the electrical conductivity through different strategies, such as through developing composite MOFs with different conductive materials, like metal oxides,32 metals,33 conductive polymers,34 carbon nanotubes,35 and graphene.36 Wang et al. proposed a surfactant-free and solvent-assisted solvothermal method to synthesize microflower Ni-MOF, which exhibited a high specific capacitance of 1093 F g−1 at 1 A g−1 with good rate capability, which were attributed to the fast ion transport and low electrical resistance emerging from its microflower-like structure and the specific capacitance resulting from the incorporation of nickel hydroxide species.37 Wu et al. investigated nanosheet-stacked flower-like Ni-MOF via a solvothermal method using anionic surfactants. The usage of the static sealing effect among the negatively charged anionic surfactant head groups and metal ions suppressed the growth of crystals on the crystal surface. Their study revealed that the electrochemical performance of Ni-MOF with the surfactant was superior to that of Ni-MOF without the surfactant, whereby it possessed a specific capacitance of 1030 F g−1 at a current density of 1 A g−1 with a capacitance retention of 50% after even 3000 cycles. Further, they assembled an asymmetric supercapacitor by using Ni-MOF as a positive electrode and activated carbon as a negative electrode.38 Gao et al. reported the cuboid Ni-MOF by a simple one-step hydrothermal method, which showed a loosely stacked layer-cuboid structure with plentiful mesopores, which were useful for the charge transfer and ion transport for supercapacitors. It also exhibited an exceptional specific capacitance of 804 F g−1 at a current density of 1 A g−1, with a retention of 302 F g−1 after 5000 cycles. Additionally, they fabricated an asymmetric supercapacitor using Ni-MOF and activated carbon as the positive and negative electrodes, respectively.39 Zhang et al. prepared Ni-MOF using a mixed-ligand approach, using trimesic acid as a modulator to partially replace the terephthalic acid. Replacing the terephthalic acid with trimesic acid influenced the formation of an albizia flower-like spheres@nanosheets structure, which helped the adsorption of OH− ions on the surface. Also, the electrochemical performance was increased due to the synergistic effect of the surface property and its unique structure. It exhibited an excellent specific capacitance of 920 F g−1 at a current density of 1 A g−1. In addition, they constructed an asymmetric supercapacitor with the help of Ni-MOF as a positive electrode and activated carbon as a negative electrode, which showed a high energy density of 42.4 W h kg−1 at a power density of 0.8 kW kg−1.40
In the present work, we used an unprecedented simple and scalable method, i.e. a reflux condensation method, to prepare a nanorod-like nickel-based metal–organic framework (Ni-MOF), in a controlled high temperature. The as-synthesized Ni-MOF revealed a one-dimensional (1D) nanorod-like morphology with a high specific surface area 398.4 m2 g−1 and highly nanoporous structure, which could produce more electrochemical sites, which increased the consumption of the electroactive material. In addition, for the fabrication of the electrode we used a stainless steel mesh substrate, which has not been reported to date, which is easily available and low cost compared to other reported substrates. Because of the abundant active sites and extremely porous nature of the material, the penetration of electrolyte ions into the material was increased, resulting in an enhancement of the specific capacitance of the material. Also, we constructed a handmade asymmetric supercapacitor device, which could get a red LED to glow for almost 105 s after charging for only 15 s.
Experimental section
Reagents
Nickel nitrate hexahydrate, N,N-dimethylformamide (DMF), and potassium hydroxide (KOH) were purchased from Loba Chemie (India). Benzene-1,3,5-tricarboxylic acid (H3BTC), carbon black, polyvinylidene difluoride (PVDF), and N-methyl-2-pyrrolidone (NMP) were purchased from Sigma Aldrich (USA). All the reagents were of analytical grade and used as received without any further purification.Preparation of nickel-based metal–organic framework (Ni-MOF)
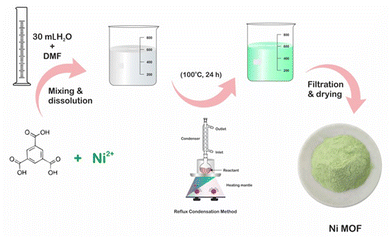
Ni-MOF was synthesized by a method reported elsewhere41 with slight modification. The reflux method was used for the synthesis of Ni-MOF, which also helped to lower the reaction time of Ni-MOF compared to that reported in the literature. First, 0.15 M of H3BTC was dissolved in 10 mL of DMF with continuous stirring at room temperature; this mixture was denoted as H3BTC solution. Then, the H3BTC solution was transferred to a 50 mL round-bottom flask and heated up to 100 °C using an oil bath with constant stirring. Thereafter, 0.3 M aqueous nickel nitrate (20 mL) solution was added drop by drop into the H3BTC solution. The reaction mixture was stirred for 24 h at 100 °C. After cooling, the resulting precipitate was washed with alcohol several times and finally, a pale-green coloured precipitate was obtained and then dried at 80 °C for 12 h. Fig. 1 shows a schematic of the preparation of the Ni-MOF.Material characterization
The phase and crystallinity of the Ni-MOF sample were investigated by X-ray diffractometry (XRD) (Bruker D8 Phaser X-ray diffractometer) with Cu Kα radiation (λ = 1.541 Å). The functional groups and types of bonding were confirmed by Fourier-transform infrared (FT-IR) spectroscopy (Bruker Alpha-100508 spectrometer) and the microstructure and surface topography of the Ni-MOF sample were studied by scanning electron microscopy (SEM, JEOL-JSM 6360, Japan). Raman spectroscopy (Lab RAM HR Evolution Confocal Raman Microscope, France) was used for the point group analysis. The chemical composition and elemental valence states of the as-prepared Ni-MOF were evaluated by X-ray photoelectron spectroscopy (XPS, JPS 9030, JEOL ASIA PTE LTD.). In addition, N2 isotherms and pore-size distribution data were collected using a surface area and pore volume analyzer (NOVA1000e Quantachrome, USA).Evaluation of the electrode materials and electrochemical studies
All the electrochemical experiments were performed on a CHI608 electrochemical analyzer using a conventional three-electrode system in 2 M KOH electrolyte at room temperature, with graphite employed as the counter electrode, saturated Ag/AgCl as the reference electrode, and Ni-MOF loaded stainless steel mesh as the working electrode. The working electrode was prepared by making a slurry of 80 wt% Ni-MOF (active material), 10 wt% polyvinylidene fluoride (PVDF), and 10 wt% carbon black (Super P) in NMP solvent. This slurry was coated on the stainless steel mesh (1 cm × 1 cm), followed by vacuum drying at 80 °C for 12 h.The electrochemical tests included cyclic voltammetry (CV), galvanostatic charging–discharging (GCD) profiles, and electrochemical impedance spectroscopy (EIS) measurements. A solid-state hybrid supercapacitor (Ni-MOF//AC) was fabricated using Ni-MOF as the positive electrode and activated carbon as the negative electrode. As a separator, cellulose filter paper was used as a sandwich between two electrodes, with the separator and PVA-KOH gel loaded between the two electrodes and assembled on opposite sides. The device was kept at room temperature overnight for natural drying. The PVA-KOH gel electrolyte was prepared according to a literature report.42 In a typical procedure, 1 g of polyvinyl alcohol (PVA) was dissolved in 20 mL distilled water keeping the temperature of the bath solution at 80 °C for 30 min. The aqueous KOH solution was then added dropwise to the PVA solution and heated at 80 °C for 30 min to give a viscous gel electrolyte.
The specific capacitance was calculated according to eqn (1),
 | (1) |
Using eqn (2) and (3), the specific energy and specific power of the hybrid supercapacitor were calculated, respectively,43
 | (2) |
 | (3) |
Results and discussion
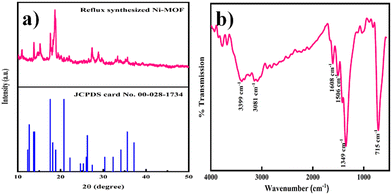
The phase purity and crystallinity of the Ni-MOF sample were investigated by XRD. The obtained XRD pattern of the prepared Ni-MOF together with the data of JCPDS card no. 00-028-1734 are shown in Fig. 2(a). The prepared Ni-MOF data were in close agreement with the given JCPDS card,44–46 revealing that the Ni-MOF had a polycrystalline nature. Some of the major peaks obtained were in good agreement with the corresponding angles as reported earlier for Ni-MOF. Furthermore, using Debye–Scherrer's formula (eqn (4)), the crystallite size was calculated for the major characteristic peak of Ni-MOF, | (4) |
Investigation of the chemical structure and functional groups of Ni-MOF was carried out by FT-IR. The FT-IR spectrum of the Ni-MOF sample is shown in Fig. 2(b). In the spectrum, the strong absorption peak at 1349 cm−1 was assigned to the C–H stretching vibrations, while the peaks at 3081 and 3399 cm−1 could be indexed to the O–H stretching vibrations of water molecules, showing that water molecules existed within the Ni-MOF structure. Additionally, the peaks observed at 1506 and 1608 cm−1 were attributed to the symmetric and asymmetric vibrations of carboxyl groups (–COO−), related to the BTC linkers.47,48 Another intense peak was observed at 715 cm−1, confirming the presence of the Ni–O bond.
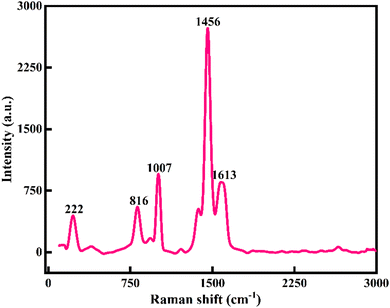
Raman spectroscopy was used to confirm the crystallography of the prepared Ni-MOF samples. Also, the inelastic scattering of the Ni-MOF samples was confirmed by Raman spectroscopy. The Raman spectrum of the Ni-MOF and the specified peaks of the prepared sample are shown in Fig. 3. The peaks of Ni-MOF at 816 and 1007 cm−1 could be associated to the plane deformation of the C–H in the aromatic ring and C–O stretching of the trimesic ligand, respectively. Also, D and G bands were observed at 1456 and 1613 cm−1 due to the in-plane vibration mode of the benzene ring.49 The peak at 222 cm−1 could be attributed to H–O–H. All these peaks revealed the crystallography and structure of the Ni-MOF sample.
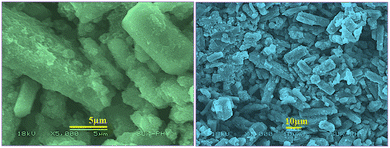
The surface morphology of the Ni-MOF was investigated by SEM, and the SEM images of Ni-MOF with different magnifications are shown in Fig. 4. The SEM images showed a nanorod-like morphology and porous nature of the Ni-MOF, which was responsible for the increased surface area of the Ni-MOF and also for the increase in the specific capacitance. The average length of the nanorods was about 19.09 nm.
The different lengths and diameters of the nanorods indicated an increase in the aspect ratio of the nanorods. Also, the porous nanorods were interconnected to each other, which provides more active sites for the transportation of the charging kinetics and decreases the diffusion length of the electrolyte, which is helpful for improvement of the energy storage and high rate capability. Again, a birds-eye view of the SEM images showed that the small and large sized nanorods overlapped with each other and between these two nanorods there were some voids, which in turn would support the enhanced adsorption of electrolyte ions, which would help to increase the specific capacitance of the Ni-MOF. The porous and 1D morphology was favourable for ion diffusion and hence contributed to an increase in the specific capacitance of the Ni-MOF.
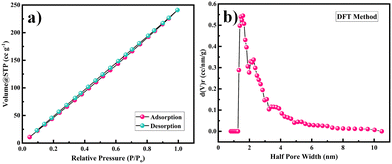
The surface area and porosity of the Ni-MOF were obtained by using the BET technique and measuring nitrogen adsorption–desorption isotherm of the samples at 77 K. Here, the prepared sample was degassed at 150 °C under a nitrogen atmosphere for 4 h before the measurements. The surface area and pore-size distribution of the sample were calculated by the Brunauer–Emmett–Teller (BET) equation and NLDFT method. The BET measurement results are presented in Fig. 5. The calculated surface area of the Ni-MOF sample was found to be 398.4 m2 g−1. Based on the literature, it has been observed that the larger the pore radius, then the higher porosity a sample will show in nature. Also, the pore-size distribution for Ni-MOF was estimated using the NLDFT method to establish the correct distribution of pores in the material, as shown in Fig. 5(c).50,51 The half pore width measured by DFT was 1.585 nm, with a micropore volume of 0.831 cc g−1, confirming the extremely mesoporous nature and hierarchical pore-size distribution. According to the literature, Ni-MOF shows a type II isotherm with plenty of mesopores in the material.52 This massive amount of mesopores in the structure boosts the permeation of electrolyte ions into the electrode, hence increasing the specific capacitance of the material. Such a high specific surface area and mesoporous structure could produce more electrochemical reaction sites, which increases the consumption of the electroactive material.
XPS was used to examine the surface elemental composition and valence states of Ni-MOF. The presence of Ni, C, and O elements was confirmed by the survey spectrum in Fig. 6(a). Ni 2p1/2 and 2p3/2 displayed two significant peaks at 873.6 and 856.2 eV, respectively, with two satellite peaks at 878.7 and 861.0 eV, implying the presence of Ni in a divalent state (Fig. 6(b)). The peak at 284.5 eV in the C 1s area (Fig. 6(c)) is a typical outcome for specimens charging using C 1s as the reference. The peak at 288.2 eV was associated with the O![[double bond, length as m-dash]](https://www.rsc.org/images/entities/char_e001.gif) C–OH, whereas the peak at 285.4 eV was associated with the aryl carbon from the benzene ring. The spectrum of O 1s (Fig. 6(d)) could be separated into two peaks. Carbonyl displayed a peak at 531.5 eV, and the –OH group from the adsorbed H2O molecules had a peak at 532.8 eV.53,54
C–OH, whereas the peak at 285.4 eV was associated with the aryl carbon from the benzene ring. The spectrum of O 1s (Fig. 6(d)) could be separated into two peaks. Carbonyl displayed a peak at 531.5 eV, and the –OH group from the adsorbed H2O molecules had a peak at 532.8 eV.53,54
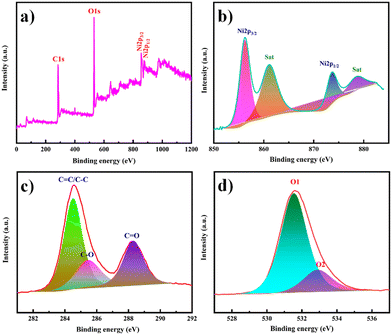 | ||
| Fig. 6 (a) XPS survey spectrum of Ni-MOF. High-resolution XPS spectra in the (b) Ni 2p, (c) C 1s and (d) O 1s regions. | ||
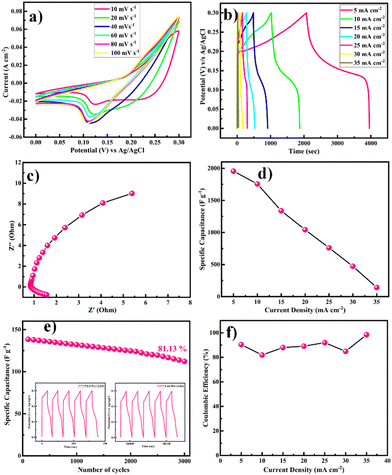
The electrochemical performance of the as-prepared Ni-MOF electrode was evaluated by using the three-electrode system in 2 M KOH electrolyte and the results are presented in Fig. 7. As shown in Fig. 7(a), cyclic voltammetry (CV) was carried out in the potential range from 0 to 0.3 V at scan rates from 10 to 100 mV s−1. It could be observed that the area under the CV curve of the Ni-MOF electrode was higher and the redox current density also increased, leading to a greater capacitive behaviour compared to the literature (Table 1). All the CV curves revealed well-defined redox pairs, which specified the change in the oxidation states of the Ni2+/Ni3+, redox reactions, and intercalation–deintercalation of the K+ ion in the porous structure during the electrochemical reactions, due to the pseudocapacitive behaviour of the prepared Ni-MOF.55,56 This could be due to a shift in the valence states of nickel ions, specifying that the pseudocapacitance was mostly driven by surface oxidation generated by the reduction reaction. Additionally, the diffusion of OH− ions also contributed to the redox reaction, and the diffusion might be because of the impurity ions in the aqueous electrolyte. The redox peaks of Ni-MOF in aqueous electrolytes were caused by the reversible redox between Ni2+/Ni3+, and the reaction can be explained by the possible charge–discharge mechanism of Ni-MOF as follows,
| Ni(II)s + OH− ↔ Ni(II)(OH)ad + e− |
| Ni(II)(OH)ad + OH− ↔ Ni(III)(OH)ad + e− |
| Electrode material | Substrate used | Electrolyte | Current density | Specific capacitance | Ref. |
|---|---|---|---|---|---|
| Ni-MOF | Nickel foam | 3 M KOH | 5 A g−1 | 1224.6 F g−1 | 58 |
| Ni-MOF | Nickel foam | 3 M KOH | 5 A g−1 | 612.25 F g−1 | 59 |
| Ni-MOF | Nickel foam | 6 M KOH | 5 A g−1 | 430 C g−1 | 60 |
| Ni-MOF | Nickel foam | 3 M KOH | 5 A g−1 | 95 F g−1 | 61 |
| Ni-MOF | Platinum plate | 2 M KOH | 5 mA cm−2 | 47 F g−1 | 62 |
| Ni-MOF | Stainless steel mesh | 2 M KOH | 5 mA cm−2 | 1956.3 F g−1 | This work |
With increasing the scanning speed, the curve area and peak current rose, demonstrating a good capacitive behaviour and charge-storage capabilities.
The equivalent and similar CV curves obtained at different scan rates showed a shift in the redox peaks and specified the pseudocapacitive behaviour of the material, as shown in Fig. 7(a). The area under the CV curve increased with the increase in the scan rate, whereas the specific capacitance decreased as the scan rate increased. This is due to the fact that at slower scan rates, electrolyte ions are completely diffused within the electrode material. As a result, the complete active surface of the electrode material can be used to store charge. At higher scan rates, however, diffusion restricts the movement of electrolyte ions, and only the outer active surface is employed for charge storage.57 The outstanding performance of the Ni-MOF electrode could be assigned to the good crystallinity and porous nanorod-like structure, which could successfully boost the intercalation/deintercalation of OH− ions within the Ni-MOF electrode. One of the important tools for assessing the electrochemical properties of an electrode is the charge–discharge measurement. Fig. 7(b) presents the charge–discharge curves of the Ni-MOF electrode in aqueous 2 M KOH electrolyte. The charging and discharging times were directly in tune with the charge-storage capacity of the active material. The impact of different current densities (5–35 mA cm−2) on the charge–discharge curve was also studied. The natures of the curves were identical to each other, which supported the pseudocapacitive properties of the Ni-MOF nanorods. The specific capacitance of the Ni-MOF was calculated using the discharging curve and eqn (1).
A maximum specific capacitance of 1956.3 F g−1 at a 5 mA cm−2 current density was obtained. This specific capacitance value is higher than those reported earlier (Table 1). Due to the plentiful active sites and highly porous nature, the penetration of electrolyte ions into the material increased, which supported the enhancement of the specific capacitance of the material. One of the important factors for supercapacitor electrodes is the electrical resistance, which can be determined from electrochemical impedance spectroscopy (EIS) measurements. EIS tests were thus carried out to investigate the electroconductibility and reaction kinetics of the Ni-MOF electrode, as shown in Fig. 7(c). The electrode's charge-transfer resistance (Rct) could be obtained from the diameter of a semicircle in the high-frequency area. It was demonstrated that the Ni-MOF had a small diameter and thus a smaller charge-transfer resistance, while the slope of the lines in the low-frequency area represents the ion-diffusion resistance. The Nyquist plot had a high slope, which showed that the as-prepared Ni-MOF was beneficial to ion transport and electrolyte diffusion because of its typical structure, which meant it possessed a high specific surface area and could support rich ion transportation. The straight line in the low-frequency region was due to Warburg resistance. Based on the preceding results, it can be concluded that the Ni-MOF had a higher conductivity. Hence, the smaller charge-transfer resistance (0.5 Ω) confirmed that the prepared Ni-MOF porous nanorods had highly pseudocapacitive properties. The specific capacitance decreased from 1756.3, 1338.4, 1043.8, 761.5, 473.8, and 142.2 F g−1 with the increase in the current density to 10, 15, 20, 25, 30, and 35 mA cm−2, respectively, as shown in Fig. 7(d). The specific capacitance decreased as the current density increased because at higher current density the electrolyte ions participate in the bulk surface for the electrochemical reaction, and due to this there is a restriction in the ion transport, so the value of the specific capacitance decreases, and considering the low current density, the electrolyte ions have enough time to move across the inner pores of the electrode material, resulting in a higher specific capacitance value. The Ni-MOF showed a longer discharging time, which clearly indicated that the porous nanorods structure of the Ni-MOF possessed more surface active sites for the efficient charge–discharge process and increased the energy-storage ability of the Ni-MOF electrode. The cyclic stability of the electrode was explored by galvanostatic charge–discharge (GCD) persistence tests at 35 mA cm−2 current density for 3000 cycles, as shown in Fig. 7(e). It could be seen that the specific capacitance was retained at over 81.13% after 3000 cycles for the Ni-MOF electrode, which suggested its good electrochemical reversibility during the charge–discharge process.
The Coulombic efficiency (η%), another important parameter to examine the interfacial stability of Ni-MOF electrode as a function of charge–discharge cycles, is shown in Fig. 7(f). Eqn (5) was used to calculate the Coulombic efficiency for the Ni-MOF electrode at different current densities,63
 | (5) |
The Coulombic efficiencies of the Ni-MOF electrode were 90.37%, 81.92%, 87.98%, 89.11%, 92.00%, 84.88%, and 98.45% at different current densities of 5, 10, 15, 20, 25, 30, and 35 mA cm−2, respectively. The Coulombic efficiency of the Ni-MOF electrode rose and the specific capacitance decreased with the increase in current density, which might be assigned to the electrodes inner active sites, which were not capable of supporting the redox reactions at high current density.
A promising electrochemical stability and excellent reversibility of Ni-MOF electrodes were observed for up to the 3000 GCD cycles. The Ni-MOF samples showed that the orchestrating effects of the 1D morphology, surface area, and porosity led to their excellent application potential in terms of specific capacitance, energy density, power density, and cyclic stability.
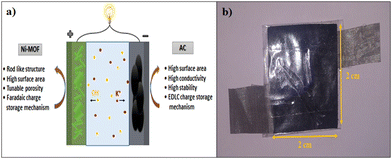
To understand the practical ability of the Ni-MOF electrode in functional devices, a hybrid supercapacitor device was assembled using the as-prepared Ni-MOF as a positive electrode and activated carbon as the negative electrode, as shown in Fig. 8. Both electrodes were prepared by the slurry coating method. In short, the slurry was prepared by mixing the active material (Ni-MOF or AC) (80 mg), polyvinylidene fluoride (10 mg), and carbon black (10 mg) in 0.5 mL of methyl-2-pyrrolidone (NMP) solvent. Then, the required volume of the slurry was dispersed onto a stainless steel mesh with an area of 2 cm × 2 cm and dried at 60 °C overnight. Primarily, the side borders of the electrodes were formed as non-conducting through insertion of a band to avoid electrical contact. The PVA-KOH gel was pasted on one side of the electrodes and created one side of the electrical contact. Later, both electrodes were patched together like a sandwich, with the gel-pasted sides facing each other. The fabricated device was kept under 1 ton pressure for 12 h, to acquire a good connection within the electrodes and gel electrolyte and also to remove the air gap. Afterwards, the device was used for assessment of the electrochemical performance. Hybrid supercapacitor devices have advantages, like high energy density, high specific capacitance, long cycle stability, and large potential window, over symmetric supercapacitors. The performance of the assembled hybrid device was studied using CV, GCD, and EIS measurements.
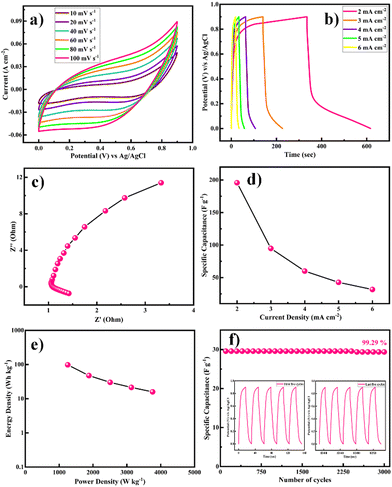
Primarily, CV tests were performed to understand the electrochemical performance of the Ni-MOF//AC hybrid supercapacitor (HSC) at different scan rates, as shown in Fig. 9(a). The Ni-MOF//AC hybrid SC exhibited a symmetric rectangular CV curve and a large area enclosed under the CV curve at up to 0–0.9 V. With the increase in scan rate from 10 to 100 mV s−1, the increase in area under the CV curves revealed the excellent reversibility of the Ni-MOF. Additionally, GCD curves were obtained at different current densities from the hybrid device, indicating the ideal capacitive behaviour of the device, as shown in Fig. 8(b). The Nyquist plots of the Ni-MOF//AC HSC device are shown in Fig. 9(c), indicating that the fabricated device had an Rct value of 0.36 Ω. According to the EIS studies, the fabricated Ni-MOF//AC HSC device had good electrical conductivity with a low ionic resistance. However, the specific capacitance decreased from 195.76, 94.79, 60.0, 42.70, and 31.67 F g−1 with the increase in the current density from 2, 3, 4, 5, and 6 mA cm−2, respectively, as shown in Fig. 9(d). The Ragone plot of the as-constructed HSC, expressing the relationship between the energy density (E) and power density (P), was obtained based on the galvanostatic charge–discharge curves (Fig. 9(e)). The cycling stability of the assembled hybrid supercapacitor device was investigated systematically. The device showed 99.29% capacitance retention over 3000 cycles, indicating its excellent cycle stability. The specific capacitance was constant over 2500 cycles and later it slightly decreased. The insets of Fig. 9(f) show the first and last five charge–discharge cycles of the device in 2 M KOH electrolyte. The Coulombic efficiencies of the asymmetric supercapacitor device were 84.15%, 65.00%, 68.57%, 74.54%, and 80.00% at various current densities of 2, 3, 4, 5, and 6 mA cm−2, respectively (eqn (5)).
The device's energy density and power density were calculated using eqn (2) and (3). The HSC device exhibited a maximum energy density of 79.5 W h kg−1 at a higher power density of 1015.3 W kg−1, which was comparable to or even higher than recent literature values (Table 1) for hybrid supercapacitors.
The fabricated device could light a red-light-emitting diode (LED) for over 105 s when charged for 15 s due to the device's high energy density and maximum operational potential of 0.9 V, as shown in Fig. 10. It can be seen that the dazzling light was obvious at first, and then the brightness change is shown over time. After 105 s, we can see that the red light was still faintly glowing, confirming that the Ni-MOF//AC HSC device had an amazing ability to store charge. The good performance could be attributed to Ni-MOF's rod-like structure and pore-size distribution. The study discovered that the encouraging results may pave the way for the development of new electrode materials for supercapacitors and other energy-storage devices.
 | ||
| Fig. 10 The handmade asymmetric supercapacitor device was charged for 15 s and caused a red LED to glow for almost 105 s (i.e. charging time 15 s and discharging time 105 s). | ||
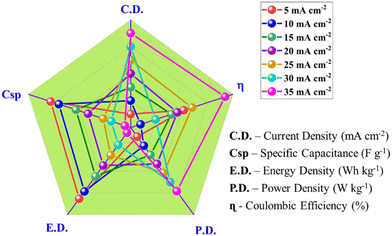
The study of the electrochemical parameters at different current densities of the chemically synthesized Ni-MOF is concluded in the radar graph shown in Fig. 11. The different apexes reveal the various parameters, such as specific capacitance, energy density, power density, and Coulombic efficiency, of the Ni-MOF. As seen in Fig. 11, this report contains the script for the Ni-MOF-based supercapacitor. These results indicate that the Ni-MOF has much better electrochemical performance than that of other reported MOFs due to its high specific capacitance, high energy density, large power density, and good Coulombic efficiency.
Conclusions
In summary, we successfully prepared Ni-MOF by using the reflux condensation technique. The structural properties and electrochemical performance of the Ni-MOF were studied systematically using various advanced tools. The porous and nanorod-like morphology, as confirmed by SEM analysis, provided both faster and more electroactive sites. An as-prepared Ni-MOF sample exhibited a high surface area of 398.4 m2 g−1. Furthermore, In a three-electrode system with 2 M KOH aqueous electrolyte, the synthesized Ni-MOF porous nanorods showed a high specific capacitance of 1956.3 F g−1 at a current density of 5 mA cm−2, and more stability for 3000 cycles with 81.13% retention. When assessed as a positive electrode for a flexible hybrid supercapacitor (HSC) device in combination with activated carbon as a negative electrode, the HSC cell exhibited a superhigh electrochemical behaviour. The device also exhibited a high charge-storage capacity of 195.76 F g−1 at a current density of 2 mA cm−2, super-specific energy (98.15 W h kg−1), and excellent power density (1253.47 W kg−1), including long-term stability of 3000 cycles with 99.29% capacity retention. The extraordinary energy-storage properties of the Ni-MOF electrode are attributed to its nanorod-like structure and higher surface area. This study provides a new platform for supercapacitors and other energy-storage devices.Author contributions
Rakhee Bhosale: formal analysis, investigation, methodology and writing original draft; Sneha Bhosale: data curation; Pramod Kumbhar: visualisation; dattatray Narale: validation and methodology; Rachana Ghaware: discussions and review; Chitra Jambhale: editing of the draft; Sanjay Kolekar: conceptualization, supervision and funding acquisition.Conflicts of interest
There are no conflicts to declare.Acknowledgements
The authors are thankful to UGC-SAP, DST-FIST and DST-PURSE for the financial support and instrument facilities at the Department of Chemistry, Shivaji University, Kolhapur. Author Rakhee Bhosale is thankful to SARTHI, Government of Maharashtra, India for the ‘Chhatrapati Shahu Maharaj National Research Fellowship-2021’.References
- S. Koohi-Fayegh and M. A. Rosen, J. Energy Storage, 2020, 27, 101047 CrossRef.
- M. B. Askari, P. Salarizadeh, M. Seifi, M. H. Ramezan zadeh and A. Di Bartolomeoss, J. Alloys Compd., 2021, 860, 158497 CrossRef CAS.
- X. Zhao, K. Tao and L. Han, Nanoscale, 2022, 14, 2155–2166 RSC.
- Y. Tang, W. Guo and R. Zou, Coord. Chem. Rev., 2022, 451, 214242 CrossRef CAS.
- Poonam, K. Sharma, A. Arora and S. K. Tripathi, J. Energy Storage, 2019, 21, 801–825 CrossRef.
- S. Sanati, Z. Rezvani and B. Habibi, New J. Chem., 2018, 42, 18426–18436 RSC.
- S. De, C. K. Maity, S. Sahoo and G. C. Nayak, ACS Appl. Energy Mater., 2021, 4, 3712–3723 CrossRef CAS.
- H. M. Nguyet, L. T. T. Tam, D. T. Tung, N. T. Yen, H. T. Dung, N. T. Dung, H. Phan N, L. A. Tuan, P. N. Minh and L. T. Lu, New J. Chem., 2022, 46, 13996–14003 RSC.
- Y. Shao, M. F. El-Kady, J. Sun, Y. Li, Q. Zhang, M. Zhu, H. Wang, B. Dunn and R. B. Kaner, Chem. Rev., 2018, 118, 9233–9280 CrossRef CAS PubMed.
- R. Liu, A. Zhou, X. Zhang, J. Mu, H. Che, Y. Wang, T. T. Wang, Z. Zhang and Z. Kou, Chem. Eng. J., 2021, 412, 128611 CrossRef CAS.
- A. Mohanty, D. P. Jaihindh, Y. P. Fu, S. P. Senanayak, L. S. Mende and A. Ramadoss, J. Power Sources, 2021, 488, 229444 CrossRef CAS.
- S. Kumar, G. Saeed, L. Zhu, K. N. Hui, N. H. Kim and J. H. Lee, Chem. Eng. J., 2021, 403, 126352 CrossRef CAS.
- L. Li, J. Meng, M. Zhang, T. Liu and C. Zhang, Chem. Commun., 2022, 58, 185–207 RSC.
- X. Chu, F. Meng, T. Deng and W. Zhang, Nanoscale, 2021, 13, 5570–5593 RSC.
- P. Forouzandeh, P. Ganguly, R. Dahiya and S. C. Pillai, J. Power Sources, 2022, 519, 230744 CrossRef CAS.
- C. V. V. Muralee Gopi, R. Vinodh, S. Sambasivam, I. M. Obaidat and H. J. Kim, J. Energy Storage, 2020, 27, 101035 CrossRef.
- S. Sanati, R. Abazari, A. Morsali, A. M. Kirillov, P. C. Junk and J. Wang, Inorg. Chem., 2019, 58, 16100–16111 CrossRef CAS PubMed.
- A. E. Baumann, D. A. Burns, B. Liu and V. S. Thoi, Commun. Chem., 2019, 2, 1–14 CrossRef.
- W. Li, X. Zhao, Q. Bi, Q. Ma, L. Han and K. Tao, Dalton Trans., 2021, 50, 11701–11710 RSC.
- H. M. Ma, J. W. Yi, S. Li, C. Jiang, J. H. Wei, Y. P. Wu, J. Zhao and D. S. Li, Inorg. Chem., 2019, 58, 9543–9547 CrossRef CAS PubMed.
- Y. Liang, W. Yao, J. Duan, M. Chu, S. Sun and X. Li, J. Energy Storage, 2021, 33, 1–11 Search PubMed.
- L. Zheng, J. Song, X. Ye, Y. Wang, X. Shi and H. Zheng, Nanoscale, 2020, 12, 13811–13821 RSC.
- S. Zhou, S. Wang, S. Zhou, H. Xu, J. Zhao, J. Wang and Y. Li, Nanoscale, 2020, 12, 8934–8941 RSC.
- P. Du, Y. Dong, C. Liu, W. Wei, D. Liu and P. Liu, J. Colloid Interface Sci., 2018, 518, 57–68 CrossRef CAS PubMed.
- C. Yang, X. Li, L. Yu, X. Liu, J. Yang and M. Wei, Chem. Commun., 2020, 56, 1803–1806 RSC.
- U. A. Khan, N. Iqbal, T. Noor, R. Ahmad, A. Ahmad, J. Gao, Z. Amjad and A. Wahab, J. Energy Storage, 2021, 41, 102999 CrossRef.
- S. Wang, S. Wang, X. Guo, Z. Wang, F. Mao, L. Su, H. Wu, K. Wang and Q. Zhang, Inorg. Chem. Front., 2021, 8, 4878–4886 RSC.
- N. Wu, H. Wu, J. Zhang, Y. Zhang, D. Cao, L. Bai and T. Hu, J. Alloys Compd., 2021, 856, 157466 CrossRef CAS.
- N. Liu, X. Liu and J. Pan, J. Colloid Interface Sci., 2022, 606, 1364–1373 CrossRef CAS PubMed.
- D. Y. Lee, S. J. Yoon, N. K. Shrestha, S. H. Lee, H. Ahn and S. H. Han, Microporous Mesoporous Mater., 2012, 153, 163–165 CrossRef CAS.
- G. Zhu, H. Wen, M. Ma, W. Wang, L. Yang, L. Wang, X. Shi, X. Cheng, X. Sun and Y. Yao, Chem. Commun., 2018, 54, 10499–10502 RSC.
- S. Xiong, S. Jiang, J. Wang, H. Lin, M. Lin, S. Weng, S. Liu, Y. Jiao, Y. Xu and J. Chen, Electrochim. Acta, 2020, 340, 135956 CrossRef CAS.
- Q. Li, H. Guo, R. Xue, M. Wang, M. Xu, W. Yang, J. Zhang and W. Yang, Int. J. Hydrogen Energy, 2020, 45, 20820–20831 CrossRef CAS.
- L. Wang, X. Feng, L. Ren, Q. Piao, J. Zhong, Y. Wang, H. Li, Y. Chen and B. Wang, J. Am. Chem. Soc., 2015, 137, 4920–4923 CrossRef CAS PubMed.
- X. Wang, N. Yang, Q. Li, F. He, Y. Yang, B. Wu, J. Chu, A. Zhou and S. Xiong, J. Solid State Chem., 2019, 277, 575–586 CrossRef CAS.
- M. Azadfalah, A. Sedghi and H. Hosseini, J. Electron. Mater., 2019, 48, 7011–7024 CrossRef CAS.
- C. H. Wang, D. W. Zhang, S. Liu, Y. Yamauchi, F. B. Zhang and Y. V. Kaneti, Chem. Commun., 2022, 58, 1009–1012 RSC.
- Y. Wu, X. Ding, Y. Luo, F. Xu, L. Sun, J. H. Lao, X. Qin, C. Dan, Y. Wang, Q. Yin, T. Wang, K. Zhang, B. Li, H. Zhang and Y. Zou, Int. J. Electrochem. Sci., 2021, 16, 1–11 Search PubMed.
- S. Gao, Y. Sui, F. Wei, J. Qi, Q. Meng and Y. He, J. Mater. Sci., 2018, 53, 6807–6818 CrossRef CAS.
- X. Zhang, N. Qu, S. Yang, Q. Fan, D. Lei, A. Liu and X. Chen, J. Colloid Interface Sci., 2020, 575, 347–355 CrossRef CAS PubMed.
- V. Veeramani, B. M. Matsagar, Y. Yamauchi, A. Y. Badjah, M. Naushad, M. Habila, S. Wabaidur, Z. A. Alothman, Z. L. Wang and K. C. W. Wu, J. Taiwan Inst. Chem. Eng., 2019, 96, 634–638 CrossRef CAS.
- R. Velmurugan, J. Premkumar, R. Pitchai, M. Ulaganathan and B. Subramanian, ACS Sustainable Chem. Eng., 2019, 7, 13115–13126 CrossRef CAS.
- S. B. Bandgar, M. M. Vadiyar, Y. C. Ling, J. Y. Chang, S. H. Han, A. V. Ghule and S. S. Kolekar, ACS Appl. Energy Mater., 2018, 1, 638–648 CrossRef CAS.
- S. Gao, Y. Sui, F. Wei, J. Qi, Q. Meng and Y. He, J. Mater. Sci.: Mater. Electron., 2018, 29, 2477–2483 CrossRef CAS.
- F. Israr, D. Chun, Y. Kim and D. K. Kim, Ultrason. Sonochem., 2016, 31, 93–101 CrossRef CAS PubMed.
- F. Israr, D. K. Kim, Y. Kim and W. Chun, Quim. Nova, 2016, 39, 669–675 CAS.
- X. Zhang, N. Qu, S. Yang, D. Lei, A. Liu and Q. Zhou, Mater. Chem. Front., 2021, 5, 482–491 RSC.
- X. Liu, D. Xu, Q. Wang and L. Zhang, Small, 2018, 14, 1–12 CAS.
- Q. Liu, L. Xie, X. Shi, G. Du, A. M. Asiri, Y. Luo and X. Sun, Inorg. Chem. Front., 2018, 5, 1570–1574 RSC.
- M. Thommes, K. Kaneko, A. V. Neimark, J. P. Olivier, F. Rodriguez-Reinoso, J. Rouquerol and K. S. W. Sing, Pure Appl. Chem., 2015, 87, 1051–1069 CrossRef CAS.
- R. Bardestani, G. S. Patience and S. Kaliaguine, Can. J. Chem. Eng., 2019, 97, 2781–2791 CrossRef CAS.
- M. Khalfaoui, S. Knani, M. A. Hachicha and A. Ben Lamine, J. Colloid Interface Sci., 2003, 263, 350–356 CrossRef CAS PubMed.
- G. Li, Y. Qi, H. Lin, N. Lu, J. Chen, J. Wang, Q. Han and F. Liu, J. Membr. Sci., 2021, 635, 1–9 Search PubMed.
- Q. Bi, Q. Ma, K. Tao and L. Han, Dalton Trans., 2021, 50, 8179–8188 RSC.
- J. Yang, P. Xiong, C. Zheng, H. Qiu and M. Wei, J. Mater. Chem. A, 2014, 2, 16640–16644 RSC.
- X. G. Han, P. F. Wang, Y. H. Zhang, H. Y. Liu, J. J. Tang, G. Yang and F. N. Shi, Inorg. Chim. Acta, 2022, 536, 120916 CrossRef CAS.
- S. S. Shah, E. Cevik, M. A. Aziz, T. F. Qahtan, A. Bozkurt and Z. H. Yamani, Synth. Met., 2021, 277, 116765 CrossRef CAS.
- C. Zhang, Q. Zhang, K. Zhang, Z. Xiao, Y. Yang and L. Wang, RSC Adv., 2018, 8, 17747–17753 RSC.
- Y. Li, Y. Xu, Y. Liu and H. Pang, Small, 2019, 15, 1–8 Search PubMed.
- J. W. Wang, Y. X. Ma, X. Y. Kang, H. J. Yang, B. L. Liu, S. S. Li, X. D. Zhang and F. Ran, J. Solid State Chem., 2022, 309, 122994 CrossRef CAS.
- S. Wang, J. Wang, M. Zeng, J. Yang, N. Hu, Y. Su, Z. Zhou, H. Pang and Z. Yang, J. Energy Storage, 2021, 38, 102528 CrossRef.
- C. Feng, C. P. Lv, Z. Q. Li, H. Zhao and H. H. Huang, J. Solid State Chem., 2018, 265, 244–247 CrossRef CAS.
- K. T. Kubra, A. Javaid, R. Sharif, G. Ali, F. Iqbal, A. Salman, F. Shaheen, A. Butt and F. J. Iftikhar, J. Mater. Sci.: Mater. Electron., 2020, 31, 12455–12466 CrossRef CAS.
| This journal is © The Royal Society of Chemistry and the Centre National de la Recherche Scientifique 2023 |

