Regulating photocatalysis by external-stimuli manipulation of the microenvironment in europium–organic frameworks†
Xin
Lu
a,
Yi-Fan
Li
c,
Chen-Li
Wang
a,
Jing-Yi
Gao
a,
Yi
Zhou
*b and
Chuan-Lei
Zhang
 *a
*a
aAnhui Provincial Key Laboratory of Advanced Catalysis and Energy Materials, Anhui Ultra High Molecular Weight Polyethylene Fiber Engineering Research Center, School of Chemistry and Chemical Engineering, Anqing Normal University, Anqing 261433, P. R. China. E-mail: clzhang@aqnu.edu.cn
bShandong Engineering Research Center of New Optoelectronic Information Technology and Devices, School of Mathematics and Physics, Qingdao University of Science & Technology, Qingdao 266061, P. R. China. E-mail: zhouyi@qust.edu.cn
cSchool of Environmental and Municipal Engineering, Qingdao University of Technology, Qingdao 266033, P. R. China
First published on 12th July 2024
Abstract
Although catalysis is highly dependent on the catalytically active site, accurately regulating the microenvironment around the active site is an important way to improve the overall performance of catalysts. Herein, an Eu-based MOF with a rod-shaped secondary building unit (SBU) was obtained through a self-assembly strategy, and named Eu-MOF-T (T = temperature). Eu-MOF-T can absolutely and kinetically transform into another structure, Eu-MOF-S (S = solvent), under a stimulus in different solvents. Interestingly, Eu-MOF-S can convert into Eu-MOF-T absolutely and thermodynamically upon temperature stimulation. These transformations are mainly caused by microenvironmental changes, including the ligand torsion angle and cavity volume in the structure, and take place in the form of single-crystal-to-single-crystal. Incredibly, Eu-MOF-S exhibits a halved cavity volume due to the bending of the ligand, yet demonstrates a superior photocatalytic CO2RR capacity of 7886.1 μmol g−1 h−1, while Eu-MOF-T, which possesses a larger cavity porosity, has a capacity of only 599.7 μmol g−1 h−1. Theoretical calculations further reveal that Eu-MOF-S is more favorable for the formation of COOH* and promotes its further conversion into CO during the CO2RR.
Introduction
Metal–organic frameworks (MOFs), as excellent model catalysts, have been increasingly used in small molecule catalysis in recent years, such as water oxidation, CO2 reduction, organic small molecule transformations, etc.1–4 which is attributed to their well-defined catalytic sites, tunable structures, and suitable material transport channels, but their unstable feature makes their application in catalysis very limited.5–8 The design and preparation of framework-stabilized MOFs are essential prerequisites for the development of their catalytic properties. Currently known frameworks, which can stabilize above 400 °C, such as UiO-66,9 NU-1000,10 MIL-101,11 and MOF-808,12 are too rigid and only have a single type of nodal metal. This makes them unable to reflect the advantages in the field of catalysis, especially in the field of photocatalysis. Designing MOFs with high thermal stability, good framework flexibility and node diversity is one of the next tasks for MOF designers.13–15Although the catalytic performance is highly dependent on the active sites of the catalyst, including the number and distribution of the sites, the impact of the microenvironment surrounding the catalytic site on the catalytic outcome is typically significant yet often disregarded.16,17 Certain pivotal microenvironments intricately maintain a multifaceted and delicate equilibrium within living systems, actively participate in the regulation of diverse physiological processes, and assume an indispensable role in upholding the robust development of organisms.18 Natural enzymes, as the catalysts with the highest catalytic efficiency in nature, have abundant amino acid residues around their centers to act as microenvironments to enhance the catalytic efficiency of the catalytic sites.19 The microenvironment is an extremely important factor in determining the physical or chemical behavior of the surrounding molecules as a powerful complement to the catalytic site, the main types of which include the ligand situation, spatial accessibility, residual groups, conjugated environments, and guest molecules, and designing and making full use of these types can significantly enhance catalytic effects.20–22
The crystalline nature of MOF materials provides a good basis for studying microenvironmental changes induced by external stimuli at the atomic level.23–26 The microstructure of MOFs with a certain framework flexibility can obviously respond to changes in external stimuli, and the magnitude of such changes can be determined by means of single-crystal testing.25,27,28 Single-crystal-to-single-crystal (SCSC) conversion has been a hot topic in the field of MOF research in recent years, and the relationship between structure and performance in applying SCSC to the catalytic process is rarely reported at present. By introducing PDMAEMA-functionalized pollen as “smart” anchors, Lee's group was able to “turn on” and “turn off” the catalytic activity of MOF@P-pollen with tunable dispersion, environmentally responsive activity, and significantly enhanced liquid-phase photocatalytic performance.29 However, among the thousands of MOFs reported in the past decades, only a few were able to respond to external stimuli, and this practical necessity motivates us to continue researching this type of material.30,31
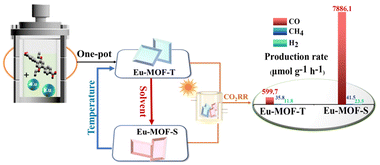
In order to deeply investigate the mechanism of the influence of the microenvironment around the active site on the photocatalytic performance to understand the microenvironment–activity relationship, structurally flexible MOFs with well-defined microenvironments were constructed in this study using the rare-earth metal Eu and flexibly branched bicarboxylic acid ligands (Eu-MOF-T and Eu-MOF-S, Scheme 1). The reversible single-crystal-to-single-crystal (SCSC) conversion of Eu-MOFs under external stimuli was performed by a simple strategy, in which Eu-MOF-T can be converted into Eu-MOF-S using a solvent under 20 min immersion, and conversely, Eu-MOF-S can be fully converted into Eu-MOF-T again at 220 °C. The photocatalytic results show a larger production of CO2 to CO for Eu-MOF-S.
Materials and equipment: All chemicals were commercially sourced and used without further purification.
Results and discussion
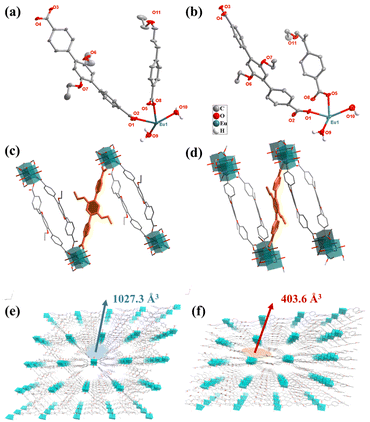
The Experimental section is given in the ESI.† The detailed information for Eu-MOF is summarized in Tables S1 and S2.†Two Eu-MOFs with different coordination environments were prepared by a mild and convenient method using the same Eu metal salt and the flexible ligand DTDA as precursors. First, Eu-MOF-T was obtained by self-assembly using the classical one-pot synthesis method. Eu-MOF-T was immersed in different solvents to form Eu-MOF-S, which occurred in a SCSC manner. Single crystal X-ray diffraction studies show that the crystal structures belonging to the triclinic system of both Eu-MOFs were constructed from the same Eu metal ion and the DTDA ligand, in the P![[1 with combining macron]](https://www.rsc.org/images/entities/char_0031_0304.gif) space group. The asymmetric units all contain an Eu(III) cation, one and a half DTDA2− anions, and two coordinating water molecules (Fig. 1a and b). The difference is that the guest molecules of Eu-MOF-T contain three DMF and eight water molecules, while Eu-MOF-S contains only one DMF and six water molecules. And the torsion angles of the DTDA ligands in the two MOFs are very different (Fig. 1c, d, Fig. S3a and b†). The DTDA ligand simultaneously coordinates with four Eu(III) ions in a saturated coordination mode, and each Eu(III) ion coordinates with six DTDA ligands and two water molecules in an eight-coordinate mode. For two structures, the Eu(III) ions are connected by four carboxyl groups from four DTDA ligands to form a twisted paddlewheel unit (Eu2(CO2)4). These units further extend indefinitely to form rod-shaped SBUs (Fig. S3g and h†), and ultimately form an infinite three-dimensional structure by DTDA cross-linking (Fig. 1e and f). From a topological point of view, the spatial structure of the entire complex can be simplified as a new 5,5,6 connected three-node network with the point symbol {32·44·62·7·8} {32·46·5·6} {32·46·52·65}. The pore structures of the two Eu-MOFs are clearly different (Fig. S3b–f†). The void volume of Eu-MOF-T was 1027.3 Å3 (41.4% of the unit cell volume), whereas the pore volume of Eu-MOF-S was reduced to roughly half, i.e., 403.6 Å3 (21.2% of unit cell volume) (Fig. 1e, f and S3e and f†).
space group. The asymmetric units all contain an Eu(III) cation, one and a half DTDA2− anions, and two coordinating water molecules (Fig. 1a and b). The difference is that the guest molecules of Eu-MOF-T contain three DMF and eight water molecules, while Eu-MOF-S contains only one DMF and six water molecules. And the torsion angles of the DTDA ligands in the two MOFs are very different (Fig. 1c, d, Fig. S3a and b†). The DTDA ligand simultaneously coordinates with four Eu(III) ions in a saturated coordination mode, and each Eu(III) ion coordinates with six DTDA ligands and two water molecules in an eight-coordinate mode. For two structures, the Eu(III) ions are connected by four carboxyl groups from four DTDA ligands to form a twisted paddlewheel unit (Eu2(CO2)4). These units further extend indefinitely to form rod-shaped SBUs (Fig. S3g and h†), and ultimately form an infinite three-dimensional structure by DTDA cross-linking (Fig. 1e and f). From a topological point of view, the spatial structure of the entire complex can be simplified as a new 5,5,6 connected three-node network with the point symbol {32·44·62·7·8} {32·46·5·6} {32·46·52·65}. The pore structures of the two Eu-MOFs are clearly different (Fig. S3b–f†). The void volume of Eu-MOF-T was 1027.3 Å3 (41.4% of the unit cell volume), whereas the pore volume of Eu-MOF-S was reduced to roughly half, i.e., 403.6 Å3 (21.2% of unit cell volume) (Fig. 1e, f and S3e and f†).
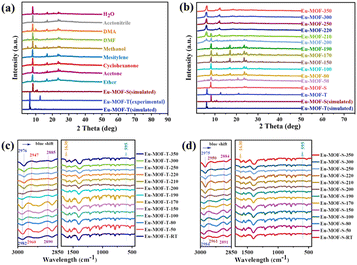
Powder X-ray diffraction (PXRD) was conducted to determine the structural transformation processes that regulate solvent- and temperature-mediated polycrystalline transformations, with the kinetic product Eu-MOF-S interconverting with the thermodynamic product Eu-MOF-T. The PXRD patterns of the synthesized Eu-MOF-T were very similar to the crystal structure simulations (Fig. S4a†), but changed significantly under different solvents submerged for different times. Specifically, the initial peak of Eu-MOF-T (2θ = 6.1°) disappeared rapidly after 20 min of immersion, while a new peak (2θ = 8.2°) appeared, and after 24 h of immersion, it was found to be completely transformed into Eu-MOF-S in all solvents without the appearance of any other new structures (Fig. 2a). Interestingly, this conversion was achieved through an SCSC manner in a variety of solvents. Amazingly, Eu-MOF-S is gradually transformed into Eu-MOF-T during the warm-up process (Fig. 2b). As known from Fig. 2f, this process can be divided into three stages. The first stage is the induction period; the PXRD spectra do not change significantly until 190 °C. Both Eu-MOF-T and Eu-MOF-S have guest molecules and their conversion has to overcome a barrier for activation. The transformation starts from the second stage (190–220 °C), during which the 2θ peak at 8.2° for Eu-MOF-S gradually disappears and a new peak at 6.1° subsequently increases. In the third stage, above 220 °C, the peak at 8.2° almost disappears, while the intensity of the peak at 6.1° continues to increase, and the final PXRD is in good agreement with the simulated Eu-MOF-T. This indicates that the polycrystalline transformation of Eu-MOF-S and Eu-MOF-T is successful and reaches the thermodynamic minimum.
Although the Eu-MOF-T and Eu-MOF-S transformations show low signal-to-noise ratios in the infrared spectra, the characteristic infrared variation bands of both structures can still be observed by testing at different temperatures (Fig. S4c and d†). The characteristic peaks for the asymmetric stretching vibration of Eu–O (595 cm−1), as well as the characteristic peaks of C–O and C–H of the DTDA ligand, and the peaks of DMF and H2O, can be clearly identified in the IR spectrum With the increase of temperature, the infrared bands of Eu-MOFs changed significantly, and the different frequencies of the C–H (∼2850–3000 cm−1) and C–O (∼1630 cm−1) stretching vibrations led to an increase in the peak bandwidth and a blue shift, which is in agreement with the results of the structural transformations (Fig. 2c and d). The vibrations of DMF disappeared, whereas the benzene rings of DTDA ligands remained unchanged, and the Eu–O bonds were unchanged. From the thermogravimetric analysis (TGA), it can be seen that Eu-MOF-T and Eu-MOF-S underwent a strong pyrolysis at 410 °C (Fig. S5a and b†), with the final thermal weight loss reaching 50.9% and 58.5%, respectively. In the N2 adsorption and desorption experiments at 77 K (Fig. S6a and b†), Eu-MOF-T adsorbed 128 cm g−1 with a pore size distribution of 7.3–12.7 Å, whereas Eu-MOF-S did not adsorb or desorb N2, and the pore size distribution obtained by CO2 adsorption and desorption experiments was 6.9–12.7 Å, which suggests that Eu-MOF-T has a larger pore size. In CO2 adsorption and desorption experiments (Fig. S6c and d†), Eu-MOF-T outperforms Eu-MOF-S at both temperatures, but the presence of a large hysteresis loop in the isothermal adsorption and desorption curves of Eu-MOF-S indicates a strong CO2 adsorption capacity, which can capture and immobilize CO2 molecules more efficiently during the catalytic process, which is conducive to the photocatalytic CO2RR.
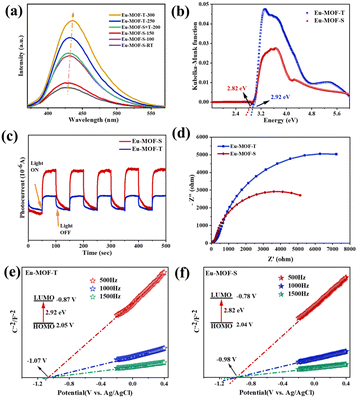
Further spectroscopic measurements were performed to determine the actual effect of the ligand-twisted microenvironment on the formation of Eu-MOFs. In general, PL signals are generated by photogenerated electron–hole complexation, and the peak intensity correspondingly indicates the degree of complexation. As shown in Fig. S5c,† both Eu-MOF-T and Eu-MOF-S show four PL emission peaks, which can be attributed to the typical three emission peaks of metal Eu and one emission peak of ligand DTDA. Among them, Eu-MOF-S has the lowest PL signal, indicating that it has the highest separation efficiency of photoelectrons and holes. At various temperatures, however, the fluorescence emission showed a significant redshift from low to high temperature tests, which was caused by molecular motion (Fig. 3a). In addition, the time-resolved photoluminescence (TRPL) decay spectra show a smaller average fitted lifetime of 31 ns for Eu-MOF-S relative to the 37 ns for Eu-MOF-T, suggesting that its singlet excited state decays faster and is capable of rapid electron transfer (Fig. S5e and f†). The UV-vis spectra showed that Eu-MOF-T and Eu-MOF-S possessed similar light absorption properties, with two distinct absorption peaks at 286 nm and 355 nm. Compared with the DTDA ligand, the enhancement of absorption in the visible region of both MOFs is not negligible (Fig. S5d,† ≥400 nm), and both have competitive potential for the photocatalytic reduction of CO2. The band gaps of Eu-MOF-T and Eu-MOF-S are calculated to be 2.99 and 2.84 eV, respectively, by the Kubelka–Munk function (Fig. 3b). As can be seen from the band gap structure, the prepared photocatalysts fully satisfy the favorable conditions for the conversion of CO2 to CO. The ligand-twisted Eu-MOF-S photocatalyst with efficient photogenerated carrier separation efficiency, excellent light absorption properties and suitable bandgap structures can enhance the photocatalytic CO2 reduction performance.
The transient photocurrent response was tested under visible light using an electrochemical workstation. When the light source is turned on, the catalysts absorb photons with energies equal to or greater than the bandgap energy, leading to the rapid generation of electron–hole pairs on a picosecond time scale, resulting in an instantaneous increase in the photocurrent. Over time, the process of the trapping and re-emission of light-generated carriers on the trap gradually takes effect, leading to a gradual decay of the current to the equilibrium current. The slow decay of the current when the light is turned off can be understood as being a result of the gradual re-emission and recombination of charge carriers from the trap. The photoresponsive capability of Eu-MOF-S is much stronger than that of Eu-MOF-T and boosts more photogenerated electron–hole pairs (Fig. 3c). In order to better define the carrier transport type of Eu-MOFs, Mott–Schottky experiments were performed. As shown in Fig. 3e and f, Eu-MOF-T and Eu-MOF-S have positive slopes and are both typical n-type semiconductors with flat band potentials (Efb) of −1.07 V (V vs. Ag/AgCl) and −0.98 V (V vs. Ag/AgCl), respectively. Based on the optical bandgap values, the HOMO and LUMO positions of the Eu-MOFs are roughly calculated, where the HOMO and LUMO positions of the Eu-MOF-T are at 2.12 V and −0.87 V, respectively, while those of the Eu-MOF-S are at 2.06 V and −0.78 V, respectively. The electron transfer ability of the two MOFs was investigated using EIS. In general, the smaller the Rct value of the catalyst, the smaller the surface charge transfer impedance and the stronger the electron transfer ability. The conductivity of Eu-MOF-S was significantly increased after undergoing solvent stimulation, suggesting that ligand twisting significantly improves the electron transfer capacity of Eu-MOFs (Fig. 3d). The results show that the effective capture of photogenerated carriers by the twisted microenvironment of Eu-MOF-S can promote the separation of photogenerated electron–hole pairs. The captured photogenerated electrons rapidly migrate to the catalyst surface, which in turn promotes the photocatalytic CO2 reduction.
The CO2 photoreduction performance of two Eu-MOFs was tested using a visible 400 nm cartridge xenon lamp as a light source, acetonitrile as a solution, Ru(bpy)3CI2 as a photosensitizer, and triethylamine (TEA) as a sacrificial agent, to investigate the effects of microenvironmental changes induced by external stimuli on the photocatalytic activity. The collected gaseous products were detected using gas chromatography and the liquid products were analyzed using a mass spectrometer. The results show that the photocatalytic CO2 reduction products for Eu-MOF-T and Eu-MOF-S are indeed H2, CO and CH4.
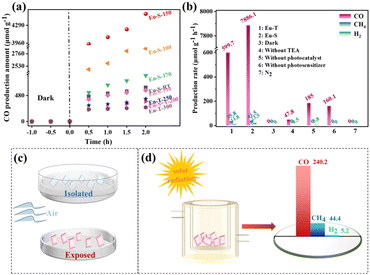
Firstly, the reduction performance of Eu-MOFs at different activation temperatures was investigated, as shown in Fig. 4a. With the prolongation of the irradiation time, the CO production rate increased rapidly in the initial steps, then decreased, and increased slowly in the last stage. This may be attributed to the faster decomposition of the photosensitizer during the experimental process, and led to a sudden decrease in the reactivity. Due to the high stability of the catalyst, the CO production amount continued to increase. After irradiation for 2 h, Eu-MOF-S showed the best catalytic effect at an activation temperature of 150 °C, and Eu-MOF-S was superior to Eu-MOF-T at any temperature. Next, blank and control experiments were carried out under the same experimental conditions (Fig. 4b) to investigate the yields and selectivities. It can be seen that Eu-MOF-S is optimal in terms of photocatalytic efficiency and selectivity (99.2%), and its catalytic activity of 7886.1 μmol g−1 h−1 is about 13 times better than that of Eu-MOF-T, reflecting the necessity of microenvironmental studies in stimulus-responsive MOFs. No CO2 reduction products were detected under both N2 and dark conditions, suggesting that the products originate from a light-driven catalytic reduction reaction of dissolved CO2, and confirming that the CO2 feed is indeed the carbon source. In the absence of the addition of the sacrificial agent triethylamine, the catalytic activity was reduced to 47.8 μmol g−1 h−1 CO due to severe electron–hole complexation. The catalytic activity of Eu-MOF-S without the photosensitizer was significantly reduced to 160.1 μmol g−1 h−1. However, [Ru(bpy)3]Cl2 itself produced 185 μmol g−1 h−1 CO and 5.8 μmol g−1 h−1 H2, which was subtracted from the catalytic reduction results of Eu-MOFs. Controlled experiments demonstrated that the Eu-MOF photocatalyst, light, photosensitizer, sacrificial agent and CO2 were indispensable. In order to evaluate the stability of the Eu-MOF catalysts, cycling experiments were carried out, and only a slight decrease in the CO yield was observed in five test cycles (Fig. S7a†). The XRD spectra of Eu-MOFs before and after the reaction were almost the same (Fig. S7b†), indicating quality framework structure stability during the photocatalytic testing.
It is extremely interesting that Eu-MOF-T remains unchanged when placed in an isolated glass-surface vessel for one week after synthesis, while it can be converted into Eu-MOF-S in 3 days when placed in an open glass-surface vessel, i.e., when exposed to air, indicating that a very weak stimulus can elicit a response from Eu-MOF-T (Fig. 4c). The solar photocatalytic CO2RR was carried out, and the experimental procedure was consistent with the “Photocatalytic reduction of CO2 test” described in the ESI,† except that the xenon lamp was replaced by sunlight. The CO2 to CO production rate was 240.2 μmol g−1 h−1 (Fig. 4d), which indicates that Eu-MOF-S is a new stimulus-responsive MOF material with potential for CO2 reduction using solar energy.
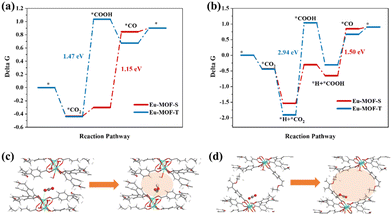
Density Functional Theory (DFT) calculations were performed on the above reaction steps to understand the photoreductive activities of Eu-MOF-T and Eu-MOF-S at the atomic level, especially the key role of the microenvironment around the active site in CO2 conversion. Fig. S6a† shows that the Gibbs free energy (ΔG) of Eu-MOF-T is lower than that of Eu-MOF-S. The theoretical bandgap values of Eu-MOF-T and Eu-MOF-S are 2.91 and 2.83 eV, respectively, which are in agreement with the experimental test results (Fig. S8b†). The ΔG of the photocatalytic CO2 reduction process was calculated for Eu-MOFs according to two reaction pathways, where the negative ΔG value of the adsorbed CO2 represents the effective capture and activation of CO2 molecules. Fig. 5a shows the path of protons originating from the solution, and the first proton-coupled electron transfer (PCET) on Eu-MOF-T forms adsorbed COOH* with a ΔG of 1.47 eV. In contrast, the lower energy barrier of ΔG (−0.3 eV) for Eu-MOF-S obviously favors the catalytic process. The other pathway is the proton originating from the adsorbed state *H near the catalytic site (Fig. 5b); the ΔG values of the process (*CO2 + H+ + e− → *COOH) are 2.94 eV and 1.23 eV for Eu-MOF-T and Eu-MOF-S, respectively. It follows that *COOH is the rate-determining step for CO2-to-CO and Eu-MOF-S is superior to Eu-MOF-T under both pathways. Detailed information on PCET throughout the photoreduction process and the corresponding structures of the reaction intermediates are provided in Fig. S9.† In the further PCET process, dehydration occurs to form *CO which then desorbs from the active site.
Further computational simulations show that the presence of the HOMO on the metal site and total density of states (DOS) originate from the Eu-4f atomic orbital for the Eu-MOF-S configuration, as seen in Fig. S10,† which facilitates electron transfer from the substrate to CO2 during CO2 adsorption. The next two hydrogenation steps of CO2 to *COOH and *COOH to CO are also accompanied by the transfer of electrons, and the better electrical conductivity of Eu-MOF-S may result in the lowering of *COOH energy barriers, which creates ordered and fast electron transfer conditions for photocatalysis. It is noteworthy that *COOH and Eu sites are positively charged and do not approach each other easily, whereas the apparently small pore of Eu-MOF-S favors the confinement of *COOH, making its distance to the Eu site 2.9 Å, which is smaller than that of 3.76 Å for Eu-MOF-T. *COOH is forced to be close to the Eu site and appears to interact with O around Eu in the presence of H stabilization (differential charge density plot), reducing the overall energy (Fig. 5c and S9†). It can be seen that the modulation of the catalytic properties of crystalline MOF materials is ultimately achieved by changes in the microenvironment of the active site manipulated by external stimuli such as temperature and solvent, including the ligand torsion angle, cavity volume, and electronic effects. This catalytic property enhancement accompanying the SCSC conversion process is a major breakthrough in the application field of single MOF materials, and also provides experimental and theoretical support for the study of stimulated crystalline materials.
Conclusions
In order to deeply investigate the mechanism of the microenvironment around the active site on the photocatalytic performance and to understand the microenvironment–activity relationship, in this paper, structurally flexible MOFs with a good microenvironment were constructed using rare-earth metal Eu and flexibly branched dicarboxylic acid ligands. They have flexibly branched dicarboxylic acid ligands, DTDA, and the two carboxyl groups are attached to two metal Eu(III) ions, respectively. The effects of different microenvironments around the metal active sites on the photocatalytic CO2 reduction performance and the subtlety of the stimulus-responsive structural modulation were investigated by adjusting the torsion angle of DTDA in the model system. Interestingly, reversible SCSC conversion of the Eu-MOF can be achieved under external stimulation using a simple strategy, in which Eu-MOF-T can be converted into Eu-MOF-S in a solvent with immersion for 20 min, and in contrast, Eu-MOF-S can be completely converted into Eu-MOF-T again under an Ar atmosphere at 220 °C. Photocatalytic CO2 reduction results showed that Eu-MOF-S with a larger ligand torsion angle significantly improved the photocatalytic activity and reached the optimum catalytic effect at an activation temperature of 150 °C. Utilizing the fundamental physical properties of the stimuli-responsive framework with host–guest interactions and rationally designing the ligand torsion, not only was a better photocatalytic performance obtained, but also the microenvironment–activity relationship was elucidated to achieve the performance tuning of the microenvironmental aspect of stimuli-responsive MOF catalysis.Data availability
All relevant data are within the manuscript and ESI is available. CCDC 1923215 and 2354711.†Conflicts of interest
There are no conflicts to declare.Acknowledgements
This work was supported by grants from the National Natural Science Foundation of China (No. 22101006), the Natural Science Research Major Project of Anhui Provincial Department of Education (2023AH040071), the Anhui Natural Science Foundation Youth Project (No. 1908085QB49) and the Natural Science Foundation of Shandong Province (ZR2021QB205).References
- Y. Bao, H. Ru, Y. Wang, K. Zhang, R. Yu, Q. Wu, A. Yu, D.-S. Li, C. Sun, W. Li and J. Tu, Hetero MOF-on-MOF of Ni-BDC/NH2-MIL-88B(Fe) enables efficient electrochemical seawater oxidation, Adv. Funct. Mater., 2024, 34, 2314611 CrossRef CAS.
- S. Karmakar, S. Barman, F. A. Rahimi, S. Biswas, S. Nath and T. K. Maji, Developing post-modified Ce-MOF as a photocatalyst: A detail mechanistic insight into CO2 reduction toward selective C2 product formation, Energy Environ. Sci., 2023, 16, 2187–2198 RSC.
- P. Jiang, Y. Niu, J. Cao, D. Xie, J. Li and T. Guo, A MOF-doped molecularly imprinted polymer/MOF hybrid gel incorporating with pH-buffering sodium acrylate for practical detoxification of organophosphorus nerve agents, Chem. Eng. J., 2024, 481, 148377 CrossRef CAS.
- L. Xie, Y. Jiang, W. Zhu, S. Ding, Y. Zhou and J.-J. Zhu, Cu-based catalyst designs in CO2 electroreduction: Precise modulation of reaction intermediates for high-value chemical generation, Chem. Sci., 2023, 14, 13629–13660 RSC.
- P. de la Torre, L. An and C. J. Chang, Porosity as a design element for developing catalytic molecular materials for electrochemical and photochemical carbon dioxide reduction, Adv. Mater., 2023, 35, 2302122 CrossRef CAS PubMed.
- X. Zhuang, S. Zhang, Y. Tang, F. Yu, Z. Li and H. Pang, Recent progress of MOF/MXene-based composites: Synthesis, functionality and application, Coord. Chem. Rev., 2023, 490, 215208 CrossRef CAS.
- S. A. Younis, E. E. Kwon, M. Qasim, K.-H. Kim, T. Kim, D. Kukkar, X. Dou and I. Ali, Metal–organic framework as a photocatalyst: Progress in modulation strategies and environmental/energy applications, Prog. Energy Combust. Sci., 2020, 81, 100870 CrossRef.
- C. Xiao, J. Tian, Q. Chen and M. Hong, Water-stable metal–organic frameworks (MOFs): Rational construction and carbon dioxide capture, Chem. Sci., 2024, 15, 1570–1610 RSC.
- S. M. J. Rogge, S. Borgmans and V. Van Speybroeck, Absorbing stress via molecular crumple zones: Strain engineering flexibility into the rigid UiO-66 material, Matter, 2023, 6, 1435–1462 CrossRef CAS.
- Z. Wang, K. M. Schmalbach, R. L. Combs, Y. Chen, R. L. Penn, N. A. Mara and A. Stein, Effects of phase purity and pore reinforcement on mechanical behavior of NU-1000 and silica-infiltrated NU-1000 metal–organic frameworks, ACS Appl. Mater. Interfaces, 2020, 12, 49971–49981 CrossRef CAS PubMed.
- Y. Gao, K. Liu, R. Kan, J. Xia, G. Yu and S. Deng, A comparative study of rigid and flexible MOFs for the adsorption of pharmaceuticals: Kinetics, isotherms and mechanisms, J. Hazard. Mater., 2018, 359, 248–257 CrossRef CAS PubMed.
- P. Chen, X. He, M. Pang, X. Dong, S. Zhao and W. Zhang, Iodine capture using Zr-based metal–organic frameworks (Zr-MOFs): Adsorption performance and mechanism, ACS Appl. Mater. Interfaces, 2020, 12, 20429–20439 CrossRef CAS PubMed.
- J. Li, H. Huang, W. Xue, K. Sun, X. Song, C. Wu, L. Nie, Y. Li, C. Liu, Y. Pan, H.-L. Jiang, D. Mei and C. Zhong, Self-adaptive dual-metal-site pairs in metal–organic frameworks for selective CO2 photoreduction to CH4, Nat. Catal., 2021, 4, 719–729 CrossRef CAS.
- P.-X. Li, X.-Y. Yang, X.-M. Song, J.-J. Li, B.-H. Ren, S.-Y. Gao and R. Cao, Zirconium-based metal–organic framework particle films for visible-light-driven efficient photoreduction of CO2, ACS Sustainable Chem. Eng., 2021, 9, 2319–2325 CrossRef CAS.
- S. Yuan, L. Zou, H. Li, Y.-P. Chen, J. Qin, Q. Zhang, W. Lu, M. B. Hall and H.-C. Zhou, Flexible zirconium metal–organic frameworks as bioinspired switchable catalysts, Angew. Chem., Int. Ed., 2016, 55, 10776–10780 CrossRef CAS PubMed.
- L. Jiao, J. Wang and H.-L. Jiang, Microenvironment modulation in metal–organic framework-based catalysis, Acc. Mater. Res., 2021, 2, 327–339 CrossRef CAS.
- S. Su, X. Li, Z. Liu, W. Ding, Y. Cao, Y. Yang, Q. Su and M. Luo, Microchemical environmental regulation of POMs@MIL-101(Cr) promote photocatalytic nitrogen to ammonia, J. Colloid Interface Sci., 2023, 646, 547–554 CrossRef CAS PubMed.
- H. Fang, Y. Chen, Z. Jiang, W. He and Z. Guo, Fluorescent probes for biological species and microenvironments: From rational design to bioimaging applications, Acc. Chem. Res., 2023, 56, 258–269 CrossRef CAS PubMed.
- L. Zhou, H. He, M. Tao, Y. Muhammad, W. Gong, Q. Liu, Z. Zhao and Z. Zhao, Chloroplast-inspired microenvironment engineering of inverse opal structured IO-TiO2/Chl/IL for highly efficient CO2 photolytic reduction to CH4, Chem. Eng. J., 2023, 464, 142685 CrossRef CAS.
- S. Yao, L.-P. Chang, G.-C. Guo, Y.-J. Wang, Z.-Y. Tian, S. Guo, T.-B. Lu and Z.-M. Zhang, Microenvironment regulation of {Co4IIO4} cubane for syngas photosynthesis, Inorg. Chem., 2022, 61, 13058–13066 CrossRef CAS PubMed.
- X. Ma, H. Liu, W. Yang, G. Mao, L. Zheng and H.-L. Jiang, Modulating coordination environment of single-atom catalysts and their proximity to photosensitive units for boosting MOF photocatalysis, J. Am. Chem. Soc., 2021, 143, 12220–12229 CrossRef CAS PubMed.
- Z.-W. Huang, S.-W. An, K.-Q. Hu, X.-B. Li, Z.-N. Bin, Z.-H. Zhou, L. Mei, Z.-J. Guo, W.-S. Wu, Z.-F. Chai and W.-Q. Shi, Modulating the coordination microenvironment of uranyl compounds to enhance photocatalytic CO2 reduction, Inorg. Chem. Front., 2023, 10, 4754–4762 RSC.
- A. Schneemann, V. Bon, I. Schwedler, I. Senkovska, S. Kaskel and R. A. Fischer, Flexible metal–organic frameworks, Chem. Soc. Rev., 2014, 43, 6062–6096 RSC.
- S.-S. Meng, M. Xu, H. Guan, C. Chen, P. Cai, B. Dong, W.-S. Tan, Y.-H. Gu, W.-Q. Tang, L.-G. Xie, S. Yuan, Y. Han, X. Kong and Z.-Y. Gu, Anisotropic flexibility and rigidification in a TPE-based Zr-MOFs with scu topology, Nat. Commun., 2023, 14, 5347 CrossRef CAS PubMed.
- B. Yu, R.-B. Lin, G. Xu, Z.-H. Fu, H. Wu, W. Zhou, S. Lu, Q.-W. Li, Y. Jin, J.-H. Li, Z. Zhang, H. Wang, Z. Yan, X. Liu, K. Wang, B. Chen and J. Jiang, Linkage conversions in single-crystalline covalent organic frameworks, Nat. Chem., 2024, 16, 114–121 CrossRef CAS PubMed.
- X.-D. Huang, B.-K. Hong, G.-H. Wen, S.-H. Li and L.-M. Zheng, Photo-controllable heterostructured crystals of metal–organic frameworks via reversible photocycloaddition, Chem. Sci., 2023, 14, 1852–1860 RSC.
- S.-J. Lee, J. L. Mancuso, K. N. Le, C. D. Malliakas, Y.-S. Bae, C. H. Hendon, T. Islamoglu and O. K. Farha, Time-Resolved in situ polymorphic transformation from one 12-connected Zr-MOF to another, ACS Mater. Lett., 2020, 2, 499–504 CrossRef CAS.
- J. Dong, V. Wee and D. Zhao, Stimuli-responsive metal–organic frameworks enabled by intrinsic molecular motion, Nat. Mater., 2022, 21, 1334–1340 CrossRef CAS PubMed.
- H. C. Lee, T. Heil, J. K. Sun and B. Schmidt, Dispersed nano-MOFs via a stimuli-responsive biohybrid-system with enhanced photocatalytic performance, Mater. Horiz., 2019, 6, 802–809 RSC.
- D. Yan, Z. Wang and Z. Zhang, Stimuli-responsive crystalline smart materials: from rational design and fabrication to applications, Acc. Chem. Res., 2022, 55, 1047–1058 CrossRef CAS PubMed.
- R. Pallach, J. Keupp, K. Terlinden, L. Frentzel-Beyme, M. Kloss, A. Machalica, J. Kotschy, S. K. Vasa, P. A. Chater, C. Sternemann, M. T. Wharmby, R. Linser, R. Schmid and S. Henke, Frustrated flexibility in metal–organic frameworks, Nat. Commun., 2021, 12, 4097 CrossRef CAS PubMed.
Footnote |
| † Electronic supplementary information (ESI) available. CCDC 1923215 and 2354711. For ESI and crystallographic data in CIF or other electronic format see DOI: https://doi.org/10.1039/d4qi01226g |
| This journal is © the Partner Organisations 2024 |

