Both layered trihydroxide hollow cubes and bismuth oxide derived from MOF templates for high-performance alkaline batteries†
Jianwei
Wang
 *a,
Wenhui
Wang
a,
Huan
Wang
a,
Wenlin
Zhang
a,
Yanzhong
Zhen
a,
Feng
Fu
*a and
Bin
Xu
 *ab
*ab
aSchool of Chemistry & Chemical Engineering, Yan'an University, Yan'an 716000, Shaanxi, China. E-mail: wangjianwei@yau.edu.cn; yadxfufeng@126.Com
bCollege of Materials Science and Engineering, Beijing University of Chemical Technology, China. E-mail: xubin@mail.buct.edu.cn
First published on 1st September 2023
Abstract
Aqueous alkaline rechargeable batteries (ARBs) have huge potential in energy storage equipment because of their low cost, safety and high ionic conductivity. However, the performance of actual ARBs is largely limited by electrode materials. Here, the CoNiMn-LDH cathode with a hollow cubic structure and the Bi2O3 anode with a rod-shaped structure were successfully prepared using MOFs as templates. Compared with binary CoNi-LDH, the ternary CoNiMn-LDH has a larger voltage window, higher capacity, and faster charge transport dynamics and ion diffusion dynamics. A full battery was assembled with CoNiMn-LDH and Bi2O3, and exhibited a high specific capacity of 247.32 mA h g−1 at 1 A g−1. It exhibited cycling stability for up to 1400 cycles and its capacity retention was 87% at 4 A g−1. In addition, a high energy density of 120 W h kg−1 could also be achieved at a power density of 4219 W kg−1. This study provides an instructive paradigm for the design and preparation of advanced electrode materials for full batteries.
1. Introduction
Lately, the wide application of portable electronic devices and electric vehicles has prompted people to further explore high-performance electrochemical energy storage devices. Lithium ion batteries (LIBs) are diffusely used in electrochemical energy storage devices because of their high energy density and long lifetime.1–3 It is difficult to solve the inherent defects such as the safety of organic electrolyte and the lack of lithium resources.4 Aqueous LIBs and solid electrolytes are an effective solution. Nevertheless, their low energy density, high cost, and low power density limit their large-scale applications.5,6 In order to solve the problems of poorly developed solid electrolytes and dangerous traditional lithium batteries, aqueous alkaline rechargeable batteries (ARBs) have been valued again for their high ionic conductivity.7As is well known, cathode and anode materials are one of the momentous components of ARBs. Recently, layered double hydroxides (LDHs) have been considered as promising cathode materials due to the substitutability of their metal ions, the interchangeability of interlayer anions and superior theoretical capacity. It is reported that bimetallic layered double hydroxides (LDHs) have inherent synergism, optimal active sites and good redox reversibility.8–10 CoNi-LDH as a battery-type material has attracted great research interest due to the synergistic effect of Ni2+/Ni3+ and Co2+/Co3+ redox coupling.11 The battery-type characteristic of the electrochemical response of Ni-based hydroxides and Co-based hydroxides in aqueous alkaline electrolyte indicates reversible conversion processes, as illustrated in the following equations:12,13
| Ni(OH)2 + OH− ↔ NiOOH + H2O + e− | (1) |
| Co(OH)2 + OH− ↔ CoOOH + H2O + e− | (2) |
| CoOOH + OH− ↔ CoO2 + H2O + e− | (3) |
However, most LDH electrode materials have poor cycling stability and capacity due to agglomeration in alkaline electrolyte, severely limiting their applications in energy storage.14,15 Therefore, improving the cycling stability and capacity of ARBs has become a challenge that must be overcome in research. The current optimization strategy mainly focuses on doping metal atoms, controlling their morphology and matching anode materials.
Manganese doping has been demonstrated to modulate the structure of electrode materials and improve their electrochemical performance. For example, Mn-doped MoSe2 nanoflowers were prepared by Kuraganti et al. The results show that manganese doping can improve the charge transport dynamics by promoting the formation of selenium vacancies in MoSe2.16 Then, Zhang et al. proposed to fabricate Mn doped Ni(OH)2 by regulating the Mn doping level. Mn-doping could modulate the electronic configuration and the layer stacking, and improve the conductivity by reducing the surface dehydrogenation energy.17 Furthermore, high valence manganese ions could reinforce the electrostatic attraction between interlayer anions and positively charged nanomaterials, resulting in an increased layer spacing along the stacking direction and exposure of more active sites to realize a rapid Faraday redox reaction.18 Clearly, manganese as an excellent dopant for CoNi-LDH may establish defect location, extend the interlaminar structure, and supply fast electron transport, which facilitate charge storage.
In electrochemistry, metal–organic frameworks (MOFs) have gained huge attention due to their controllable morphology for utilization in multifarious fields. MOFs are porous materials with unique physicochemical properties, high stability, tunable functions and large specific surface areas.19 The OH− ions may interact with the organic ligands of MOFs during faradaic OH− storage in aqueous alkaline electrolytes, exhibiting pseudocapacitive activity within substantially negative potential ranges. Moreover, organic ligands can be easily exchanged by an in situ etching method. As for the anode materials, metal oxides (Bi2O3, MoO3−x, Fe2O3, etc.) are attractive anode materials for energy storage devices. Compared to Fe- and Mo-based materials, Bi2O3 has a high theoretical capacity (385 mA h g−1), a highly reversible redox process, and an extensive working voltage window. In view of this, Bi2O3 will be a good matching anode for CoNi-LDH type cathode materials.
Based on the above advantages, the CoNiMn-LDH cathode with a hollow cubic structure and the Bi2O3 anode with a rod-shaped structure derived from MOF templates were synthesized by a simple solvothermal method. When the Mn element is introduced into CoNi-LDH, the specific capacity is significantly increased. The assembled full battery exhibits a high specific capacity of 247.32 mA h g−1 at 1 A g−1. It also exhibits significant long-term cycling stability for 1400 cycles and a capacity retention of 87% at 4 A g−1. In addition, a high energy density of 120 W h kg−1 could also be achieved at a power density of 4219 W kg−1.
2. Experimental
2.1 Synthesis of ZIF-67
10 mg of CTAB was dissolved in 20 mL of deionized water, and then 580 mg of Co(NO3)2·6H2O was added and stirred. The solution from the previous step was poured into 140 mL of 0.8 mol L−1 2-methimidazole aqueous solution and stirred at 40 °C for 1 h. The products were centrifuged with ethanol several times and dried at 60 °C for 12 h to acquire the product ZIF-67.2.2 Synthesis of CoNi-LDH and CoNiMn-LDH
2 mL of an ethanol solution of ZIF-67 (10 mg mL−1) was added to 13 mL of ethanol, and then 1 mL of 0.1 mol L−1 NiCl2·6H2O solution was added and heated at 80 °C for 20 min. The samples were centrifuged several times and then dried at 60 °C overnight to yield the sample CoNi-LDH. 0.05 g of CoNi-LDH and 6.9 mg of manganese acetate were added to 20 mL of methanol and stirred for 1 h. The samples were washed with methanol and then dried at 60 °C for 10 h to obtain the sample CoNiMn-LDH.2.3 Synthesis of Bi-MOF and Bi2O3
0.75 g of Bi(NO3)2·5H2O and 3.75 g of H3BTC were dissolved in a mixture of methanol/DMF (Vmethanol![[thin space (1/6-em)]](https://www.rsc.org/images/entities/char_2009.gif) :
:![[thin space (1/6-em)]](https://www.rsc.org/images/entities/char_2009.gif) VDMF = 1
VDMF = 1![[thin space (1/6-em)]](https://www.rsc.org/images/entities/char_2009.gif) :
:![[thin space (1/6-em)]](https://www.rsc.org/images/entities/char_2009.gif) 4, 300 mL). Subsequently, the solution from the previous step was sonicated to obtain a transparent solution. The solution was reacted at 120 °C for 24 h. The resulting precipitate was centrifuged with ethanol and then dried at 60 °C for 12 h. The resulting precipitate was Bi-MOF. 2 g of Bi-MOF was immersed in 400 mL of potassium hydroxide (1 mol L−1) for 2 h. The resulting product was washed six times alternately with ethanol and DI water, and dried in an oven at 60 °C.
4, 300 mL). Subsequently, the solution from the previous step was sonicated to obtain a transparent solution. The solution was reacted at 120 °C for 24 h. The resulting precipitate was centrifuged with ethanol and then dried at 60 °C for 12 h. The resulting precipitate was Bi-MOF. 2 g of Bi-MOF was immersed in 400 mL of potassium hydroxide (1 mol L−1) for 2 h. The resulting product was washed six times alternately with ethanol and DI water, and dried in an oven at 60 °C.
2.4 Characterization studies
Phase analysis of the synthesized products was performed by powder X-ray diffraction (XRD) on XRD-7000 advanced instruments. The morphology and structure of the products were characterized by scanning electron microscopy (SEM, MIRA3 LMH). The element valence and chemical composition of the products were analyzed by X-ray photoelectron spectroscopy (XPS, Thermo Scientific ESCALAB Xi+). The specific surface area and pore distribution were analyzed using an ASAP 2460.2.5 Electrochemical measurements
All electrochemical tests were performed using a CHI 760E instrument and a battery testing system (Wuhan LAND, CT2001A, China). In the three-electrode system, cathode or anode was used as the working electrode, a platinum sheet as the counter electrode, and a Ag/AgCl electrode as the reference electrode. In the test of a single electrode, the mass loading of CoNi-LDH, the CoNiMn-LDH cathode and the Bi2O3 anode is around 2 mg. For the working electrode, the active substance, conductive carbon, and polyvinylidene fluoride (8![[thin space (1/6-em)]](https://www.rsc.org/images/entities/char_2009.gif) :
:![[thin space (1/6-em)]](https://www.rsc.org/images/entities/char_2009.gif) 1
1![[thin space (1/6-em)]](https://www.rsc.org/images/entities/char_2009.gif) :
:![[thin space (1/6-em)]](https://www.rsc.org/images/entities/char_2009.gif) 1) were mixed and ground. Then, the acquired slurry was coated on the NF (1 × 1 cm2). A full battery was prepared using CoNiMn-LDH as the cathode, Bi2O3 as the anode, and 6 mol L−1 potassium hydroxide as the electrolyte. Based on charge balance, the mass ratio of cathode and anode materials is 1
1) were mixed and ground. Then, the acquired slurry was coated on the NF (1 × 1 cm2). A full battery was prepared using CoNiMn-LDH as the cathode, Bi2O3 as the anode, and 6 mol L−1 potassium hydroxide as the electrolyte. Based on charge balance, the mass ratio of cathode and anode materials is 1![[thin space (1/6-em)]](https://www.rsc.org/images/entities/char_2009.gif) :
:![[thin space (1/6-em)]](https://www.rsc.org/images/entities/char_2009.gif) 1.45.
1.45.
3. Results and discussion
The synthetic process is shown in Fig. 1. Under heating conditions, CoNiMn-LDH with a hollow cubic structure is prepared by an in situ cationic etching method (Fig. 1a). When the reaction proceeds, the interior of ZIF-67 becomes frail and is transformed into a hollow cubic structure of CoNi-LDH. Through the introduction of manganese, the prepared CoNiMn-LDH material still retains the hollow structure. The synthesis of Bi2O3 derived from Bi-MOF is shown in Fig. 1b. Firstly, Bi-MOF is prepared by a hydrothermal method using DMF, trimesic acid and bismuth as the solvent, organic ligand and metal source, respectively. Secondly, Bi2O3 derived from Bi-MOF is synthesized under alkaline conditions. Finally, CoNiMn-LDH is used as the cathode and Bi2O3 as the anode to assemble a full battery as shown in Fig. 1c. XRD was performed to ascertain the crystal structure of electrode materials, and the results are shown in Fig. 2a. The diffraction peaks of ZIF-67 are in agreement with those reported in the literature.20,21 For CoNi-LDH, it can be found that the diffraction peaks belonging to ZIF-67 have fully disappeared, indicating that ZIF-67 has been completely converted into CoNi-LDH. Meanwhile, the strong diffraction peaks at 11.30°, 21.74°, 33.87° and 60.13° can be indexed to the (003), (006), (101) and (110) lattice planes, illustrating that CoNi-LDH has been successfully synthesized. As is known, Co, Ni and Mn are structurally similar in the ternary hydroxide M(OH)2 (M = Ni, Mn and Co). Co ions are partially replaced by Ni ions and Mn ions in CoNiMn(OH)6, making it hard to differentiate the diffraction peaks.22,23 When Mn ions are introduced, the diffraction peaks of (006), (101) and (110) move slightly to the left, indicating that manganese ions lead to a larger interlayer spacing. Nitrogen adsorption–desorption isotherms are used to ascertain the pore structure of CoNi-LDH and CoNiMn-LDH (Fig. S1†). It is clear that both CoNi-LDH and CoNiMn-LDH are mesoporous structures, which all belong to type IV isotherms and have obvious H3 type hysteresis loops. CoNi-LDH and CoNiMn-LDH have specific surface areas of 173.54 m2 g−1 and 230.93 m2 g−1, respectively. The average pore size of CoNiMn-LDH (9 nm) calculated by the Barrett–Joyner–Halenda (BJH) method is higher than that of CoNi-LDH (7 nm). When the Mn element is introduced into CoNi-LDH, the specific surface area becomes larger, which is consistent with the previous XRD results. A wider interlayer spacing will lead to easier OH− migration, which is beneficial for improving the electrochemical performance during the charge and discharge process.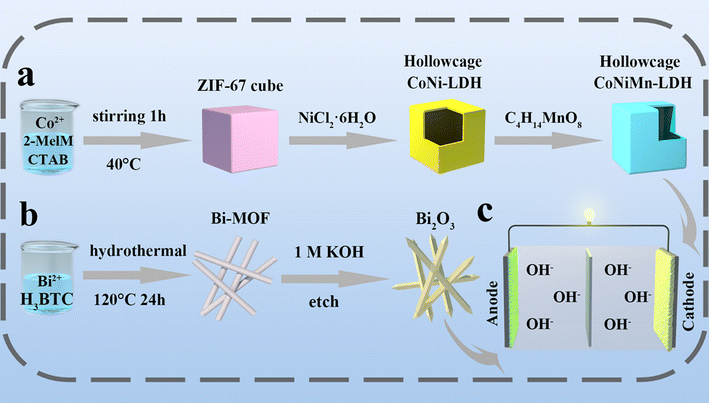 | ||
| Fig. 1 (a) Schematic diagram of CoNi-LDH and CoNiMn-LDH, (b) Bi2O3, and the (c) CoNiMn-LDH//Bi2O3 full battery. | ||
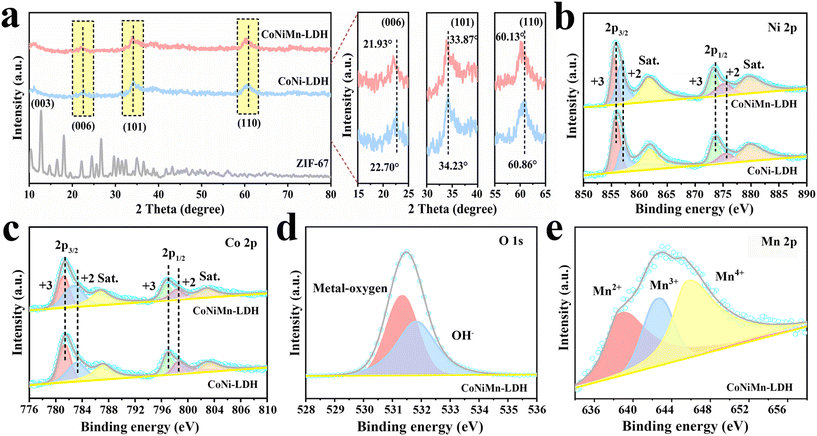 | ||
| Fig. 2 (a) XRD patterns of ZIF-67, CoNi-LDH and CoNiMn-LDH. (b and c) XPS spectra of Ni 2p and Co 2p and (d and e) O 1s and Mn 2p of CoNiMn-LDH. | ||
The surface composition and electronic states of CoNi-LDH and CoNiMn-LDH were studied by XPS. The total XPS spectrum of CoNiMn-LDH confirmed the coexistence of O, Co, Ni and Mn elements, while CoNi-LDH contained only Ni, Co and O elements (Fig. S2†). The two major peaks of CoNi-LDH that appeared at 856.10 and 873.75 eV are assigned to Ni 2p3/2 and Ni 2p1/2 in the Ni 2p spectrum (Fig. 2b). Moreover, two satellite peaks appeared at 861.88 eV and 879.63 eV, respectively. The typical peaks at 857.02 and 875.49 eV belong to Ni2+, and the peaks at 855.73 eV and 873.46 eV can verify the presence of Ni3+. After Mn doping, the peaks belonging to Ni3+ and Ni2+ are shifted to the left, and the peak area of Ni2+ becomes larger, confirming that the introduction of Mn induces partial conversion of Ni3+ into Ni2+.24 The Co 2p spectrum of CoNiMn-LDH can be attributed to six peaks (Fig. 2c). Thereinto, the peaks at 781.19 eV and 796.73 eV belong to Co3+ 2p3/2 and Co3+ 2p1/2, and the peaks at 782.67 eV and 798.34 eV come from Co2+ 2p3/2 and Co2+ 2p1/2, respectively. The two peaks at 785.2 eV and 802.5 eV are satellite features of Co 2p. Compared to CoNi-LDH, the Co 2p peaks of CoNiMn-LDH show a shift towards the direction of lower binding energy. The shift of Co 2p peaks after doping Mn indicates the transport of electrons from Mn atoms to Co atoms, which effectively enhances the delocalization of the Co central electron cloud and increases the electrical conductivity.25–27 The O 1s spectrum of CoNiMn-LDH (Fig. 2d) can be decomposed into two peaks at 531.34 and 531.88 eV respectively, related to metal–O (Ni–O, Co–O, Mn–O) and adsorbed hydroxyl groups. Similarly, the peaks corresponding to metal–O (Co–O, Ni–O) and adsorbed hydroxyl groups can also be observed in CoNi-LDH (Fig. S3†). In Fig. 2e, the peaks at 645.86 eV, 642.75 eV and 639.13 eV are attributed to Mn4+, Mn3+ and Mn2+, respectively.28 The presence of Mn2+/Mn4+ ions in materials can improve the capacity, enlarge the carrier mobility, and reduce the surface hydrogen desorption energy. Among them, Mn3+ ions may facilitate conversion during redox reactions.29–31
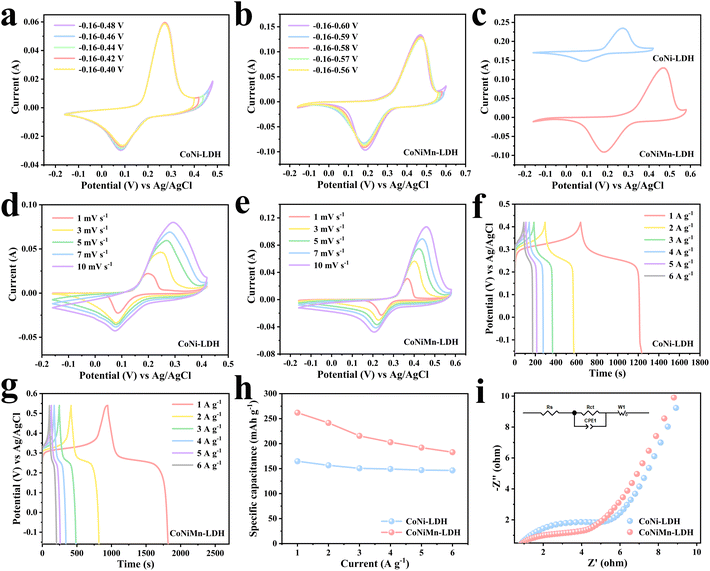
The morphologies of ZIF-67, CoNi-LDH and CoNiMn-LDH were studied by SEM. In Fig. 3a and Fig S4,† ZIF-67 shows a cubic structure. Ni2+ ions are applied to etch ZIF-67 templates to acquire CoNi-LDH. As can be seen from Fig. 3b, CoNi-LDH perfectly inherits the cubic structure of ZIF-67. Through SEM under magnification (Fig. S5†), the structure of CoNi-LDH is transformed into hollow cubes. EDS mapping (Fig. 3c–f) shows that the Co, Ni, and O elements are uniformly distributed in CoNi-LDH. In Fig. 3g, it is clearly shown that CoNiMn-LDH still maintains a hollow cubic structure after the introduction of the Mn element. According to the magnified SEM image in Fig. 3h, CoNiMn-LDH with a hollow cubic structure is further verified, validating that the etching of Mn ions does not change the morphology. In addition, EDS mapping is used to analyze the distribution of Co, Ni, O and Mn elements in CoNiMn-LDH (Fig. 3i–m), suggesting that Ni, Co, O and Mn elements are evenly distributed. In order to study the electrochemical performance, CV, GCD and EIS tests were performed in 6 mol L−1 KOH solution. To determine the voltage windows of CoNi-LDH and CoNiMn-LDH, CV tests were performed at different voltage windows. The oxygen evolution reaction occurs when the voltage of CoNi-LDH is greater than 0.42 V (Fig. 4a). In Fig. 4b, while manganese ions are introduced into CoNi-LDH, the voltage window is widened, and the voltage of the oxygen evolution reaction is greater than 0.58 V. Ultimately, the voltage window of CoNi-LDH is −0.16–0.42 V and that of CoNiMn-LDH is −0.16–0.58 V (Fig. 4c). In Fig. 4d, a pair of distinct redox peaks of CoNi-LDH can be seen. With the increase of scan rates, the position of the peaks shifts slightly, which is caused by the polarization of the electrode. The CV curves of the CoNiMn-LDH cathode are shown at different scan rates in Fig. 4e, which also shows a pair of redox peaks similar to CoNi-LDH. As the scan rates increase from 1 mV s−1 to 10 mV s−1, the shape of the CV curves only shows a slight change, which shows good reversibility. GCD curves of the CoNi-LDH cathode show two distinct platforms at different current densities (Fig. 4f), which are characteristic of a typical Faraday reaction. The charging and discharging platforms can be seen clearly in Fig. 4g. The charge–discharge time of CoNiMn-LDH is longer than that of CoNi-LDH at any current densities, indicating that the capacity of CoNiMn-LDH is higher than that of CoNi-LDH at any current densities. Based on the computing formula of Cm, the specific capacity can be calculated using GCD curves. In Fig. 4h, the capacity of CoNiMn-LDH is higher than that of CoNi-LDH at any current densities, further confirming that the introduction of manganese ions can increase the capacity. Furthermore, the electrochemical impedance spectroscopy (EIS) technique was applied to research the chemical kinetics. As shown in Fig. 4i, EIS curves comprise high frequency and low frequency regions. The diameter of the semicircle in the high frequency region illustrates the charge transport resistance at the electrode/electrolyte interface, and the slope of the line segment in the low frequency region reflects the ion diffusion impedance in the electrolyte solution. The fitted values of the impedance parameters are listed in Table S1.† It is clear that the values of charge transport impedance (Rct, 4.407 Ω) and ion diffusion impedance (Rs, 0.598 Ω) for CoNiMn-LDH are lower than those of Rct (6.783 Ω) and Rs (0.646 Ω) for CoNi-LDH. Evidently, both the charge transport impedance and ion diffusion impedance of the CoNiMn-LDH cathode are smaller than those of CoNi-LDH, testifying the faster charge transport dynamics and ion diffusion dynamics.
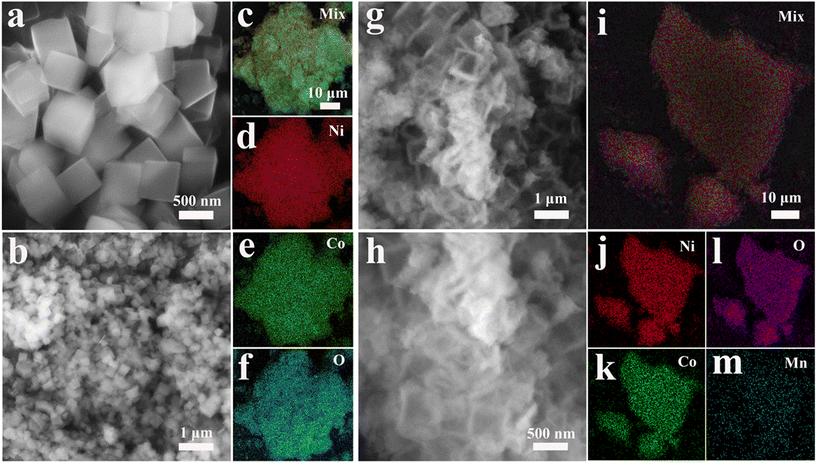 | ||
| Fig. 3 SEM images of (a) ZIF-67 and (b) CoNi-LDH. (c–f) EDS mapping of CoNi-LDH. (g and h) SEM images of CoNiMn-LDH. (i–m) EDS mapping of CoNiMn-LDH. | ||
The successful synthesis of Bi2O3 was proved by XRD and XPS tests. Fig. 5a shows the weak characteristic peaks of Bi-MOF, indicating its poor crystallinity. Obviously, the diffraction peaks belonging to Bi-MOF are not seen in Bi2O3, indicating that Bi-MOF has been completely transformed into Bi2O3. All diffraction peaks are in agreement with monoclinic phase Bi2O3 (JCPDS No. 41–1449), and no other peaks with impurity are seen, confirming the successful preparation of Bi2O3. The signal peaks of both Bi 4f and O 1s are clearly visible in Fig. 5b. The Bi 4f spectrum of Fig. 5c reveals two distinct peaks at 158.64 eV and 163.95 eV, which are attributed to the Bi 4f7/2 and Bi 4f5/2 spin orbitals of Bi3+.32 The O 1s spectrum is shown in Fig. 5d; the peak at 529.65 eV corresponds to the Bi–O bond generated by the unsaturated coordination of Bi and O. The peak at 531.35 eV is attributed to the O vacancy. The detailed structures were characterized by SEM. Fig. 5e clearly shows that Bi2O3 is composed of abundant nanorods. The uniform nanorod shape is further verified by an enlarged scanning image (Fig. 5f). EDS mapping (Fig. 5g–i) shows that the O and Bi elements are uniformly distributed.
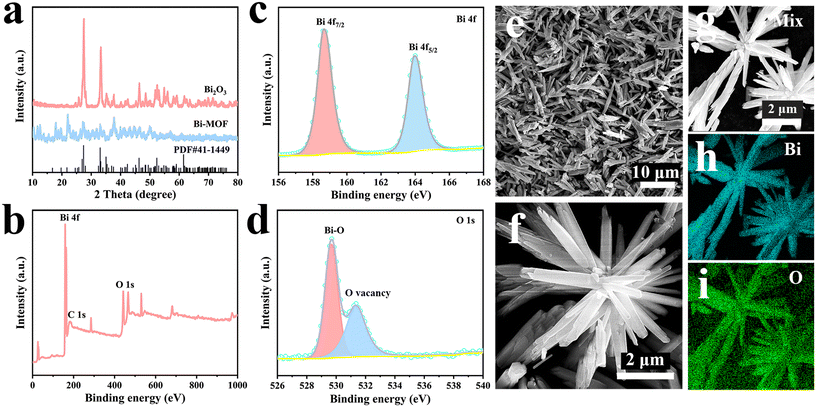 | ||
| Fig. 5 (a) XRD patterns of Bi-MOF and Bi2O3. (b) XPS survey of Bi2O3. (c and d) XPS spectrum of Bi 4f and O 1s of Bi2O3. (e and f) SEM images of Bi2O3. (g–i) EDS mapping of Bi2O3. | ||
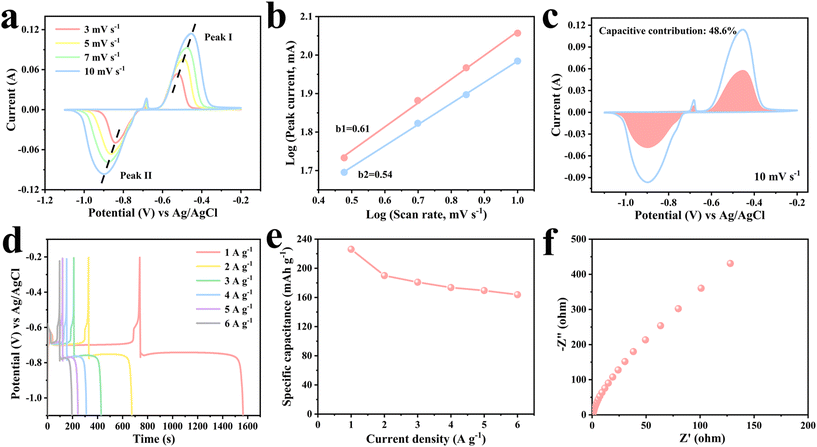
The electrochemical performance of Bi2O3 was evaluated using a three-electrode system with Bi2O3, a platinum sheet and a Ag/AgCl electrode as the working electrode, counter electrode and reference electrode, respectively. Fig. 6a shows the CV curves for Bi2O3 at diverse scan rates in the voltage window of −1.1 to −0.2 V. All the CV curves consisted of two oxidation peaks and one reduction peak. Specifically, the reduction peaks are mainly caused by the reduction of Bi3+ to metal Bi. The two consecutive oxidation peaks are related to the oxidation of Bi to Bi2+ and further oxidation to Bi3+. Hence, the inconspicuous oxidation peaks may be due to the formation of Bi2O2 intermediates. The total faradaic reactions might include 2Bi2O3 + 2H2O + 4e− ↔ 2Bi2O2 + 4OH− and Bi2O2 + 2H2O + 4e− ↔ 2Bi + 4OH−.33,34 With increasing scan rates, the shape of the continuous CV curves changes slightly, displaying good electrochemical performance and reversibility. In order to better understand the performance of Bi2O3, the reaction kinetics were investigated (Fig. 6b and c). The expression for the relationship between peak current (i) and scan rate (v) is represented by i = avb, where a and b are variable constants. Generally speaking, the value of b ranges between 0.5 and 1. When the value of b is close to 0.5, it implies a diffusion control mechanism. In contrast, when the value of b is close to 1, it indicates a capacitance control mechanism. In Fig. 6b, b1 = 0.61 and b2 = 0.54, indicating that diffusion and capacitance contributions are dominant. Capacitance contribution and diffusion contribution can be calculated by: i = k1v + k2v1/2, where k1v denotes capacitance contribution and k2v1/2 denotes diffusion contribution. Fig. 6c shows the CV curve of the Bi2O3 anode at 10 mV s−1 with the capacitance contribution (pink area) accounting for 48.6% of the overall charge storage capacity. The ultra-long charge–discharge platforms can be clearly seen in Fig. 6d. According to the GCD curves, the specific capacity of Bi2O3 is 226.1 mA h g−1 at 1 A g−1. As the current density increases to 6 A g−1, a high capacity of 163.8 mA h g−1 can still be achieved, indicating a good rate performance (Fig. 6e). Fig. 6f further reveals the low resistance and fast charge transport characteristics of Bi2O3, which contribute to the great electrochemical performance.
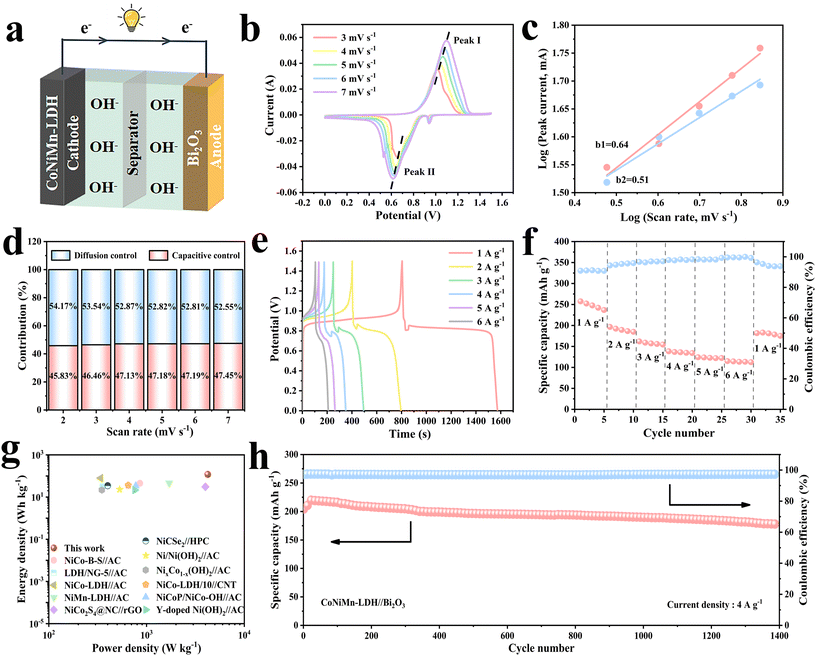
To better evaluate the feasibility for actual applications, a full battery was assembled using the CoNiMn-LDH cathode with a hollow cubic structure and the Bi2O3 anode with a rod-shaped structure in 6 M KOH electrolyte (Fig. 7a). CV curves with diverse voltage windows were obtained to determine the appropriate voltage at 10 mV s−1 (Fig. S6†). It shows that no polarization was observed in the CV curves below 1.5 V. When the voltage was above 1.5 V, the polarization phenomenon began to occur. Hence, 0–1.5 V is finally chosen as the voltage window of the full battery. The CV curves are shown at diverse scan rates in Fig. 7b. Obviously, as the scan rate increases, there are only extremely small changes in the shape of CV curves, testifying a great rate performance. The slope obtained by linear fitting of log(i) to log(v) is exhibited in Fig. 7c. It is noteworthy that b1 = 0.64 and b2 = 0.51, and the b value is closer to 0.5, affirming that diffusion control plays a leading role. The contributions of these two processes at other scan rates are exhibited in Fig. 7d. As the scan rate increases, the capacitance contribution increases. The capacitance contribution is 45.83% at a scan rate of 2 mV s−1. Accordingly, it is 47.45% at a scan rate of 7 mV s−1. In the light of the Nyquist diagram in Fig. S7,† the straight line with angles greater than 45° in the low frequency region indicates a low ion diffusion resistance, implying great diffusion dynamics. The GCD curves for the full battery are shown in Fig. 7e. It is noteworthy that all the GCD curves have obvious charge–discharge platforms, which correspond to the redox peaks of the CV curves. The rate performance of the full battery is shown in Fig. 7f. The battery is cycled five times at each current density of 1 A g−1, 2 A g−1, 3 A g−1, 4 A g−1, 5 A g−1 and 6 A g−1 with the corresponding specific capacities of 247.32 mA h g−1, 189.98 mA h g−1, 157.7 mA h g−1, 136.1 mA h g−1, 123.04 mA h g−1 and 113.7 mA h g−1, respectively. The coulombic efficiency is greater than 95% at different rates. The power density and energy density are momentous indexes to assess battery performance, so they are calculated and demonstrated in the Ragone diagram (Fig. 7g).35 Compared to some previously reported aqueous batteries and asymmetric supercapacitors, our work achieves a higher energy density of 120 W h kg−1 at a power density of 4219 W kg−1, indicating that this work has great potential in real life (Table S2†). Cycling performance is also critical for practical applications. The capacity of the battery shows an increasing trend in the initial 20 cycles, due to rapid redox and then gradual activation of electrode materials at a high current density of 4 A g−1. After 1400 cycles, its capacity remains 87% at 4 A g−1, accompanied by excellent coulombic efficiency (Fig. 7h).
4. Conclusions
In summary, the CoNiMn-LDH cathode with a hollow cubic structure and the Bi2O3 anode with a rod-shaped structure derived from MOF templates were successfully prepared by a simple hydrothermal method. Through a series of electrochemical tests, compared with binary CoNi-LDH, the ternary CoNiMn-LDH has a larger voltage window, higher capacity, and faster charge transport dynamics and ion diffusion dynamics, verifying that the introduction of the Mn element successfully improves the capacity and the charge transport kinetics. A full battery assembled with the CoNiMn-LDH cathode and the Bi2O3 anode exhibits a high specific capacity of 247.32 mA h g−1 at 1 A g−1. It exhibited cycling stability for up to 1400 cycles and its capacity retention was 87% at 4 A g−1. In addition, a high energy density of 120 W h kg−1 could also be achieved at a power density of 4219 W kg−1. This study provides an instructive paradigm for the design and preparation of advanced electrode materials for full batteries.Conflicts of interest
There are no competing financial conflicts for the authors to declare.Acknowledgements
This work is supported by the National Natural Science Foundation of China (22269024), Ph.D. Research Startup Foundation of Yan'an University (YDBK2020-22), and Technology Innovation Leading Program of Shaanxi (2022QFY07-04), Joint Project between Department of Science & Technology and the Local Government in Shaanxi (2022GD-TSL-66, 2022GD-TSL-68).References
- S. Natarajan and V. Aravindan, An Urgent Call to Spent LIB Recycling: Whys and Wherefores for Graphite Recovery, Adv. Energy Mater., 2020, 10, 2002238 CrossRef CAS.
- J. B. Goodenough and Y. Kim, Challenges for Rechargeable Li Batteries, Chem. Mater., 2009, 22, 587–603 CrossRef.
- X.-Q. Zhang, X. Chen, X.-B. Cheng, B.-Q. Li, X. Shen, C. Yan, J.-Q. Huang and Q. Zhang, Highly Stable Lithium Metal Batteries Enabled by Regulating the Solvation of Lithium Ions in Nonaqueous Electrolytes, Angew. Chem., Int. Ed., 2018, 57, 5301–5305 CrossRef CAS PubMed.
- B. Dunn, H. Kamath and J. M. Tarascon, Electrical energy storage for the grid: a battery of choices, Science, 2011, 334, 928–935 CrossRef CAS PubMed.
- F. Croce, G. B. Appetecchi, L. Persi and B. Scrosati, Nanocomposite polymer electrolytes for lithium batteries, Nature, 1998, 394, 456–458 CrossRef CAS.
- E. Quartarone and P. Mustarelli, Electrolytes for solid-state lithium rechargeable batteries: recent advances and perspectives, Chem. Soc. Rev., 2011, 40, 2525–2540 RSC.
- Y. Morioka, S. Narukawa and T. Itou, State-of-the-art of alkaline rechargeable batteries, J. Power Sources, 2001, 100, 107–116 CrossRef CAS.
- Y. Liu, G. He, H. Jiang, I. P. Parkin, P. R. Shearing and D. J. L. Brett, Cathode Design for Aqueous Rechargeable Multivalent Ion Batteries: Challenges and Opportunities, Adv. Funct. Mater., 2021, 31, 2010445 CrossRef CAS.
- J. Zhang, L. Yu, Y. Chen, X. F. Lu, S. Gao and X. W. D. Lou, Designed Formation of Double-Shelled Ni-Fe Layered-Double-Hydroxide Nanocages for Efficient Oxygen Evolution Reaction, Adv. Mater., 2020, 32, 1906432 CrossRef CAS PubMed.
- J. Zhang, Z. Li, Y. Chen, S. Gao and X. W. D. Lou, Nickel-Iron Layered Double Hydroxide Hollow Polyhedrons as a Superior Sulfur Host for Lithium-Sulfur Batteries, Angew. Chem., Int. Ed., 2018, 57, 10944–10948 CrossRef CAS PubMed.
- C. Kang, J. Fang, X. Liu, S. Li, S. Wan, L. Fu and Q. Liu, A novel fabricated conductive substrate for enhancing the mass loading of NiCoLDH nanosheets for high areal specific capacity in hybrid supercapacitors, Electrochim. Acta, 2021, 368, 137621 CrossRef CAS.
- P. Sivakumar, M. Jana, M. G. Jung, P. Nakhanivej, B. Y. Xia and H. S. Park, Ultrafast and reversible anion storage of spinel nanoarchitecture for high-performance alkaline zinc full cells, Appl. Phys. Rev., 2021, 8, 021408 CAS.
- Q. Dou, N. Wu, H. Yuan, K. H. Shin, Y. Tang, D. Mitlin and H. S. Park, Emerging trends in anion storage materials for the capacitive and hybrid energy storage and beyond, Chem. Soc. Rev., 2021, 50, 6734–6789 RSC.
- H. Liang, J. Lin, H. Jia, S. Chen, J. Qi, J. Cao, T. Lin, W. Fei and J. Feng, Hierarchical NiCo-LDH@NiOOH core-shell on heterostructure carbon fiber cloth as battery-like electrode for supercapacitor, J. Power Sources, 2018, 378, 248–254 CrossRef CAS.
- X. Cai, X. Shen, L. Ma, Z. Ji, C. Xu and A. Yuan, Solvothermal synthesis of NiCo-layered double hydroxide nanosheets decorated on RGO sheets for high performance supercapacitor, Chem. Eng. J., 2015, 268, 251–259 CrossRef CAS.
- V. Kuraganti, A. Jain, R. Bar-Ziv, A. Ramasubramaniam and M. Bar-Sadan, Manganese Doping of MoSe2 Promotes Active Defect Sites for Hydrogen Evolution, ACS Appl. Mater. Interfaces, 2019, 11, 25155–25162 CrossRef CAS.
- Z. Zhang, H. Huo, L. Wang, S. Lou, L. Xiang, B. Xie, Q. Wang, C. Du, J. Wang and G. Yin, Stacking fault disorder induced by Mn doping in Ni(OH)2 for supercapacitor electrodes, Chem. Eng. J., 2021, 412, 128617 CrossRef CAS.
- Y. Wang, D. Yan, S. El Hankari, Y. Zou and S. Wang, Recent Progress on Layered Double Hydroxides and Their Derivatives for Electrocatalytic Water Splitting, Adv. Sci., 2018, 5, 1800064 CrossRef PubMed.
- Y. Chen, W. Du, B. Dou, J. Chen, L. Hu, A. Zeb and X. Lin, Metal–organic frameworks and their derivatives as electrode materials for Li-ion batteries: a mini review, CrystEngComm, 2022, 24, 2729–2743 RSC.
- J. Yang, F. Zhang, H. Lu, X. Hong, H. Jiang, Y. Wu and Y. Li, Hollow Zn/Co ZIF Particles Derived from Core-Shell ZIF-67@ZIF-8 as Selective Catalyst for the Semi-Hydrogenation of Acetylene, Angew. Chem., Int. Ed., 2015, 54, 10889–10893 CrossRef CAS PubMed.
- Y. Zhou, X. Tong, N. Pang, Y. Deng, C. Yan, D. Wu, S. Xu, D. Xiong, L. Wang and P. K. Chu, Ni3S2 Nanocomposite Structures Doped with Zn and Co as Long-Lifetime, High-Energy-Density, and Binder-Free Cathodes in Flexible Aqueous Nickel-Zinc Batteries, ACS Appl. Mater. Interfaces, 2021, 13, 34292–34300 CrossRef CAS PubMed.
- C. Hao, X. Wang, X. Wu, Y. Guo, L. Zhu and X. Wang, Composite material CCO/Co-Ni-Mn LDH made from sacrifice template CCO/ZIF-67 for high-performance supercapacitor, Appl. Surf. Sci., 2022, 572, 151373 CrossRef CAS.
- H. Hosseini and S. Shahrokhian, Self-supported nanoporous Zn–Ni–Co/Cu selenides microball arrays for hybrid energy storage and electrocatalytic water/urea splitting, Chem. Eng. J., 2019, 375, 122090 CrossRef CAS.
- J. Zhu, Y. Zhu and W. Zhou, Cu-doped Ni-LDH with abundant oxygen vacancies for enhanced methyl 4-hydroxybenzoate degradation via peroxymonosulfate activation: key role of superoxide radicals, J. Colloid Interface Sci., 2022, 610, 504–517 CrossRef CAS PubMed.
- X. Chen, W. Li, C. Gong, X. He, H. Chen, X. Du, W. Fang, L. Yang and L. Zhao, ZIF-67-derived Mn doped Co9S8 supported on N-Enriched porous carbon polyhedron as an efficient electrocatalyst for oxygen evolution reaction, Int. J. Hydrogen Energy, 2021, 46, 38724–38732 CrossRef CAS.
- Y. Zhong, B. Chang, Y. Shao, C. Xu, Y. Wu and X. Hao, Regulating Phase Conversion from Ni3Se2 into NiSe in a Bifunctional Electrocatalyst for Overall Water-Splitting Enhancement, ChemSusChem, 2019, 12, 2008–2014 CrossRef CAS PubMed.
- I. C. Man, H. Y. Su, F. Calle–Vallejo, H. A. Hansen, J. I. Martínez, N. G. Inoglu, J. Kitchin, T. F. Jaramillo, J. K. Nørskov and J. Rossmeisl, Universality in Oxygen Evolution Electrocatalysis on Oxide Surfaces, ChemCatChem, 2011, 3, 1159–1165 CrossRef CAS.
- S. Liu, H. Nan, L. Li, T. Qin, L. Cai, W. Zhang and W. Zheng, Unlocking the optimum supercapacitance of Co3O4 by reducing the Co valence state via Mn doping, Mater. Today Commun., 2021, 28, 102665 CrossRef CAS.
- J. Lee, D. A. Kitchaev, D.-H. Kwon, C.-W. Lee, J. K. Papp, Y.-S. Liu, Z. Lun, R. J. Clément, T. Shi, B. D. McCloskey, J. Guo, M. Balasubramanian and G. Ceder, Reversible Mn2+/Mn4+double redox in lithium-excess cathode materials, Nature, 2018, 556, 185–190 CrossRef CAS PubMed.
- J. Chen, X. Wang, J. Wang and P. S. Lee, Sulfidation of NiMn-Layered Double Hydroxides/Graphene Oxide Composites toward Supercapacitor Electrodes with Enhanced Performance, Adv. Energy Mater., 2016, 6, 1501745 CrossRef.
- H. C. Chen, Y. Qin, H. Cao, X. Song, C. Huang, H. Feng and X. S. Zhao, Synthesis of amorphous nickel–cobalt–manganese hydroxides for supercapacitor-battery hybrid energy storage system, Energy Storage Mater., 2019, 17, 194–203 CrossRef.
- P. Deng, F. Yang, Z. Wang, S. Chen, Y. Zhou, S. Zaman and B. Y. Xia, Metal-Organic Framework-Derived Carbon Nanorods Encapsulating Bismuth Oxides for Rapid and Selective CO2 Electroreduction to Formate, Angew. Chem., Int. Ed., 2020, 59, 10807–10813 CrossRef CAS PubMed.
- J. Chang, W. Liang, W. Wang, D. Wu, K. Jiang, G. Wang, F. Xu and Z. Gao, Oxygen vacancies enriched Bi2O3 as high capacity and high rate negative material for aqueous alkali battery, Appl. Surf. Sci., 2022, 601, 154296 CrossRef CAS.
- G. Zan, T. Wu, P. Hu, Y. Zhou, S. Zhao, S. Xu, J. Chen, Y. Cui and Q. Wu, An approaching-theoretical-capacity anode material for aqueous battery: Hollow hexagonal prism Bi2O3 assembled by nanoparticles, Energy Storage Mater., 2020, 28, 82–90 CrossRef.
- R. Hou, G. S. Gund, K. Qi, P. Nakhanivej, H. Liu, F. Li, B. Y. Xia and H. S. Park, Hybridization design of materials and devices for flexible electrochemical energy storage, Energy Storage Mater., 2019, 19, 212–241 CrossRef.
Footnote |
| † Electronic supplementary information (ESI) available. See DOI: https://doi.org/10.1039/d3qi00962a |
| This journal is © the Partner Organisations 2023 |

