
Near-infrared photothermally activated DNA nanotweezers for imaging ATP in living cells†
Xiao-Qiong
Li
,
Dan
Luo
,
Juan
Song
,
Yi-Lei
Jia
,
Juan
Song
*,
Hong-Yuan
Chen
and
Jing-Juan
Xu
 *
*
State Key Laboratory of Analytical Chemistry for Life Science, School of Chemistry and Chemical Engineering, Nanjing University, Nanjing, 210023, China. E-mail: juansong@nju.edu.cn; xujj@nju.edu.cn
First published on 28th June 2022
Abstract
By assembling nanotweezers with ATP-splitting aptamers on gold nanorods (AuT123L), we constructed a near-infrared-activated ATP sensing device that could time-controllably image ATP levels in living cells. By replacing the aptamers on the nanotweezers, the nanoplatform can be applied to other important biomolecules, opening up more possibilities for the study of time controllable nanodevices.
Adenosine triphosphate (ATP) is a multifunctional nucleoside triphosphate, and is the major carrier of chemical energy in living species, playing a core role in energy metabolism and signal transduction.1,2 The intracellular ATP level is an indicator of many diseases, such as cardiovascular diseases, neurodegenerative diseases and some malignancies.3,4 Therefore, ATP detection is of great significance in biochemical research and clinical diagnosis.
Aptamers have become a promising analytical tool for the manufacture of nanodevices, due to their high affinity, good biocompatibility and unique programmable base-pairings.5–7 ATP aptamers have been widely used, but ATP aptamer-based fluorescent probe detection and living cell imaging still have some problems to be solved. Firstly, aptamer probes are difficult to be effectively transported into cells directly, because a single nucleic acid is difficult to internalize and is easily degraded by enzymes. Secondly, the probe is easily recognized by extracellular ATP before reaching the target location, resulting in signal leakage and a lack of accuracy in the detection of intracellular ATP. Finally, ATP aptamers can easily form secondary structures, which will inevitably lead to high background. Hence, developing a fluorescent probe that can detect ATP in a specific time with a high signal-to-noise ratio is still a desirable goal.
In order to improve the accuracy and controllability of DNA-based nanodevices, researchers have developed a number of controllable activation probes. Through reasonable design, the activity of these probes is inhibited and the “signal off” state is always maintained. When the probe enters the site to be detected, certain stimuli, such as ultraviolet (UV) light,8 near-infrared (NIR) light,9 pH10 and temperature11 can restore the activity of the probe, and then achieve the purpose of controllable activation. Compared with typical DNA fluorescent probes which remain in the “always on” state during delivery, controllable activation of the probe can greatly reduce the signal leakage generated during delivery, thus improving the accuracy of the detection results. At the same time, using nanoparticles as the carrier carrying DNA probes can greatly improve the resistance of nucleic acids to enzyme degradation and facilitate the delivery of probes into cells.12
To circumvent the inherent defect that ATP aptamers can easily form secondary structures, researchers have proposed split aptamers, which split the nucleic acid aptamer into two fragments while retaining the ability to recognize ATP.13 When there is no object, split fragments are far away from each other, so few false positives or non-specific signals are generated. Therefore, it is widely used in biological analysis and detection.14 Although there are many fluorescent probes that use split aptamers to detect ATP in situ, probes that can accurately detect intracellular ATP with time controllable activation are still rare.
Here, we developed a time controllable method for the detection of intracellular ATP by assembling split ATP aptamers into tweezers (T123), and loading them onto the surface of gold nanorods (AuNRs). The probe was named AuT123L. We used split aptamers (parts of T2 and T3, listed in Table S1, ESI†) as the recognition units for the end of the tweezers, and a third chain (T1) was introduced to connect the two split aptamer fragments together. Cy3 and Cy5 fluorophores were modified at both ends of the third chain. Fluorescence resonance energy transfer (FRET) imaging allows quantitative analysis of the target using the ratio of the two fluorescence intensities, which increases the reliability of the probe compared to single-intensity sensing. The introduction of DNA nanotweezers can not only ensure the close distance between the two aptamer fragments, which was conducive to the recognition of the target, but also avoid the degradation of the binding ability of the aptamer caused by excessive modification. In addition, the efficiency of FRET can be adjusted by the proper design of the sequences. AuNR is used as a photothermal conversion agent, fluorescence quenching agent and carrier. As shown in Scheme 1a, DNA tweezers were bonded to AuNR through Lock chain (listed in Table S1, ESI†), and the melting temperature (Tm) of Lock and T2 was calculated to be 44.3 °C, which is suitable for subsequent photothermal trigger activation.
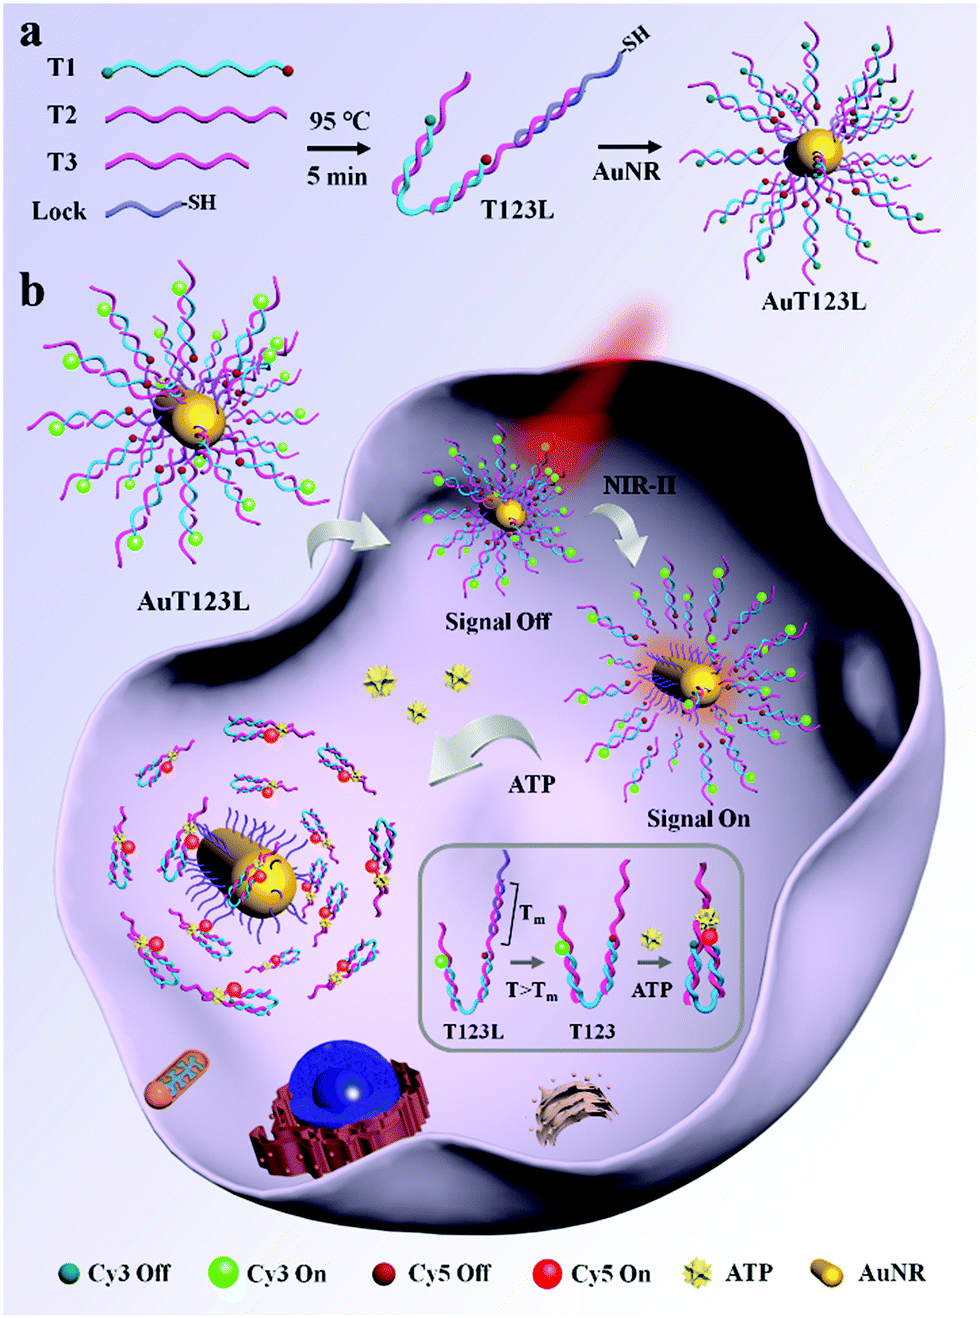 | ||
| Scheme 1 (a) Construction of the AuT123L nanoprobe. (b) Schematic illustration of the AuT123L nanoprobe for time controllable imaging of ATP in living cells. The inset is a schematic diagram of ATP recognition by DNA nanotweezers. The probe was excited at 525 nm. | ||
As shown in Scheme 1b, when the target is not present, two split aptamer fragments are separated in space and the FRET signal is closed. The AuT123L remained “signal-off” during delivery. After irradiating, the photoenergy is converted to heat, which will dissipate into the surroundings. The rise in temperature will cause the duplex DNA (T2 and Lock) to dehybridize and release the tweezers. Upon recognition of ATP, the split aptamer and the target will form a ternary complex, dragging the tweezers to close, bringing Cy3 and Cy5 into close proximity and FRET signals were generated.
To make the DNA nanodevice responsive to NIR-II light, we prepared the AuNRs according to a seed-mediated protocol.15 Transmission electron microscopy (TEM) images of the AuNR showed a narrow size distribution with a length of 92.23 ± 9.67 nm, and a diameter of 14.26 ± 1.29 nm, and the aspect ratio was about 6.47 (Fig. 1a). A UV-vis spectroscopy analysis showed a longitudinal plasmon resonance peak of ∼1110 nm. As shown in Fig. 1b and c, we studied the photothermal capabilities of AuNRs. Different concentrations of AuNR solutions were irradiated by a NIR-II laser (1064 nm, 1 W cm−2). As the irradiation time increased, 50 μg mL−1 AuNRs could rise from room temperature to 54 °C in 10 min, while the control group could only rise to 36 °C. In addition, we demonstrated that AuNRs have good photothermal stability with a photothermal conversion efficiency of 27.89% (Fig. S1, ESI†), which met the requirements of photothermal triggering probes.
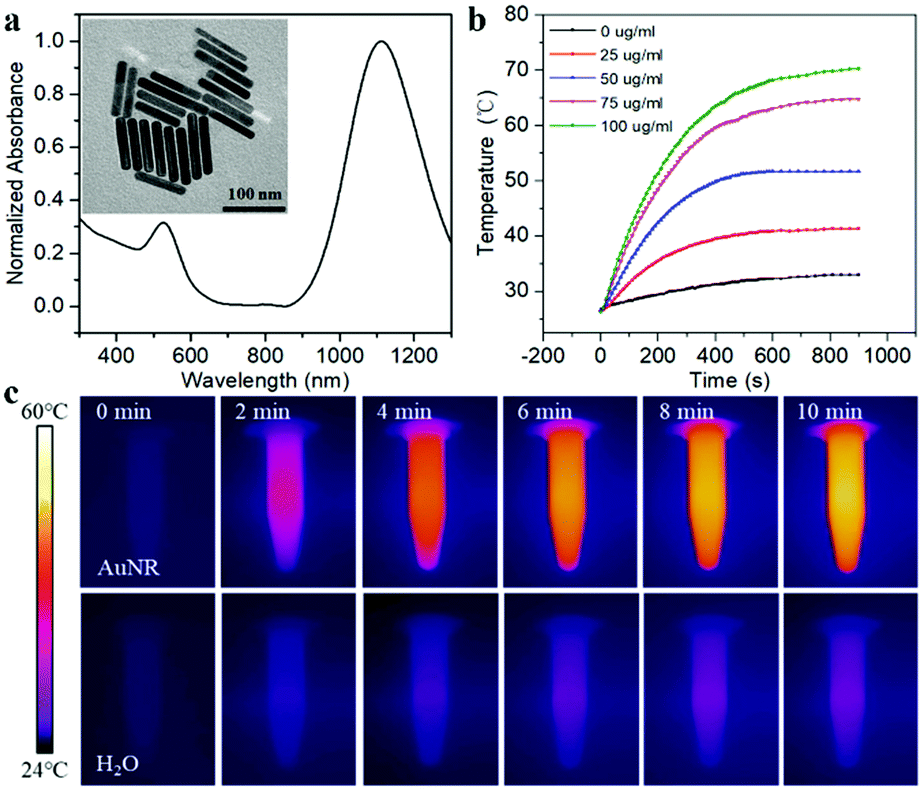 | ||
| Fig. 1 (a) UV-Vis absorption spectra and TEM of AuNRs. (b) Photothermal activity of AuNRs with different concentrations under 1064 nm laser irradiation (1 W cm−2). (c) Thermal images of AuNR solutions and pure H2O after irradiating for 0, 2, 4, 6, 8 and 10 min. | ||
As shown in Fig. 2a, Lane 7 was the hybridization of T1, T2 and T3, which we named T123, and Lane 8 was T123L which was made of T1, T2, T3 and Lock. The results of gel electrophoresis showed that the DNA nanotweezers were successfully assembled. Fig. S2 (ESI†) shows the formation of a new band after the addition of ATP, indicating that T123 can recognize the target. Then we explored the response of a single ATP aptamer, split aptamer and T123 to ATP (listed in Table S1, ESI†). We set the excitation wavelength at 525 nm, at which time only Cy3 can be excited, while Cy5 has no fluorescence signal. But when Cy3 and Cy5 approached, the fluorescence spectrum of Cy3 overlapped with the excitation spectrum of Cy5 to some extent, and the fluorescence energy was transferred from Cy3 to Cy5; thus, the enhancement of the Cy5 fluorescence signal was observed. In this work, FCy3 represents the fluorescence intensity of Cy3, FCy5 represents the fluorescence intensity of Cy5, and FCy5/FCy3 is used as the output signal. As shown in Fig. S3a (ESI†), in the absence of the target, the signal of Cy5 was obvious, indicating that Cy3 and Cy5 were very close before the addition of ATP, which is due to the fact that ATP aptamers themselves easily form secondary structures. As shown in Fig. S3b (ESI†), after the addition of 2 mM ATP, the output FCy5/FCy3 signal is 0.570, which is only 1.28 times that of the background signal (0.446). The split aptamer can greatly reduce background signals. As shown in Fig. S3c and d (ESI†), the split aptamer dispersed freely in solution was used to recognize ATP. The results showed a signal decrease in Cy3, while signal changes in Cy5 were barely noticeable. To improve the signal-to-noise ratio and allow us to adjust the FRET efficiency, we used a chain as a bridge to confine the two split fragments in a small space. It can be seen from Fig. S3e and f (ESI†) that the initial signal of the probe was extremely low, with FCy5/FCy3 only 0.015. After the addition of 2 mM ATP, the FCy5/FCy3 signal was enhanced 13.3 times, suggesting that our nanotweezers have a higher FRET efficiency compared to the freely dispersed split aptamer. Fig. 2b shows that T123 has the highest signal-to-noise ratio compared with the single aptamer and split aptamer. Then time-dependent fluorescence analysis was monitored to investigate the reaction kinetics of T123. Upon addition of ATP, the T123 exhibited a swift fluorescence and quickly reached a plateau in 2 min (Fig. 2c).
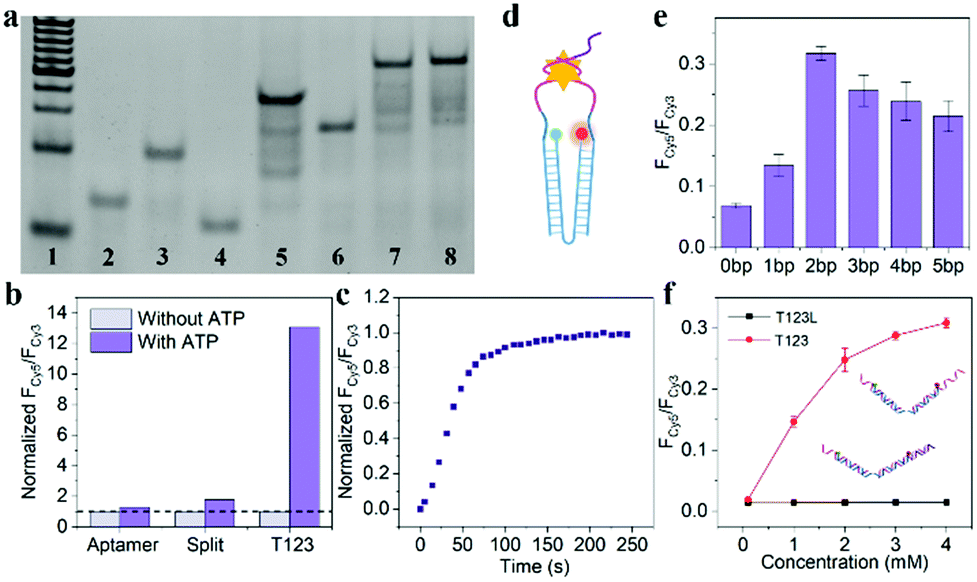 | ||
Fig. 2 (a) Gel electrophoresis. Line 1–8![[thin space (1/6-em)]](https://www.rsc.org/images/entities/char_2009.gif) :20 bp marker, T1, T2, T3, T1 + T2, T1 + T3, T1 + T2 + T3, T1 + T2 + T3 + Lock. (b) The response of ATP aptamer, split aptamer and T123 to ATP. The background signals were normalized separately (dotted line). (c) Time-dependent fluorescence spectra of T123 in response to 2 mM ATP. (d) Schematic diagram of the nano-tweezers. (e) The probe with a different number of inserted bases were utilized as a target model. (f) Fluorescence spectra of the T123 and T123L responding to ATP at different concentrations, respectively. The samples were excited at 525 nm. :20 bp marker, T1, T2, T3, T1 + T2, T1 + T3, T1 + T2 + T3, T1 + T2 + T3 + Lock. (b) The response of ATP aptamer, split aptamer and T123 to ATP. The background signals were normalized separately (dotted line). (c) Time-dependent fluorescence spectra of T123 in response to 2 mM ATP. (d) Schematic diagram of the nano-tweezers. (e) The probe with a different number of inserted bases were utilized as a target model. (f) Fluorescence spectra of the T123 and T123L responding to ATP at different concentrations, respectively. The samples were excited at 525 nm. | ||
As shown in Fig. 2d and Fig. S4 (ESI†), to further improve the FRET efficiency of the probe, we inserted a variable number of bases (dark blue part) into the junction between the DNA tweezers (blue part) and the ATP-splitting aptamer (pink part). The sequences were listed in Table S2 (ESI†). Fig. 2e shows that the FRET efficiency between Cy3 and Cy5 on the DNA tweezers was not simply proportional to the number of bases inserted, and the efficiency reached its maximum at a two-base interval. That was because the FRET efficiency was affected not only by the donor–acceptor distance but also by the dipole relation between two fluorescent dyes.16 Finally, T2 and T3 with two-base intervals were selected for subsequent experiments. Finally, we explored the inhibition ability of the Lock chain. As shown in Fig. 2f, the FRET signal of T123 increased with increasing ATP concentration, while the fluorescence of the T123L probe did not increase significantly, indicating the efficient inhibition of the sensing activity of the T123 probe by introducing a complementary chain.
The recognition ability of T123 to ATP was detected by fluorescence in vitro. The results (Fig. 3a and b) showed that when ATP increased from 0.1 mM to 4 mM, FCy5/FCy3 increased 16-fold (from 0.019 to 0.309). The concentration of intracellular ATP ranges from 1–10 mM, and is usually less than 3 mM in HeLa cells.17 Therefore, our probe met the needs for subsequent detection of ATP in living cells. In addition, we examined the selectivity of the probe. As shown in Fig. 3c, analogue molecules of ATP such as cytidine triphosphate (CTP), guanosine triphosphate (GTP), and uridine triphosphate (UTP) did not change the fluorescence signal of the probe significantly, proving that the probe had high selectivity.
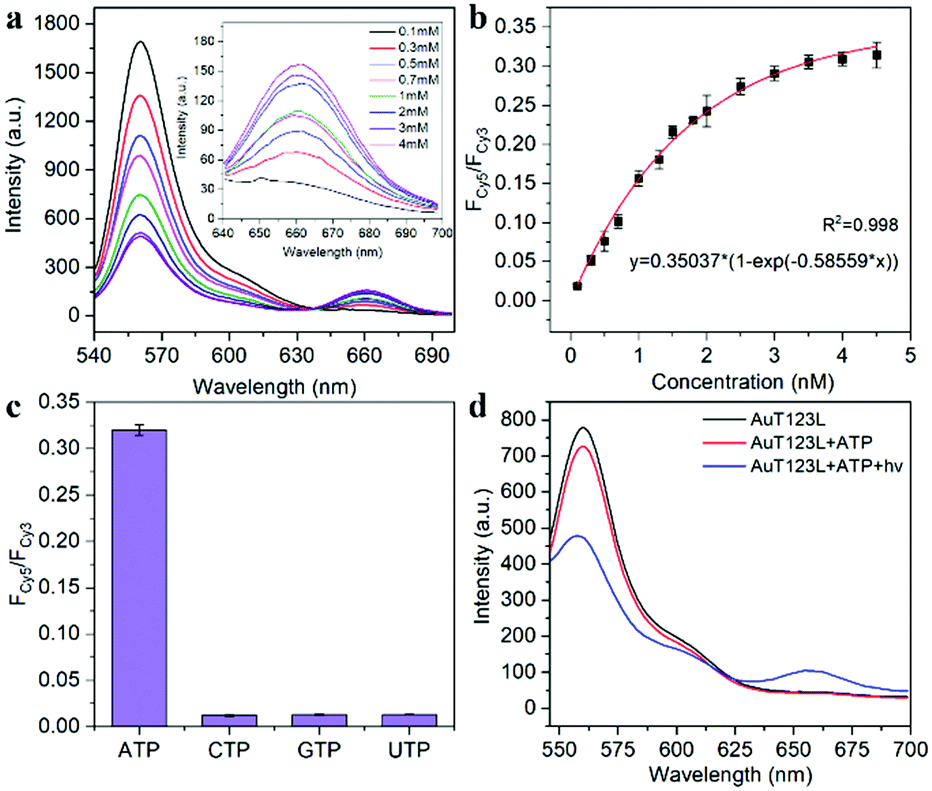 | ||
| Fig. 3 (a) Fluorescence spectra of the T123 response to different concentrations of ATP in vitro. (b) FRET ratio of FCy5/FCy3 as a function of ATP concentration. (c) FCy5/FCy3 of T123 with 4 mM ATP, CTP, GTP, UTP, respectively. (d) Fluorescence spectra of AuT123L and AuT123L with ATP before and after NIR irradiation. The probe was excited at 525 nm. | ||
To deliver the nucleic acid into cells, thiolated T123L was grafted onto the AuNRs via Au–S bonds. As shown in Fig. S5 (ESI†), the DLS experiment showed that the size of the probe increased by about 28.5 nm after DNA assembly, and the zeta potential changed from + 37.5 mV to −17.5 mV after the modification of mPEG-SH and T123L. After laser irradiation removed T123, the zeta potential changed to −12.7 mV. As shown in Fig. S6 (ESI†), we proved that the average number of T123L attached to each AuNR was about 92. Fig. 3d shows that the FRET signal increased significantly only in the presence of ATP after laser irradiation, proving that DNA nanotweezers could be thermodynamically released by NIR laser irradiation, thus restoring the ability to recognize ATP.
Before investigating the response of AuT123L in living cells, we first studied the toxicity of the probe. As shown in Fig. S7a (ESI†), AuT123L has low cytotoxicity when the probe concentration was lower than 50 μg mL−1. Meanwhile, we found that the NIR-laser exposure induced slight cytotoxicity to HeLa cells in 10 min (Fig. S7b, ESI†). When HeLa cells were incubated with AuT123L, the cell viability decreased gradually with the extension of the laser irradiation time (Fig. S7c and S8a, ESI†), which was due to photothermal ablation induced by AuT123L. Additionally, the results of the live-dead-apoptotic staining assay (Fig. S7d and S8b, ESI†) were consistent with those of the MTT assay. Therefore, we chose 5 min as the laser irradiation time to ensure low photothermal toxicity of the probe and appropriate probe release efficiency.
Then, we evaluated the applicability of AuT123L for NIR-activated imaging of ATP in living cells. Fig. S9 (ESI†) shows that the fluorescence intensity was remarkably reduced by 4 °C incubation, indicating that the uptake of AuT123L is an energy-dependent process. Co-localization experiments showed that AuT123L could escape from acidic organelles into the cytoplasm (Fig. S10, ESI†). After incubating AuT123L into cells, one group was irradiated with a NIR laser and the other group was left untreated. As shown in Fig. S11 (ESI†), no recovery of the FRET signal was detected in the Cy5 channel in the absence of laser exposure. However, a FRET signal was observed after NIR-II laser irradiation, due to a rise in temperature around AuNR caused by laser irradiation, which released T123 and restored its ability to recognize ATP. The results showed that the probe could remain inactive during the delivery process and could be activated remotely by a NIR laser to achieve the purpose of temporal control detection.
In order to further prove that the signal of the probe was derived from endogenous ATP, we changed the intracellular ATP level through exogenous stimulation. Oligomycin is reported to be a well-known ATP inhibitor, and Ca2+ is commonly used as an ATP inducer.17 Before incubation of the probe, HeLa cells were treated with 10 μM oligomycin or 5 mM Ca2+ for 30 min. After incubation with the probe, the cells were irradiated with a laser for 5 min. As shown in Fig. 4, we collected the fluorescence intensity of Cy3 and Cy5 from the three groups of cell samples, and extracted the fluorescence intensity using Image-J. The results showed that, compared with the control group, oligomycin-treated cells had significantly weaker FRET signals, while Ca2+-treated cells had stronger FRET signals. This experiment showed that the photothermal triggered probe that we constructed could successfully image the ATP level in living cells.
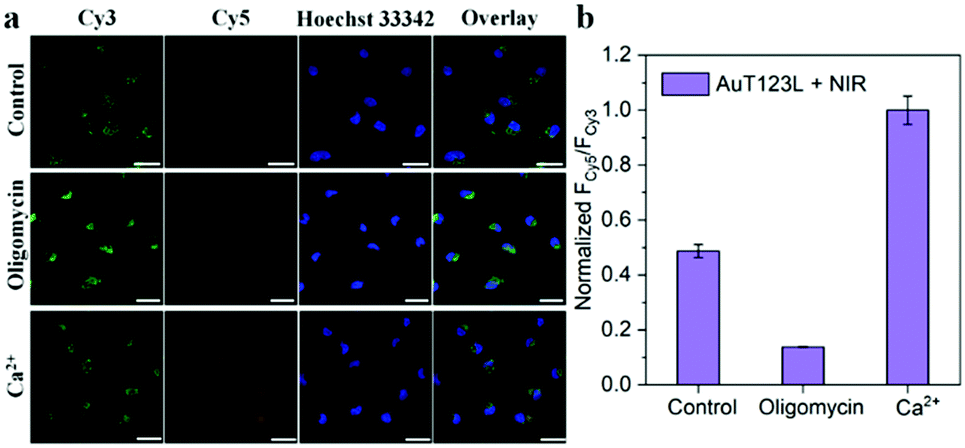 | ||
| Fig. 4 (a) Fluorescence images of HeLa cells incubated with AuT123L after medium, 10 μM oligomycin and 5 mM Ca2+ treatment, followed by irradiation with a 1064 nm laser (1 W cm−2). (b) The normalized intensity of FCy5/FCy3 in HeLa cells according to the confocal microscopy data, which were obtained by Image-J. The excitation wavelength was 488 nm, and the emissions were collected in the range of 525–600 nm (Cy3 channel) and 640–720 nm (Cy5 channel), respectively. The scale bar is 25 μm. | ||
In conclusion, we successfully constructed a nanosystem remotely activated by a NIR-II laser, and realized temporally controllable monitoring of ATP in living cells by measuring the FRET signal. Nanotweezers containing split aptamers were assembled with AuNRs. NIR-II irradiation thermodynamically induced the numerous release of T123 on the surface of the AuNRs, restoring the ability to recognize ATP, and generating FRET signals for the detection of ATP in living cells. Our probe can avoid signal leakage during delivery, and we used a NIR-II laser as remote stimulation, which facilitated application in works requiring deeper tissue penetration. In addition, by changing the sequence of the recognition module, our platform can be applied to imaging and detection of other molecules, providing a general platform for the development of precise and controllable imaging of important biomolecules in living cells.
This work was supported by the National Key R&D Program of China (2021YFA0910003), the National Natural Science Foundation (21991080) of China and the Excellent Research Program of Nanjing University (ZYJH004).
Conflicts of interest
There are no conflicts to declare.Notes and references
- M. Nishizawa, E. Walinda, D. Morimoto, B. Kohn, U. Scheler, M. Shirakawa and K. Sugase, J. Am. Chem. Soc., 2021, 143, 11982–11993 CrossRef CAS PubMed.
- C. Ma, C. Lin, Y. Wang and X. Chen, TrAC, Trends Anal. Chem., 2016, 77, 226–241 CrossRef CAS.
- A. V. Gourine, E. Llaudet, N. Dale and K. M. Spyer, Nature, 2005, 436, 108–111 CrossRef CAS PubMed.
- D. C. Wallace, Science, 1999, 283, 1482–1488 CrossRef CAS PubMed.
- A. Krissanaprasit, C. M. Key, S. Pontula and T. H. LaBean, Chem. Rev., 2021, 121, 13797–13868 CrossRef CAS PubMed.
- L. Li, Y. Jiang, C. Cui, Y. Yang, P. Zhang, K. Stewart, X. Pan, X. Li, L. Yang, L. Qiu and W. Tan, J. Am. Chem. Soc., 2018, 140, 13335–13339 CrossRef CAS PubMed.
- A. E. Rangel, Z. Chen, T. M. Ayele and J. M. Heemstra, Nucleic Acids Res., 2018, 46, 8057–8068 CrossRef CAS PubMed.
- S. Hong, X. Zhang, R. J. Lake, G. T. Pawel, Z. Guo, R. Pei and Y. Lu, Chem. Sci., 2020, 11, 713–720 RSC.
- J. Zhao, J. Gao, W. Xue, Z. Di, H. Xing, Y. Lu and L. Li, J. Am. Chem. Soc., 2018, 140, 578–581 CrossRef CAS PubMed.
- M.-R. Cui, X.-L. Li, J.-J. Xu and H.-Y. Chen, ACS Appl. Mater. Interfaces, 2020, 12, 13005–13012 CrossRef CAS PubMed.
- W. Wang, N. S. R. Satyavolu, Z. Wu, J.-R. Zhang, J.-J. Zhu and Y. Lu, Angew. Chem., Int. Ed., 2017, 56, 6798–6802 CrossRef CAS PubMed.
- J. Wang, G. Zhu, M. You, E. Song, M. I. Shukoor, K. Zhang, M. B. Altman, Y. Chen, Z. Zhu, C. Z. Huang and W. Tan, ACS Nano, 2012, 6, 5070–5077 CrossRef CAS PubMed.
- M. N. Stojanovic, P. de Prada and D. W. Landry, J. Am. Chem. Soc., 2000, 122, 11547–11548 CrossRef CAS PubMed.
- Y.-F. Ruan, H.-Y. Wang, X.-M. Shi, Y.-T. Xu, X.-D. Yu, W.-W. Zhao, H.-Y. Chen and J.-J. Xu, Anal. Chem., 2021, 93, 1200–1208 CrossRef CAS PubMed.
- X. Ye, C. Zheng, J. Chen, Y. Gao and C. B. Murray, Nano Lett., 2013, 13, 765–771 CrossRef CAS PubMed.
- H. Funabashi, H. Shigeto, K. Nakatsuka and A. Kuroda, Analyst, 2015, 140, 999–1003 RSC.
- X. Zheng, R. Peng, X. Jiang, Y. Wang, S. Xu, G. Ke, T. Fu, Q. Liu, S. Huan and X. Zhang, Anal. Chem., 2017, 89, 10941–10947 CrossRef CAS PubMed.
Footnote |
| † Electronic supplementary information (ESI) available. See DOI: https://doi.org/10.1039/d2cc02791g |
| This journal is © The Royal Society of Chemistry 2022 |