 Open Access Article
Creative Commons Attribution 3.0 Unported Licence
Tailoring of the chlorine sensing properties of substituted metal phthalocyanines non-covalently anchored on single-walled carbon nanotubes
Anshul Kumar Sharmaa,
Aman Mahajan *a,
Subodh Kumarb,
A. K. Debnathc and
D. K. Aswald
aMaterial Science Laboratory, Department of Physics, Guru Nanak Dev University, Amritsar, 143005, India. E-mail: aman.phy@gndu.ac.in
bDepartment of Chemistry, Guru Nanak Dev University, Amritsar, 143005, India
cTechnical Physics Division, Bhabha Atomic Research Centre, Mumbai, 400085, India
dCSIR-National Physical Laboratory, New Delhi, 110012, India
First published on 21st September 2018
Abstract
To investigate how central metal tunes the synergetic interactions between substituted metallo-phthalocyanine and single-walled carbon nanotubes in enhancing the gas sensing properties, a comparative study has been performed by varying the central metal ion in fluorinated metal phthalocyanines and single-walled carbon nanotube hybrid. Hybrids of metal(II)-1,2,3,4,8,9,10,11,15,16,17,18-24,25-hexa-decafluoro-29H,31H-phthalocyanine/single-walled carbon nanotube (F16MPc/SWCNTs–COOH, where M = Co, Zn) have been synthesized through π–π stacking interactions using the solution route. Spectroscopic (FT-IR, UV-vis, XPS and Raman), electron microscopic (TEM and FE-SEM) and TGA investigations have confirmed the successful functionalization and interaction of SWCNTs–COOH with F16MPc. Parts per billion (ppb) level Cl2-selective chemiresistive gas sensors have been fabricated on glass substrates with precoated gold electrodes by using these hybrids. The responses of various F16MPc/SWCNTs–COOH sensors have demonstrated the central metal ion-dependence in the sensitivity of Cl2.
1. Introduction
Chlorine (Cl2) is commonly used in water purification, pharmaceuticals, textiles, plastics, agrochemicals and household cleaning products etc. Despite being a toxic gas with an occupational exposure limit (OEL) of 500 ppb for a time-weighted average of over eight hours, it can cause distress in the respiratory system and severely affect the environment and mankind.1,2 The very precise monitoring of Cl2 at the parts per billion (ppb) or parts per trillion (ppt) level has led to the development of economical, flexible, compact and low power consuming sensors. Different materials like metal oxides,3–5 organic semiconductors6,7 and carbon-based nanomaterials8,9 have been widely explored for the fabrication of gas sensors. Metal oxide-based (particularly SnO2, ZnO, WO3, TiO2, V2O5) chemiresistive gas sensors have been investigated for the detection of various toxic gases.10,11 In organic semiconductors, polycyclic aromatic hydrocarbons, phthalocyanines, porphyrin derivatives and polymers have been used as excellent sensing materials for the detection of various harmful gases.12,13 Carbon-based nanomaterials, fullerenes, graphene, and carbon nanotubes (CNTs), have been demonstrated as promising gas sensing materials.14,15 However, the gas sensing characteristics of CNT hybrids with noble metal nanoparticles,16 metal oxides17 and organic semiconductors18,19 are better in comparison to pristine CNTs due to the better charge transfer between the hybrid and gas analytes.Among the organic semiconductors, metallo-phthalocyanines (MPcs) are attractive choices for the noncovalent functionalization of CNTs because of the synergic interaction of MPcs with CNTs due to π–π interactions.20,21 MPcs have emerged as outstanding sensing materials in highly selective, sensitive and reversible chemiresistive gas sensors to detect various toxic gases due to their conjugated macrocyclic units.22,23 We have previously reported the nanostructured growth of substituted MPcs for ppb level Cl2 gas sensors with detection limits as low as 5 ppb.24,25 Monllau et al.26 reported highly sensitive multiwalled carbon nanotubes and epoxy resin-based amperometric sensors for the detection of free chlorine in water, at concentrations as low as 20 μg L−1. Wang et al.27 fabricated lead phthalocyanine modified CNTs with enhanced NH3 sensing performance as compared to pristine CNTs. Liang et al.20 developed substituted metal(II) phthalocyanine/multi-walled carbon nanotube hybrid (TFPMPc/MWCNT, M = Co, Zn, Cu, Pb, Pd, and Ni) sensors where the central metal atoms play an important role in the high sensitivity and selectivity of the sensor towards NH3. The response of the TFPMPc/MWCNT hybrid sensor to ammonia vapour is in the order of Co > Zn > Cu > Pb > Pd ∼ Ni, which has been attributed to the binding energies of the MPc-NH3 system.20 Recently, we fabricated Cl2 sensors using hybrids of carboxylic functionalized multi-walled carbon nanotubes with hexadecafluorinated metal phthalocyanines, (F16MPc, M = Cu, Zn, Co) and the response of the sensors to Cl2 lies in the order of Co > Cu > Zn.28–30 Kaya et al.31 have shown that the response of the sensor to ammonia vapor in the concentration range 20–50 ppm is of the order CuPc-py > CoPc-py > H2Pc-py. It is worth mentioning that single-walled carbon nanotubes (SWCNTs) have certain superior features compared to the MWCNTs due to the comparatively smaller size, stronger inter-tube attraction, and larger specific area of SWCNTs that will enhance the gas adsorption capability and will enhance the gas sensing parameters of the sensor. In our previous study, we have shown that the F16CuPc/SWCNTs–COOH hybrid sensor seems to be a significantly better candidate for gas sensing applications in comparison to the F16CuPc/MWCNTs–COOH hybrid sensor.28
Taking these facts into consideration, in order to tune the Cl2 sensing properties of the MPc/CNTs hybrid and to verify the effect of the central metal in the phthalocyanine molecule, we have synthesized hybrids of SWCNTs–COOH with metal(II)1,2,3,4,8,9,10,11,15,16,17,18-24,25-hexadecafluoro-29H,31H-phthalocyanine (F16MPcs, where M = Co, Zn).32–34
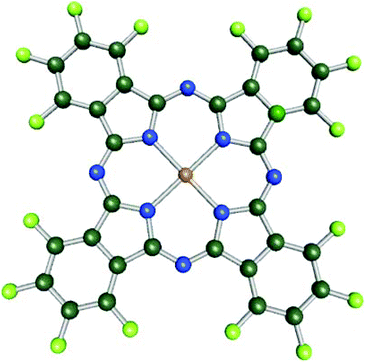
Fig. 1 shows the schematic diagram of the F16MPcs molecules used in this work. Further, due to molecular functionalization, the molecular orbitals come closer to the Fermi level, leading to an increase in the ionization potential and electron affinity, which result in the preferred acceptor behaviour.34
2. Experimental
The SWCNTs and F16MPcs (where M = Co, Zn) samples were commercially procured from Sigma-Aldrich. The acidification of SWCNTs consisting of the acidic group (–COOH) was performed through the established multi-step acid treatment procedures.35 It is worth mentioning that the carboxyl group imparts negative charges and results in the long-term stability of the CNTs dispersion.35,36 Varying amounts of F16MPcs (0.1 to 0.5 wt%) were dissolved in 5 mL of dimethylformamide (DMF), and subsequently subjected to stirring to give the F16MPcs/DMF solution. The above solution was then successively and cautiously added dropwise to the SWCNTs–COOH (30 mg) suspensions in DMF and then sonicated at room temperature (25 °C) for 3 h and stirred in the dark for 6 h at 100 °C. After stirring and filtration through a PTEF filter (0.22 μm, Millipore), the product was washed thoroughly with DMF to eradicate the excess F16MPcs derivative, followed by washing with ethanol numerous times, then finally drying to acquire F16CoPc/SWCNTs–COOH (S1) and F16ZnPc/SWCNTs–COOH (S2) hybrids.Raman spectra were obtained using a Renishaw inVia micro-Raman spectrometer. Fourier transform infrared (FT-IR) and ultraviolet-visible (UV-vis) spectra of S1 and S2 hybrids were obtained on a Perkin Elmer Frontier FT-IR spectrometer and UV-2450PC (Shimadzu, Japan) spectrophotometer, respectively. The morphologies of S1 and S2 hybrids were determined by field emission scanning electron microscopy (FE-SEM, Carl Zeiss, supra 55) and transmission electron microscopy (Jeol, TEM-2100). Thermogravimetric analysis (TGA) was performed using a thermogravimetric analyzer (Hitachi STA 7200) under a nitrogen atmosphere from 40 to 900 °C at a scan rate of 10 °C min−1. X-ray photoelectron spectroscopy (XPS) was conducted using a Mg Kα X-ray beam as the excitation source (1253.6 eV) and a MAC2 electron analyzer system attached to an MBE machine (EVA-32 Riber, France). The binding energy scale was calibrated to the Au 4f7/2 line of 84.0 eV.
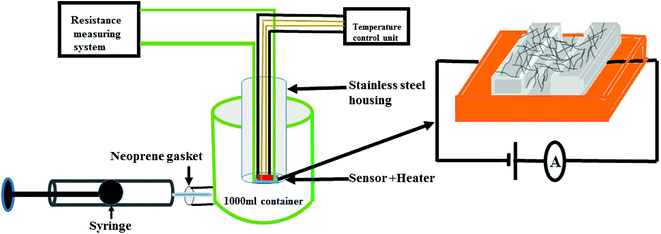
The gas sensing studies were carried out using a homemade gas handling test chamber (1000 mL) containing a sample holder geometry as shown in Fig. 2. To prepare gas sensors of S1 and S2 hybrids, 2 mg of the as-prepared F16MPcs/SWCNTs hybrids were dispersed in 1 mL of DMF and then multiple sensors with effective area of 3 mm × 1 mm were fabricated by drop casting 30 μL of hybrid solution onto a glass substrate with two precoated gold electrodes (3 mm × 3 mm at a spacing of 1 mm). Silver wires were attached to the gold electrodes using silver paste. Sensor resistance was recorded continuously by applying a constant bias of 3 V during both dosing and purging cycles as a function of time, using a computer interfaced Keithley electrometer 6517A. The desired concentrations of (NO2, NO, Cl2, H2S, C2H5OH, CO and NH3) gases in the test chamber were achieved by injecting a known quantity of gas using a micro-syringe; once steady-state was achieved after exposure, sensor resistance was recovered by opening the lid of the test chamber.
The response of the gas sensor was calculated using eqn (1):
| S(%) = |(Ra − Rg)/Ra| × 100 | (1) |
3. Results and discussion
3.1 Material characterization of the F16MPc/SWCNTs–COOH hybrid
In order to explore the interactions between phthalocyanine molecules and SWCNTs–COOH, Raman and FTIR spectroscopic measurements of all the samples were conducted. The Raman spectra (Fig. 3) of SWCNTs–COOH contain the characteristic G-band due to the bond stretching of sp2 atoms at around 1593 cm−1 and the D band at around 1360 cm−1 due to the breathing mode of sp2 atoms.38,39 Moreover, a characteristic peak at 164 cm−1 is for the radial breathing mode (RBM) of SWCNTs–COOH, which signifies the distribution of diameters in the SWCNTs–COOH sample.40 The peaks at 143, 176, 208, 283, 470, 513, 587, 680, 738 and 965 cm−1 in F16CoPc and peaks at 118, 177, 200, 281, 469, 586, 727, 811 and 954 cm−1 in F16ZnPc are due to the vibrations of isoindole moieties.41 The characteristic peaks between 1200 and 1600 cm−1 are due to pyrrole groups. Moreover, bands at 1544 and 1509 cm−1 correspond to cobalt and zinc ions, in agreement with earlier studies.41–43 It is worth noting that a combination of peaks of both the F16MPcs and SWCNTs–COOH were found in the Raman spectra of S1 and S2 hybrids. Moreover, D and G bands were found to be marginally broadened due to the superimposition with F16MPc peaks. Fig. 3(b) shows enlarged parts of the spectra from 100 to 1300 cm−1, in which there is a change in the peak position and intensity of the characteristic Raman peak of the phthalocyanine macrocycle by interaction with SWCNTs–COOH. The relative intensity ratio (ID/IG) was determined to be 0.3, 0.19 and 0.24 for SWCNTs–COOH, S1 and S2 samples, respectively.28,40 A small variation in ID/IG demonstrated that F16MPc molecules are non-covalently attached to the surface of SWCNTs–COOH.39,40 Nevertheless, π–π stacking interactions between SWCNTs–COOH and F16MPcs aromatic rings resulted in the shift of RBM towards a higher frequency.44,45 The higher frequency shift in the S1 hybrid as compared to the S2 hybrid indicates that the adsorption of F16CoPc induces a more significant shift in comparison to F16ZnPc, due to the enhanced F16CoPc molecule-SWCNT–COOH interaction.44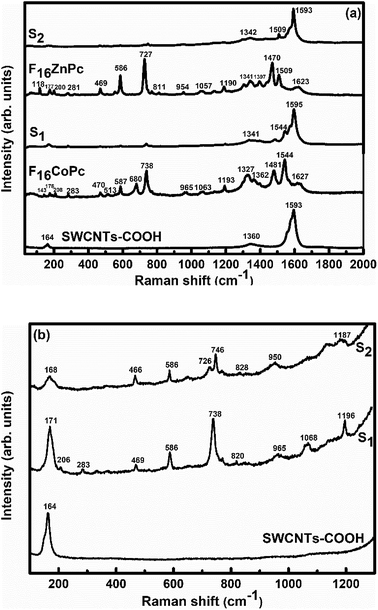 | ||
| Fig. 3 Raman spectra of (a) SWCNTs–COOH, F16CoPc, S1, F16ZnPc and S2 hybrids, and (b) SWCNTs–COOH, S1 and S2 hybrids in the 30–1300 cm−1 range (magnified view). | ||
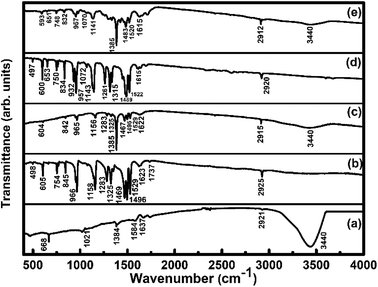
FTIR spectra (Fig. 4) of SWCNTs–COOH show the C–O stretching vibration peak at 1021 cm−1, the O–H stretching vibration peak at 3440 cm−1 due to the carboxylic group36 and a peak at 1637 cm−1 due to the C![[double bond, length as m-dash]](https://www.rsc.org/images/entities/char_e001.gif) C stretching vibration.36 The peaks at 2855 and 2921 cm−1 correspond to asymmetric and symmetric CH2 stretching vibrations.46 The observed IR peaks at 498, 605, 754, 845, 966, 1158 cm−1 for the F16CoPc sample and at 497, 600, 653, 750, 834, 932, 957, 1072, 1143 cm−1 in the F16ZnPc sample are due to the hexadecafluoro substituents. The presence of other peaks at 1283, 1325, 1469, 1496, 1529, 1623, 1737, 2925 cm−1 for F16CoPc and at 1261, 1315, 1489, 1522, 1615, 2920 cm−1 for F16ZnPc are due to aliphatic C–H vibrations.20 The peaks appearing in F16CoPc and SWCNTs–COOH can be found in the S1 hybrid at 604, 842, 965, 1156, 1283, 1325, 1385, 1467, 1495, 1529, 1622 and 2915 cm−1.47 Similarly, peaks appearing in F16ZnPc and SWCNTs-COOH are observed in the S2 hybrid at 593, 651, 748, 832, 957, 1070, 1141, 1385, 1483, 1520, 1615 and 2912 cm−1.47 It is worth mentioning that the peak appearing at 1385 cm−1 in both the S1 and S2 hybrids is due to the C–N–C vibration,48 which confirms the interaction between phthalocyanine and CNTs. The characteristic peaks of the phthalocyanine molecule in the IR spectra of S1 and S2 hybrids are found to be slightly red shifted in wavenumber in comparison to their individual peaks. Nevertheless, a higher shift in wavenumber in the S1 hybrid in comparison to S2 reveals that adsorption of F16CoPc induces a more significant shift due to the enhanced electron delocalization via π–π stacking interactions between the F16CoPc molecule and SWCNT–COOH, which is concomitant with Raman spectroscopic studies.49
C stretching vibration.36 The peaks at 2855 and 2921 cm−1 correspond to asymmetric and symmetric CH2 stretching vibrations.46 The observed IR peaks at 498, 605, 754, 845, 966, 1158 cm−1 for the F16CoPc sample and at 497, 600, 653, 750, 834, 932, 957, 1072, 1143 cm−1 in the F16ZnPc sample are due to the hexadecafluoro substituents. The presence of other peaks at 1283, 1325, 1469, 1496, 1529, 1623, 1737, 2925 cm−1 for F16CoPc and at 1261, 1315, 1489, 1522, 1615, 2920 cm−1 for F16ZnPc are due to aliphatic C–H vibrations.20 The peaks appearing in F16CoPc and SWCNTs–COOH can be found in the S1 hybrid at 604, 842, 965, 1156, 1283, 1325, 1385, 1467, 1495, 1529, 1622 and 2915 cm−1.47 Similarly, peaks appearing in F16ZnPc and SWCNTs-COOH are observed in the S2 hybrid at 593, 651, 748, 832, 957, 1070, 1141, 1385, 1483, 1520, 1615 and 2912 cm−1.47 It is worth mentioning that the peak appearing at 1385 cm−1 in both the S1 and S2 hybrids is due to the C–N–C vibration,48 which confirms the interaction between phthalocyanine and CNTs. The characteristic peaks of the phthalocyanine molecule in the IR spectra of S1 and S2 hybrids are found to be slightly red shifted in wavenumber in comparison to their individual peaks. Nevertheless, a higher shift in wavenumber in the S1 hybrid in comparison to S2 reveals that adsorption of F16CoPc induces a more significant shift due to the enhanced electron delocalization via π–π stacking interactions between the F16CoPc molecule and SWCNT–COOH, which is concomitant with Raman spectroscopic studies.49
Fig. 5 depicts the UV-vis absorption spectra of SWCNTs–COOH, F16MPcs, S1 and S2 hybrids. The UV-vis absorption spectrum of SWCNTs–COOH was observed to be featureless50 and the spectra of F16MPcs exhibit two strong absorption bands, one broad B band in the wavelength range 305–371 nm due to the electronic transitions from the HOMO a2u to the LUMO eg level and the Q band in the visible range at 632–672 nm is because of the electronic transitions from the HOMO a1u level to the LUMO eg level.51 However, in the case of S1 and S2 hybrids, the Q-band was found to be comparatively broadened with a decrease in absorption in the dispersions containing F16MPc/SWCNTs–COOH and their maxima were red-shifted by 19 and 16 nm, respectively, as compared to that of the individual F16MPc spectrum. It is worth mentioning that the expanded macrocyclic conjugated structure of F16MPc and the reduced energy difference between the HOMO and the LUMO facilitates charge transfer between F16MPc and SWCNTs–COOH. In addition, the higher red-shift in the S1 hybrid as compared to S2 confirms the significant π–π interaction and the charge transfer between F16CoPc and SWCNTs–COOH.40
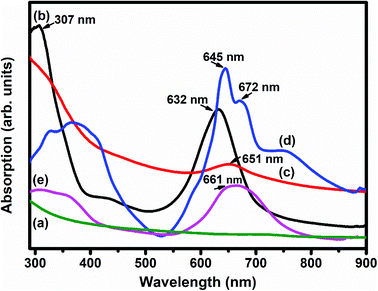 | ||
| Fig. 5 UV-vis absorption spectra of (a) SWCNTs–COOH; (b) F16CoPc; (c) S1; (d) F16ZnPc and (e) the S2 hybrid. | ||
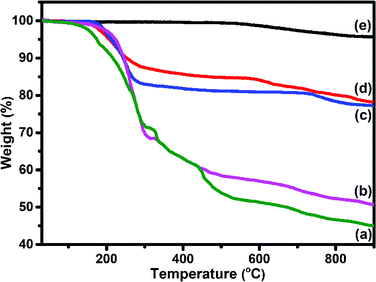
TEM (Fig. 6(a and b)) images of S1 and S2 hybrids demonstrate the exohedral anchoring of phthalocyanine molecules on the walls of SWCNTs–COOH with a mean diameter of about 36 and 29 nm in comparison to SWCNTs–COOH (inset view) with diameter of about 10 nm. Additionally, scanning electron microscopy images (Fig. 6(c and d)) of S1 and S2 hybrids also highlight that phthalocyanine molecules are anchored on the surface of the SWCNTs–COOH matrix, making a thicker SWCNTs–COOH surface in contrast to individual SWCNTs–COOH. The weight loss as a function of temperature for SWCNTs–COOH, F16ZnPc, F16CoPc, S1 and S2 hybrid materials has been investigated using TGA plots (Fig. 7)).
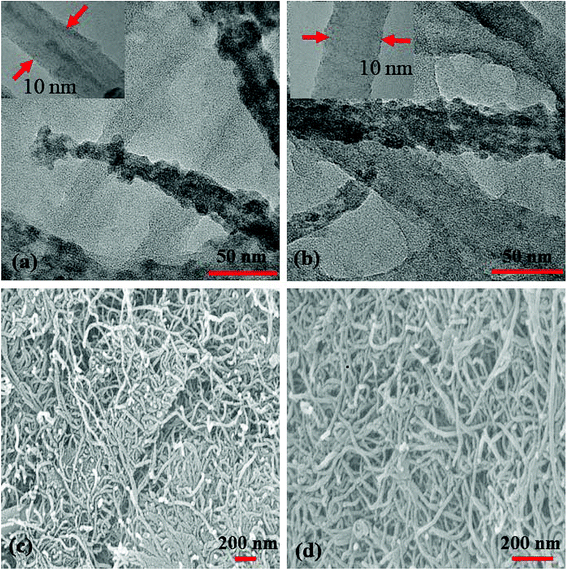 | ||
| Fig. 6 (a and b) TEM images (insets show the TEM images of SWCNTs–COOH) and (c and d) SEM images of the S1 and S2 hybrids. | ||
A loss of weight of about 54.60% and 49.05% up to 900 °C was observed for F16ZnPc and F16CoPc (Fig. 7(a and b)), comprised of major weight losses in steps from 200 to 330 °C and 366 to 604 °C due to the desorption of adsorbed water and the decomposition of F16MPc, respectively.45,52 TGA plots of SWCNTs–COOH (Fig. 7(e)) exhibited a weight loss of about 4.21% due to the destruction of the residual carbon and decarboxylation of oxidized species.40 In contrast, S1 and S2 (Fig. 7(c and d)) had weight losses of 21.83% and 22.79%, respectively, on heating the hybrid to 900 °C, corresponding to the decomposition of the F16MPc on the SWCNTs–COOH surface.45 The amount of F16MPc molecules adsorbed on the SWCNTs–COOH was calculated using the ratio of the difference in weight loss between SWCNTs–COOH and the F16MPc/SWCNTs–COOH hybrid to the weight loss for F16MPc and was found to be 35.92% and 34.02% for the S1 and S2 hybrids, respectively.
3.2 Gas sensing measurements
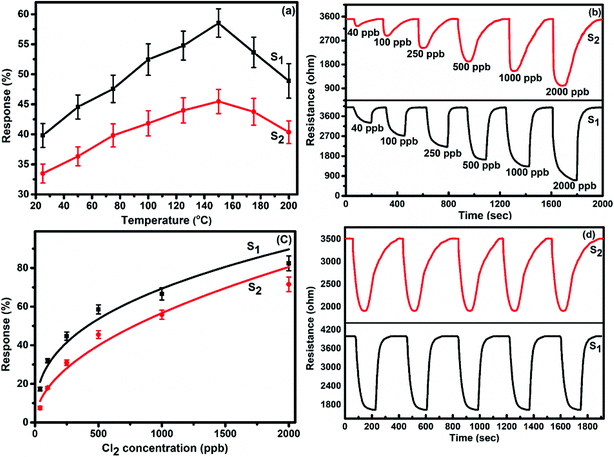
To demonstrate the gas sensing properties of prepared S1 and S2 hybrid sensors, we recorded the response curves (change in resistance of the film as a function of time) of the sensors to 500 ppb of different test gases at room temperature (25 °C). From the selectivity histogram (Fig. 8), it can be seen that for the tested gases at room temperature, 0.3 wt% of S1 and S2 hybrid sensors exhibited the best response towards Cl2 among all the prepared sensors, with sensitivity values of ∼40% and 30%, respectively, in comparison to the pristine SWCNTs sensor with a sensitivity value of ∼1%.28 This indicates that the F16MPcs molecule enhances the sensor response because of the synergic interaction of MPcs with CNTs due to π–π interactions. As such, 0.3 wt% of S1 and S2 hybrid sensors was chosen for further sensing studies. The sensitivity values for all other tested gases were <4%. Moreover, at room temperature, the sensors showed irreversible behaviour, as they did not recover to the baseline resistance even after a long interval of time. It was observed that heating improves the recovery characteristics of the sensors; the operating temperature was optimized in order to make the sensors reversible. Here, both sensors S1 and S2 were exposed to 500 ppb of Cl2 at different operating temperatures ranging from 25 °C to 200 °C. A plot of sensor response for 500 ppb of Cl2 as a function of temperature is shown in Fig. 9(a). The response for Cl2 was rapidly enhanced with increasing temperature and the maximum responses of ∼59% and 46% were obtained for sensors S1 and S2, respectively, at 150 °C. Furthermore, the response of the sensors decreases beyond 150 °C, due to desorption of Cl2 from the surface of the sensors.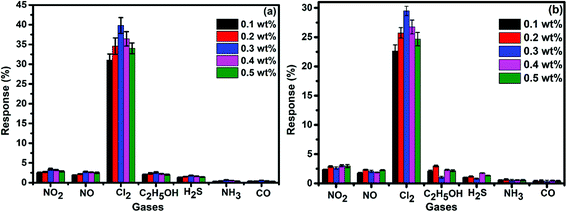 | ||
| Fig. 8 (a and b) Selectivity histogram of S1 and S2 sensors for 500 ppb of NO2, NO, Cl2, C2H5OH, H2S, NH3 and CO at room temperature. | ||
Fig. 9(b) shows the resistance variation in S1 and S2 sensors as a function of time for different concentrations of Cl2 (40–2000 ppb) at 150 °C. Upon exposure to Cl2, the sensor resistance decreases and it becomes saturated after some time; after purging with air, it again starts approaching its initial baseline value, indicating good reversibility. Fig. 9(c) demonstrates the response behaviour of S1 and S2 sensors to 40–2000 ppb concentrations of Cl2. The response value of the sensors increased with increasing the concentration of Cl2. The responses of S1 and S2 sensors were found to lie in the range of ∼18–82% and ∼8–72%, respectively. It is worth mentioning that the response of F16MPc/SWCNTs–COOH hybrids towards chlorine is greater than that of F16MPc/MWCNTs–COOH hybrids.28,29 Further, due to certain superior features of SWCNTs such as smaller size, stronger inter-tube attraction and larger specific surface area compared to the MWCNTs, the gas sensing parameters of the SWCNTs-based sensors are enhanced. The response of SWCNTs hybrids decreases in the order F16CoPc > F16ZnPc > F16CuPc,28 which has been clarified in terms of the central ion size; i.e., the larger ionic radius and especially the interaction effects between Cl2 and different central ions. It was found that the interactions increase with the corresponding increase in the atomic size of the atoms/ions for a given separation distance because larger atoms are more easily polarizable and provide more electrons to polarize, which results in strong van der Waals forces, indicating that the central metal size plays an important role in the sensitivity of Cl2. This is in agreement with charge transfer and the number of Pc molecules adsorbed onto the SWCNTs wall, as estimated by TGA and Cl2 interactions with the sensor as observed in X-ray photoelectron and EIS studies discussed in Section 3.3.53 Fig. 9(d) shows the response curves of S1 and S2 sensors for successive exposures to Cl2. The sensors showed no significant changes in response and recovery characteristics after repeated gas exposure, demonstrating the reproducible and stable sensing characteristics of the sensors.
Fig. 10 represents the variation in the Cl2 response of S1 and S2 sensors with relative humidity (11–98%) for 2000 ppb of Cl2 at room temperature. It was observed that both sensors showed only small variations (2.4% for S1 and 3.26% for S2 sensor) in their Cl2 response as the humidity level was varied from 11% to 98%, indicating that humidity has a negligible effect on the Cl2 response of these sensors.
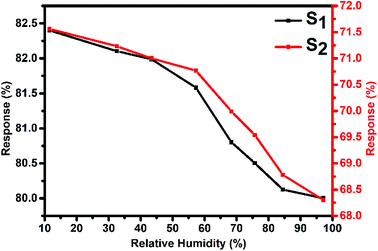 | ||
| Fig. 10 Variation in the Cl2 response of S1 and S2 sensors with humidity for 2 ppm of Cl2 at room temperature. | ||
The response variation with the gas concentration was studied using eqn (2):54,55
 | (2) |
In the above experimental study, the lowest detectable concentration is limited due to the experimental set up used. Nevertheless, the limit of detection (LOD) of the sensor was derived from the signal-to-noise ratio (S/N), which is defined as ΔR/σ, where ΔR is the maximum resistance change with respect to Ra (baseline resistance) and σ represents the root mean square (rms) noise of the baseline in air.56
The LOD was calculated by using the eqn (3):57
 | (3) |
The signal-to-noise ratios of sensors S1 and S2 are 3000 and 2400, respectively, with the corresponding detection limits of 0.04 ppb and 0.05 ppb, respectively. Thus, the higher sensitivity, reversibility and reproducibility of the F16MPc/SWCNTs hybrid sensor in comparison to other CNTs-based Cl2 sensors reported in literature1,58 make these sensors favourable candidates for ppb level Cl2 detection.
3.3 Gas sensing mechanism
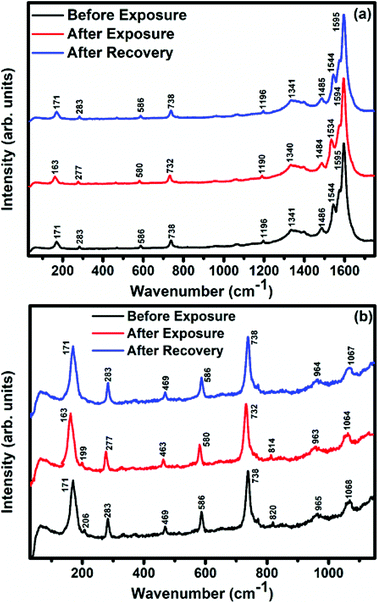
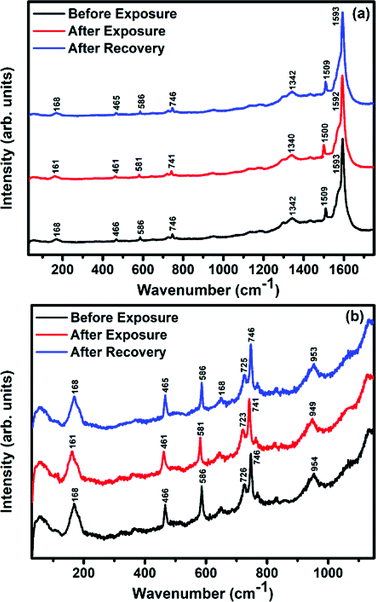
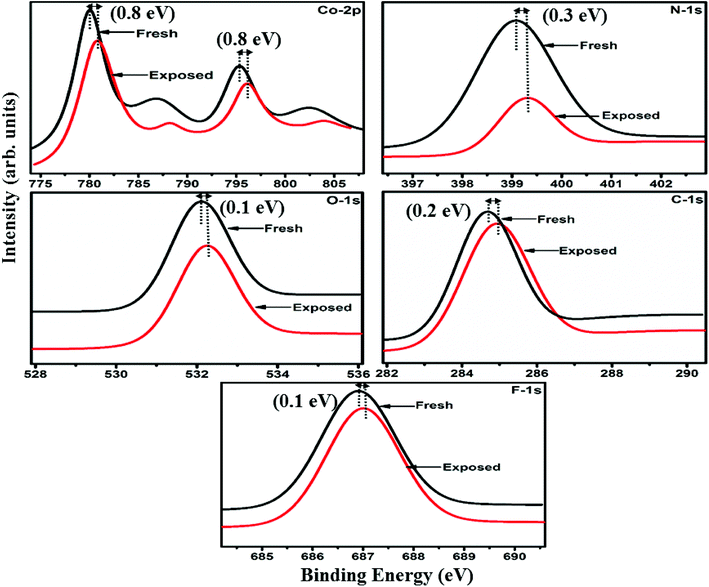
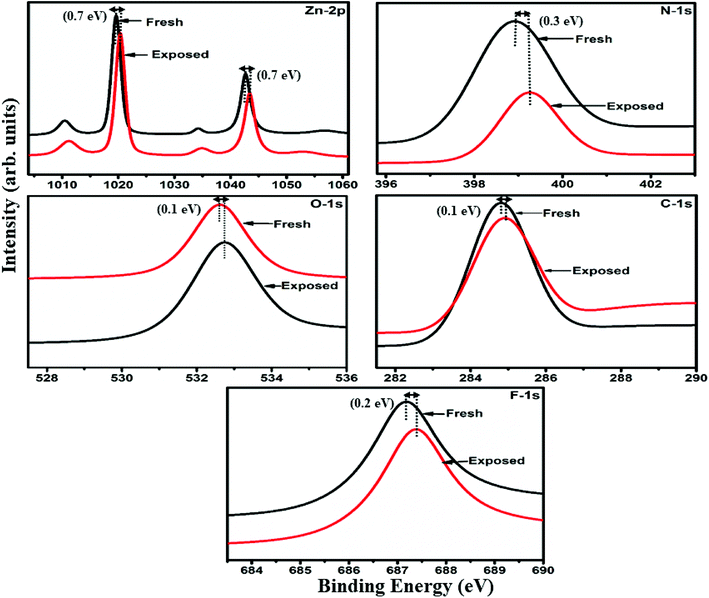
Raman, XPS and impedance spectroscopic measurements of S1 and S2 hybrid sensors have been performed both in air and after purging in Cl2 in order to explore the sensing mechanism of the sensors. On exposure of the S1 sensor to Cl2, the Raman peak (Fig. 11) corresponding to the cobalt–nitrogen bond59 (171 cm−1) is shifted by 8 cm−1 and macro-cyclic vibration60 peaks (283, 586, 738, 820, 1196 cm−1) are shifted by 6 cm−1, whereas D and G bands corresponding to SWCNTs–COOH (1341 and 1595 cm−1) are shifted by 1 cm−1.38 In contrast, in the Raman spectra (Fig. 12) of sensor S2, the peak corresponding to the zinc–nitrogen bond59 (168 cm−1) is shifted by 7 cm−1 and macro-cyclic vibration60 peaks (119, 466, 586, 746 cm−1) are shifted by 5 cm−1, whereas D and G bands corresponding to SWCNTs–COOH (1342 and 1593 cm−1) are shifted by 2 and 1 cm−1, respectively.38 The major shift of 10 cm−1 in S1 and 9 cm−1 in S2 (1544 cm−1 and 1509 cm−1) corresponds to the displacement of the C–N–C bridge bond, closely linked to the cobalt and zinc ions of the phthalocyanine molecule.43 The higher shift in the S1 hybrid as compared to the S2 hybrid indicates the predominant interaction of Cl2 with the cobalt ions of the hybrid sensor. The Raman spectra of the hybrid sensors recorded after purging Cl2 showed identical peaks to those of fresh samples, which reflects the excellent reversibility of these sensors.The interactions between Cl2 and the S1/S2 hybrid sensors were further confirmed by observing the shifts in binding energy in the XPS spectra of unexposed and Cl2 exposed samples. The XPS spectrum (Fig. 13) of the fresh S1 hybrid shows characteristic peaks at 284.7, 532.1, 399.0, 686.9, 780.0, 795.3 eV corresponding to C-1s, O-1s, N-1s, F-1s, Co-2p3/2 and Co-2p1/2 levels, respectively.40 Once the sample was exposed to Cl2, there was a peak shift of 0.2 eV in the spectrum of the core level C-1s, a shift of 0.1 eV in the spectrum of O-1s and F-1s, a shift of 0.3 eV in the spectrum of N-1s and a prominent peak shift of 0.8 eV in the core level spectrum of Co-2p. In contrast, the XPS spectrum (Fig. 14) of the fresh S2 hybrid showed characteristic peaks at 284.8, 532.6, 399.0, 687.1, 1019.6, 1042.6 eV corresponding to C-1s, O-1s, N-1s, F-1s, Zn-2p3/2 and Zn-2p1/2 levels24 and after Cl2 exposure, there was a peak shift of 0.2 eV in spectrum of core level F-1s, a shift of 0.1 eV in the spectra of C-1s and O-1s, a shift of 0.3 eV in the spectrum of N-1s and a prominent peak shift of 0.7 eV in the core level spectrum of Zn-2p. The prominent shift of 0.8 eV towards the higher BE side in the Co-2p core level in the S1 hybrid, a shift of 0.7 eV towards the higher BE side in the Zn-2p core level in the S2 hybrid and a shift of 0.5 eV towards the higher BE side in Cu-2p28 confirm that charge transfer interactions occur upon adsorption of strong electron acceptor Cl2 molecules to the hybrid, leading to a decrease in electron density due to the transfer of electrons from the hybrid to Cl2.29,61 Thus, the analysis of the Raman and XPS spectroscopic observations is concomitant with the higher sensing response of the S1 hybrid because greater charge transfer takes place between Cl2 and the S1 hybrid through the central metal ion with the adsorption of Cl2. Nevertheless, charge can favourably travel from CNTs to F16MPcs, which leads to an increase in the hole concentration in CNTs and results in the fast variation in resistance as observed in Fig. 9(b).61,62 It is worth mentioning that there was no shifting of peak position in the XPS spectrum after recovery, and the absence of any chlorine signal confirms that the sensing process is highly reproducible.
The interaction between the F16MPc/SWCNTs–COOH sensor and Cl2 has also been further studied using impedance spectroscopy tools, providing information about F16MPc/SWCNTs–COOH grains and the respective grain boundaries in accordance with morphological studies. Fig. 15(a and b) shows the impedance spectra of the F16MPc/SWCNTs–COOH sensor, obtained in air and under exposure to 500 ppb of Cl2, i.e., the Cole–Cole plot.53,63 With an equivalent circuit (in the inset in Fig. 15) consisting of the RC network in series with a resistor R0, a single semi-circle was observed before and after exposure to Cl2. The intercept of the arc at high frequency with the real axis gives the grain resistance (R0). The resistance across the grain boundary (R1) was found from the diameter of the arc in Fig. 15, whereas the capacitance across the grain boundary (C1) was estimated from the relation.
| ωmax R1C1 = 1, |
| Z = Z′ + jZ′′ | (4) |
| Z′′ = [ωR21C1/(1 + ωR1C1)2]. |
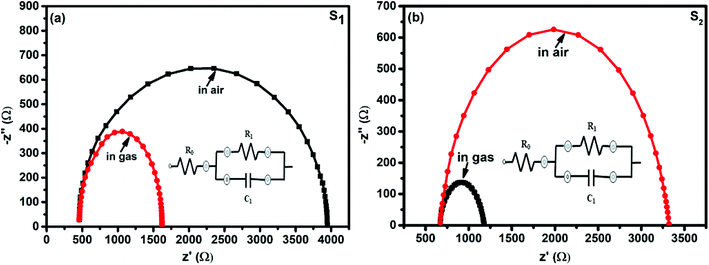 | ||
| Fig. 15 Impedance spectra of fresh and Cl2 exposed S1 and S2 sensors (the insets show the equivalent circuits used for the analysis of data obtained from the S1 and S2 sensors). | ||
Interestingly, the parameter R0 remained the same in S1 and S2 sensors in air and on exposure to Cl2, but R1 decreased and C1 increased in the presence of Cl2. This result is also supported by the fact that R1 changes across the grain boundary in the order of S1> S2> H1 (ref. 28) for hybrid sensors, indicating that incoming Cl2 molecules were adsorbed onto the outer surfaces of the grains and resulted in increased hole conductivity because of the charge transfer between phthalocyanines and CNTs, as explained in XPS investigations (Table 1).28,53
| Sensors | Conditions | Parameters | ||
|---|---|---|---|---|
| R0 (Ω) | R1 (Ω) | C1 (nF) | ||
| S1 | Unexposed | 458 | 3488 | 2 |
| Exposed to 500 ppb Cl2 | 458 | 1164 | 5 | |
| S2 | Unexposed | 671 | 2649 | 3 |
| Exposed to 500 ppb Cl2 | 671 | 507 | 11 | |
4. Conclusions
We have fabricated F16CoPc/SWCNTs–COOH and F16ZnPc/SWCNTs–COOH hybrid sensors using the solution assembly route, through π–π stacking interactions between F16MPc and SWCNTs–COOH for chlorine sensing applications. The results demonstrate that the F16CoPc/SWCNTs–COOH sensor exhibits high sensitivity (∼82% for 2 ppm with LOD of 0.04 ppb), excellent reproducibility and selectivity towards chlorine with response decreasing in the order of Co > Zn > Cu, indicating that the central metal ions play an important role in the sensitivity of Cl2, and this is in good agreement with the central ion size: the larger the ionic radius, the greater the charge transfer and Cl2 interaction with the sensor as observed from X-ray photoelectron, Raman and electrochemical impedance spectroscopic studies. Such effectiveness of the sensor originates from the synergetic interaction between F16MPc and SWCNTs–COOH. Strong response and good selectivity underline the significant potential of these hybrid materials in designing a new low-cost Cl2 sensor.Conflicts of interest
There are no conflicts to declare.Acknowledgements
The authors gratefully acknowledge Council of Scientific and Industrial Research (CSIR), New Delhi, India for providing financial assistance to accomplish this research work.Notes and references
- J. Li, Y. Lu and M. Meyyappan, IEEE Sens. J., 2006, 6, 1047–1051 Search PubMed.
- A. K. Saroha, J. Chem. Health Saf., 2006, 13, 5–11 CrossRef.
- J.-W. Kim, Y. Porte, K. Y. Ko, H. Kim and J.-M. Myoung, ACS Appl. Mater. Interfaces, 2017, 9, 32876–32886 CrossRef PubMed.
- A. Katoch, Z. U. Abideen, H. W. Kim and S. S. Kim, ACS Appl. Mater. Interfaces, 2016, 8, 2486–2494 CrossRef PubMed.
- M. Sturaro, E. Della Gaspera, N. Michieli, C. Cantalini, S. M. Emamjomeh, M. Guglielmi and A. Martucci, ACS Appl. Mater. Interfaces, 2016, 8, 30440–30448 CrossRef PubMed.
- N. Wu, C. Wang, B. R. Bunes, Y. Zhang, P. M. Slattum, X. Yang and L. Zang, ACS Appl. Mater. Interfaces, 2016, 8, 12360–12368 CrossRef PubMed.
- K. Potje-Kamloth, Chem. Rev., 2008, 108, 367–399 CrossRef PubMed.
- R. K. Paul, S. Badhulika, N. M. Saucedo and A. Mulchandani, Anal. Chem., 2012, 84, 8171–8178 CrossRef PubMed.
- Z. Zanolli, R. Leghrib, A. Felten, J.-J. Pireaux, E. Llobet and J.-C. Charlier, ACS Nano, 2011, 5, 4592–4599 CrossRef PubMed.
- C. Wang, L. Yin, L. Zhang, D. Xiang and R. Gao, Sensors, 2010, 10(3), 2088–2106 CrossRef PubMed.
- T. Van Dang, N. Duc Hoa, N. Van Duy and N. Van Hieu, ACS Appl. Mater. Interfaces, 2016, 8, 4828–4837 CrossRef PubMed.
- L. Huang, Z. Wang, X. Zhu and L. Chi, Nanoscale Horiz., 2016, 1, 383–393 RSC.
- C. D. Natale, E. Martinelli, G. Magna, F. Mandoj, D. Monti, S. Nardis, M. Stefanelli and R. Paolesse, J. Porphyrins Phthalocyanines, 2017, 21, 769–781 CrossRef.
- J. Li, Y. Lu, Q. Ye, M. Cinke, J. Han and M. Meyyappan, Nano Lett., 2003, 3, 929–933 CrossRef.
- S. Deng, V. Tjoa, H. M. Fan, H. R. Tan, D. C. Sayle, M. Olivo, S. Mhaisalkar, J. Wei and C. H. Sow, J. Am. Chem. Soc., 2012, 134, 4905–4917 CrossRef PubMed.
- T.-C. Lin and B.-R. Huang, Sens. Actuators, B, 2012, 162, 108–113 CrossRef.
- V. M. Aroutiounian, A. Z. Adamyan, E. A. Khachaturyan, Z. N. Adamyan, K. Hernadi, Z. Pallai, Z. Nemeth, L. Forro, A. Magrez and E. Horvath, Sens. Actuators, B, 2013, 177, 308–315 CrossRef.
- A. K. Sharma, R. Saini, R. Singh, A. Mahajan, R. K. Bedi and D. K. Aswal, AIP Conf. Proc., 2014, 1591, 671–673 CrossRef.
- B. Wang, Y. Wu, X. Wang, Z. Chen and C. He, Sens. Actuators, B, 2014, 190, 157–164 CrossRef.
- X. Liang, Z. Chen, H. Wu, L. Guo, C. He, B. Wang and Y. Wu, Carbon, 2014, 80, 268–278 CrossRef.
- M. Pişkin, N. Can, Z. Odabaş and A. Altındal, J. Porphyrins Phthalocyanines, 2018, 22, 189–197 CrossRef.
- A. Yazıcı, N. Ünüş, A. Altındal, B. Salih and Ö. Bekaroğlu, Dalton Trans., 2012, 41, 3773–3779 RSC.
- A. Kumar, A. Singh, A. K. Debnath, S. Samanta, D. K. Aswal, S. K. Gupta and J. V. Yakhmi, Talanta, 2010, 82, 1485–1489 CrossRef PubMed.
- R. Saini, A. Mahajan, R. K. Bedi, D. K. Aswal and A. K. Debnath, Sens. Actuators, B, 2014, 198, 164–172 CrossRef.
- R. Saini, A. Mahajan, R. K. Bedi, D. K. Aswal and A. K. Debnath, Sens. Actuators, B, 2014, 203, 17–24 CrossRef.
- R. Olivé-Monllau, A. Pereira, J. Bartrolí, M. Baeza and F. Céspedes, Talanta, 2010, 81, 1593–1598 CrossRef PubMed.
- B. Wang, X. Zhou, Y. Wu, Z. Chen and C. He, Sens. Actuators, B, 2012, 171–172, 398–404 CrossRef.
- A. K. Sharma, A. Mahajan, R. Saini, R. K. Bedi, S. Kumar, A. K. Debnath and D. K. Aswal, Sens. Actuators, B, 2018, 255, 87–99 CrossRef.
- A. K. Sharma, A. Mahajan, R. K. Bedi, S. Kumar, A. K. Debnath and D. K. Aswal, Appl. Surf. Sci., 2018, 427, 202–209 CrossRef.
- A. K. Sharma, A. Mahajan, R. K. Bedi, S. Kumar, A. K. Debnath and D. K. Aswal, RSC Adv., 2017, 7, 49675–49683 RSC.
- E. N. Kaya, S. Tuncel, T. V. Basova, H. Banimuslem, A. Hassan, A. G. Gürek, V. Ahsen and M. Durmuş, Sens. Actuators, B, 2014, 199, 277–283 CrossRef.
- H. Jiang, J. Ye, P. Hu, F. Wei, K. Du, N. Wang, T. Ba, S. Feng and C. Kloc, Sci. Rep., 2014, 4, 7573 CrossRef PubMed.
- P. A. Pandey, L. A. Rochford, D. S. Keeble, J. P. Rourke, T. S. Jones, R. Beanland and N. R. Wilson, Chem. Mater., 2012, 24, 1365–1370 CrossRef.
- D. G. de Oteyza, A. El-Sayed, J. M. Garcia-Lastra, E. Goiri, T. N. Krauss, A. Turak, E. Barrena, H. Dosch, J. Zegenhagen, A. Rubio, Y. Wakayama and J. E. Ortega, J. Chem. Phys., 2010, 133, 214703 CrossRef PubMed.
- J. Liu, A. G. Rinzler, H. Dai, J. H. Hafner, R. K. Bradley, P. J. Boul, A. Lu, T. Iverson, K. Shelimov, C. B. Huffman, F. Rodriguez-Macias, Y.-S. Shon, T. R. Lee, D. T. Colbert and R. E. Smalley, Science, 1998, 280, 1253–1256 CrossRef PubMed.
- Z. Zhao, Z. Yang, Y. Hu, J. Li and X. Fan, Appl. Surf. Sci., 2013, 276, 476–481 CrossRef.
- B. Chitara, D. J. Late, S. B. Krupanidhi and C. N. R. Rao, Solid State Commun., 2010, 150, 2053–2056 CrossRef.
- P. C. Eklund, J. M. Holden and R. A. Jishi, Carbon, 1995, 33, 959–972 CrossRef.
- M. L. de la Chapelle, S. Lefrant, C. Journet, W. Maser, P. Bernier and A. Loiseau, Carbon, 1998, 36, 705–708 CrossRef.
- Y. Wang, N. Hu, Z. Zhou, D. Xu, Z. Wang, Z. Yang, H. Wei, E. S.-W. Kong and Y. Zhang, J. Mater. Chem., 2011, 21, 3779–3787 RSC.
- C. Jennings, R. Aroca, A.-M. Hor and R. O. Loutfy, J. Raman Spectrosc., 1984, 15, 34–37 CrossRef.
- S. Tuncel, E. N. Kaya, M. Durmus, T. Basova, A. G. Gurek, V. Ahsen, H. Banimuslem and A. Hassan, Dalton Trans., 2014, 43, 4689–4699 RSC.
- M. Szybowicz and J. Makowiecki, J. Mater. Sci., 2012, 47, 1522–1530 CrossRef.
- Y. Zhang, J. Zhang, H. Son, J. Kong and Z. Liu, J. Am. Chem. Soc., 2005, 127, 17156–17157 CrossRef PubMed.
- E. N. Kaya, T. Basova, M. Polyakov, M. Durmuş, B. Kadem and A. Hassan, RSC Adv., 2015, 5, 91855–91862 RSC.
- J. Zhang, H. Zou, Q. Qing, Y. Yang, Q. Li, Z. Liu, X. Guo and Z. Du, J. Phys. Chem. B, 2003, 107, 3712–3718 CrossRef.
- S. Harbeck, Ö. F. Emirik, I. Gürol, A. G. Gürek, Z. Z. Öztürk and V. Ahsen, Sens. Actuators, B, 2013, 176, 838–849 CrossRef.
- S. Singh, S. K. Tripathi and G. S. S. Saini, Mater. Chem. Phys., 2008, 112, 793–797 CrossRef.
- A. Ma, J. Lu, S. Yang and K. M. Ng, J. Cluster Sci., 2006, 17, 599–608 CrossRef.
- T. Mugadza and T. Nyokong, Electrochim. Acta, 2009, 54, 6347–6353 CrossRef.
- H. Zhao, Y. Zhang, B. Zhao, Y. Chang and Z. Li, Environ. Sci. Technol., 2012, 46, 5198–5204 CrossRef PubMed.
- B.-P. Jiang, L.-F. Hu, D.-J. Wang, S.-C. Ji, X.-C. Shen and H. Liang, J. Mater. Chem. B, 2014, 2, 7141–7148 RSC.
- N. H. Al-Hardan, M. J. Abdullah and A. A. Aziz, Int. J. Hydrogen Energy, 2010, 35, 4428–4434 CrossRef.
- D. Kumar, P. Chaturvedi, P. Saho, P. Jha, A. Chouksey, M. Lal, J. S. B. S. Rawat, R. P. Tandon and P. K. Chaudhury, Sens. Actuators, B, 2017, 240, 1134–1140 CrossRef.
- I. Sayago, H. Santos, M. C. Horrillo, M. Aleixandre, M. J. Fernández, E. Terrado, I. Tacchini, R. Aroz, W. K. Maser, A. M. Benito, M. T. Martínez, J. Gutiérrez and E. Muñoz, Talanta, 2008, 77, 758–764 CrossRef.
- F. Rigoni, S. Tognolini, P. Borghetti, G. Drera, S. Pagliara, A. Goldoni and L. Sangaletti, Analyst, 2013, 138, 7392–7399 RSC.
- G. Chen, T. M. Paronyan, E. M. Pigos and A. R. Harutyunyan, Sci. Rep., 2012, 2, 343 CrossRef PubMed.
- A. Gohier, J. Chancolon, P. Chenevier, D. Porterat, M. Mayne-L’Hermite and C. Reynaud, Nanotechnology, 2011, 22, 105501 CrossRef PubMed.
- G. S. S. Saini, S. Sukhwinder, K. Sarvpreet, K. Ranjan, S. Vasant and S. K. Tripathi, J. Phys.: Condens. Matter, 2009, 21, 225006 CrossRef PubMed.
- L. L. Gladkov, V. V. Gromak and V. K. Konstantinova, J. Appl. Spectrosc., 2007, 74, 328–332 CrossRef.
- R. A. Hatton, N. P. Blanchard, V. Stolojan, A. J. Miller and S. R. P. Silva, Langmuir, 2007, 23, 6424–6430 CrossRef PubMed.
- A. L. Verma, S. Saxena, G. S. S. Saini, V. Gaur and V. K. Jain, Thin Solid Films, 2011, 519, 8144–8148 CrossRef.
- A. T. Mane, S. T. Navale, S. Sen, D. K. Aswal, S. K. Gupta and V. B. Patil, Org. Electron., 2015, 16, 195–204 CrossRef.
| This journal is © The Royal Society of Chemistry 2018 |

