 Open Access Article
Creative Commons Attribution 3.0 Unported Licence
Phosphorescent platinum(II) complexes bearing pentafluorosulfanyl substituted cyclometalating ligands†‡
Adam F. Henwooda,
James Webstera,
David Cordes b,
Alexandra M. Z. Slawinb,
Denis Jacquemin
 *cd and
Eli Zysman-Colman
 *a
*a
aOrganic Semiconductor Centre, EaStCHEM School of Chemistry, University of St Andrews, St Andrews, Fife, KY16 9ST, UK. E-mail: eli.zysman-colman@st-andrews.ac.uk; Web: http://www.zysman-colman.com Fax: +44-1334-463808; Tel: +44-1334-463826
bEaStCHEM School of Chemistry, University of St. Andrews, St. Andrews, KY16 9ST, Fife, UK
cLaboratoire CEISAM, UMR CNRS-6230, Université de Nantes, 2 Rue de la Houssinière, BP 92208, 44322 Nantes Cedex 3, France. E-mail: Denis.Jacquemin@univ-nantes.fr
dInstitut Universitaire de France, 1 rue Descartes, F-75231 Paris Cedex 05, France
First published on 12th May 2017
Abstract
The first examples of phosphorescent platinum(II) complexes bearing pentafluorosulfanyl (–SF5) substituted cyclometalating ligands (C^N) are reported. These complexes are of the form [Pt(C^N)(pivacac)], where pivacac is 2,2′,6,6′-tetramethylheptane-3,5-dionate. Modifying the phenyl ring of the C^N ligand to incorporate one strongly electron-withdrawing –SF5 group has important effects on the photophysical and electrochemical properties of the complex that are dependent on the regiochemistry of the substituent. In a meta position with respect to the Pt–CC^N bond, the substituent exerts a predominantly stabilising effect on the lowest triplet excited state that red-shifts the emission of the complex compared to the reference [Pt(ppy)(pivacac)], 1, where ppy is 2-phenylpyridinato. When the –SF5 group is located para to the Pt–CC^N bond, it does not affect the triplet state directly, and the electron-withdrawing group stabilises the metal-based orbitals, resulting in a blue-shift of the emission. In the solid-state all three complexes are mechanochromic, and can display excimeric emission originating from intermolecular π–π* interactions, but the relative emission intensities of the monomeric and dimeric excited states correlate with the steric congestion of the metal centre, and in particular the regiochemistry of the –SF5 group. We relate these findings with observations in the crystal structures.
Introduction
Phosphorescent transition metal complexes have for many years served as materials in a wide variety of applications including but not limited to photoredox catalysis,1 solar fuels,2 biological imaging3 and electroluminescent devices.4 Typically these complexes are comprised of metal ions such as Ir(III), Ru(II), and Re(I), all of which possess an octahedral coordination geometry. However, metal complexes displaying alternative geometries5 such as trigonal planar [Cu(I)6], linear [Pd(0);7 Au(I)8] and in particular square planar complexes such as those based on Pt(II),9 Pd(II)10 and Au(III)11 can also display an attractive and useful range of photophysical properties. Among these, Pt(II) complexes are the most widely explored due to the wide colour tunability and high photoluminescence quantum yields associated with these complexes.One of the archetypal phosphorescent Pt(II) complex families is of the form [Pt(C^N)(O^O)], containing two bidentate chelates, where C^N denotes a cyclometalating ligand such as 2-phenylpyridinato (ppy) and O^O is a β-diketonate ligand, such as 2,2′,6,6′-tetramethylheptane-3,5-dionate (pivacac).12 Depending on the nature of the C^N ligand, [Pt(C^N)(O^O)] complexes phosphoresce from a metal-to-ligand charge transfer (3MLCT) and/or a ligand centred (3LC) state.12a,13 However, the square planar geometry of Pt(II) complexes permits a secondary interaction facilitated by mixing filled 5dz2 and empty 6pz orbitals localized on the metals of closely spaced complexes.14 Formation of these dimers results in greatly red-shifted excimer emission from a distinct metal–metal-to-ligand charge transfer (3MMLCT) state15 or from interligand π–π* interactions, as also reported in purely organic systems.16 Generally, excimer emission can only be observed in concentrated media such as neat films, although certain dinuclear Pt(II) complexes, which are predisposed to form tight Pt⋯Pt interactions, can emit exclusively from 3MMLCT states even in dilute solution or doped films.17
Careful control over the relative contributions of the individual higher energy monomeric and lower energy excimeric states has led to many reports of Pt(II) complexes emitting white light. This feature has been exploited for the design of single-molecule white OLEDs (WOLEDs),18 as well as more recently for sensing applications.17
In the solid-state, it is common for these complexes to self-assemble in linear-chains to maximise bonding interactions between the complexes.14 Given the weak nature of the Pt–Pt bonding interaction, it is unsurprising that even minor structural variations in the ligand scaffold can influence the stacking arrangement. For example, Pt(N^N)(X)2 (where N^N is a bidentate diimine ligand such as 2,2′-bipyridine and X is a monodentate anionic ligand such as chloride) complexes form columnar assemblies in the solid-state with the ligands arranged in an anti-parallel fashion to maximise weak intermolecular bonding effects between the occupied orbitals of the anionic ligands and the vacant π* orbitals situated on the diimine ligands.14 Stronger effects, such as the electrostatics in the famous example of Magnus' salt [Pt(NH3)4][PtCl4],5,19 can further facilitate the Pt⋯Pt bonding phenomena, while sterically encumbering ligand substitutions can, on the other hand, disrupt these Pt⋯Pt interactions.20
Regiochemistry is a particularly important consideration, since there are numerous possible orientations these assemblies might adopt, with respect to both the metal centres (eclipsed and staggered) and the ligands (for example: syn, where both C^N and O^O ligands are arranged in an overlapping fashion, or anti where the ancillary ligands are directed away from each other to maximise C^N⋯C^N π–π interactions – see Fig. 1). As such, the predisposition to adopt a particular orientation is influenced by small changes in the ligand scaffolds. Furthermore, it is not uncommon for more than one packing arrangement to be possible for a particular complex, giving rise to phenomena such as polymorphism21 and mechanochromism.22
In our group, we recently reported on the photophysical properties of a series of cationic iridium complexes containing C^N ligands bearing pentafluorosulfanyl (–SF5) substituents.23 The electron-withdrawing –SF5 group was chosen as an alternative substituent for blue-shifting the emission of these complexes to the commonly used 2-(4,6-difluorophenyl)pyridinato, dFppy, ligand due to the interest in designing emitters that do not possess CAryl–F bonds as these have been shown to be unstable in electroluminescent devices.24 The –SF5 group is both chemically stable and sterically bulky, which makes it an attractive alternative functional group to fluorinated phenyl rings. However, for Ir(III) complexes, which adopt pseudo-spherical geometries, steric bulk does not significantly influence the optoelectronics of the complexes, although it can be important in influencing the photoluminescence quantum yield (ΦPL) by suppressing non-radiative decay pathways.25 Thus in this study we explore the effect of the addition of the –SF5 substituent on the C^N ligand of heteroleptic square planar Pt(II) complexes of the form [Pt(C^N)(O^O)], with the goal of not only documenting the magnitude of the blue-shifting power of this moiety, but also to understand how its steric bulk, and the regiochemistry of this steric bulk, influence the assembly of dimeric species in the solid state and the subsequent observation of excimer emission. The bulky pivacac (2,2′,6,6′-tetramethylheptane-3,5-dionate) ligand was chosen as the O^O ligand in the present study to magnify the steric interactions between the two ligands, to enhance the congestion around the metal centre and to direct the assembly towards an anti-type orientation. Chart 1 summarises the complexes under investigation in this study.
Results and discussion
Synthesis
Complex 1 contains an undecorated ppy ligand, L1, and serves as a reference complex (ppy = 2-phenylpyridinato). The cyclometalating pentafluorosulfanyl C^N ligands L2 and L3 were synthesized following our previous report.23 The synthesis of [Pt(C^N)(O^O)] complexes typically proceeds via the formation of mixtures of cis and trans chloro-bridged platinum complexes, in addition to the monomeric complex where one C^N ligand is fully cyclometalated and the remainder of the coordination sphere is occupied by a chloride and a second C^N ligand that coordinates in a monodentate fashion through the pyridyl nitrogen.26 This mixture of intermediates makes isolation of the platinum intermediate difficult. Thus, we modified the synthetic procedure to employ a two-step-one-pot protocol where K2PtCl4 in the presence of excess C^N ligand is refluxed in 2-methoxyethanol to give a mixture of the dimeric and monomeric intermediates. Without isolation of these intermediate platinum complexes, the solvent was removed before excess K2CO3 and 2,2,6,6-tetramethyl-3,5-heptanedione were added and the mixture stirred at room temperature in a solvent mixture of DCM/MeOH. The complexes were then purified by first filtering through a silica plug to remove platinum impurities and then stirring in hexanes to remove excess 2,2,6,6-tetramethyl-3,5-heptanedione. A final filtration resulted in the isolation of the pure complexes (yield = 43% for 1, 35% for 2 and 40% for 3).Characterisation
Complexes 1–3 were characterised by NMR spectroscopy (1H, 13C, 19F), melting point analysis, high resolution mass spectrometry and elemental analyses. The X-ray structure of 1 has been reported previously12b while the structures of 2 and 3 have been determined and are compared here to that of 1. In the 1H NMR spectra, coupling of the high-field (8.9–9.1 ppm) 1H resonances to the 34% abundant, spin 1/2 195Pt isotope was observed for all three complexes, indicative of cycloplatination. For complexes 2 and 3, 19F NMR showed the diagnostic pentet and doublet in a 1![[thin space (1/6-em)]](https://www.rsc.org/images/entities/char_2009.gif) :
:![[thin space (1/6-em)]](https://www.rsc.org/images/entities/char_2009.gif) 4 integral ratio, corresponding, respectively, to the single fluorine atom in a trans relationship with respect to the phenyl ring, and the four fluorine atoms in a cis relationship with the phenyl ring.
4 integral ratio, corresponding, respectively, to the single fluorine atom in a trans relationship with respect to the phenyl ring, and the four fluorine atoms in a cis relationship with the phenyl ring.
Single crystals of 2 and 3 were grown by slow diffusion of hexanes into concentrated DCM solutions. Both complexes display the expected square planar geometry about the platinum centre, with only minimal distortion out of the plane between the two ligands of each complex. In both cases, the shortest metal–ligand bond distance is the Pt–C bond, as is typical of cyclometalated transition metal complexes.12a Complex 1 shows a Pt–C bond length of 1.961 Å, which is longer than that of 2 [1.944(19) Å] but comparable with 3 [1.959(3) Å]. The values obtained through the DFT calculations on the molecules solvated in acetonitrile are 1.962 Å, 1.955 Å and 1.954 Å for 1, 2 and 3, respectively. Images of dimers of 1, 2 and 3 are given in Fig. 2.
Complexes 1 and 3 crystallise as dimers, and 2 forms multimeric columns. The pivacac ligands direct all the complexes into anti-configurations. The metal centres adopt a staggered arrangement, leading to long Pt⋯Pt distances (5.049 Å for 1; 4.686 Å for 2; 5.840 Å for 3). The longer distances associated with complexes 1 and 3 are due to metal centres that are offset in two dimensions, while complex 2 is only offset in one dimension so as to minimise steric interactions between adjacent –SF5 units oriented perpendicular to the Pt⋯Pt axes (Fig. 2).
The presence of the pivacac ligands prohibits the formation of significant Pt–Pt interactions, but encourages π–π stacking between the C^N ligands where the pyridine ring of each dimer forms a close contact with the phenyl ring of the adjacent C^N ligand. In contrast to the Pt⋯Pt distances, the C^Npyridine⋯C^Nphenyl centroid-to-centroid distances of adjacent C^N ligands are shorter for 1 (3.932 Å) and 3 (3.916 Å) than for 2 (4.036 Å); however, these distances are longer than the general range for π–π stacking,27 suggesting any interactions will be weak. The sequential stacking of electron-poor and electron-rich aryl rings is a common feature of Pt(II) complexes,14,28 and affects their photophysical properties since the frontier occupied orbitals are mainly localized on the metal and the C^Nphenyl orbitals while the LUMO (1) or LUMO+1 (2 and 3) are primarily located on the C^Npyridyl moieties (vide infra). Thus, while the Pt–Pt distance is often invoked to explain the observation of 3MMLCT emission, the C^Nphenyl–C^Npyridine centroid-to-centroid distances are also important parameters that moderate this specific interaction, and provide insight into inter-ligand π–π* contributions to excimer formation.28 The fact that the π–π distances seen in these complexes are beyond the common range of π-stacked rings suggests that if this stacking is an influence on the photophysical properties of these complexes, it is likely to be minor.
Finally, examining the extended crystal packing (Fig. 3) of 1–3, differences in packing arrangements can be seen in all three complexes. Complex 2 shows columnar structures, as individual complexes interact with those both above and below them to form extended, weakly-interacting chains running along the crystallographic b-axis. Complex 3 shows no extended π-interactions, but adjacent weakly-interacting dimers in the ac-plane show the same inclination, forming a sheet arrangement. Adjacent sheets have complexes oriented at approximately 40° to each other. Complex 1 presents a different behaviour to both 2 and 3. It arises from having two independent molecules of the complex, one of which packs to form dimers, the other of which does not. Dimers in this complex only pack adjacent to each other along the crystallographic a-axis; however, non-dimer-forming complexes above and below each dimer can also form C^Npyridine⋯C^Nphenyl π-interactions to the dimer, forming a tetrameric stack. These secondary π-interactions only involve the pyridine and not the phenyl of the C^N ligand of the non-dimer-forming complexes, and exist at a C^Npyridine⋯C^Nphenyl centroid-to-centroid distance of 3.927 Å, and the non-dimer forming complexes are oriented at approximately 20° to the dimers. As such, all three complexes show independent packing modes.
Electrochemical properties
Cyclic voltammetry (CV) measurements in MeCN were undertaken to estimate the energy levels of the frontier molecular orbitals of the complexes and to quantify the effects of the –SF5 substituent on their ground state electronics. The CV traces of 1–3 between the first oxidation and first reduction waves are shown in Fig. 4. The full reduction windows of complexes 2 (Fig. S9) and 3 (Fig. S10) are given in the ESI.† The relevant electrochemical data is given in Table 1. As is characteristic of cyclometalated Pt(II) complexes, the oxidation waves are poorly resolved and irreversible in nature, pointing towards a principally platinum centred PtII/PtIII redox couple.1a,12b The oxidation potential of 1 (Eox = 1.03 V) is marginally different from the previously reported value (Eox = 1.17 V), which we attribute to the literature value12b being reported in DMF compared to the current measurement in MeCN.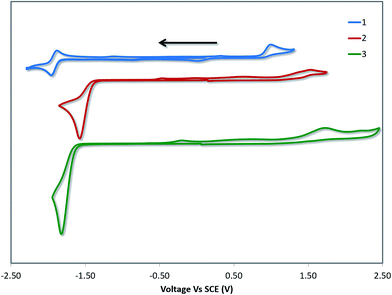 | ||
| Fig. 4 CV traces of 1–3 in MeCN solution, reported versus SCE (Fc/Fc+ = 0.38 V in MeCN).29 Scans are in the negative scan direction at a scan rate of 100 mV s−1. | ||
DFT calculations depict the radical cation spin density of 1–3 as localized on a combination of metal, pivacac and phenyl ring, with the –SF5 mainly playing an inductive role (see Fig. 5). This explains the anodic shift of the oxidation potentials of both 2 (Eox = 1.55 V) and 3 (Eox = 1.76 V) compared to reference complex 1. The –SF5 group exerts a stronger effect in 3 where it is para to the Pt–CC^N bond than in 2 where it is located meta to this bond. Indeed, the difference in oxidation potential correlates with the Hammett values of the –SF5 group (σm = 0.61, σp = 0.68), where the –SF5 acts as an inductively electron-withdrawing group, regardless of its regiochemistry.
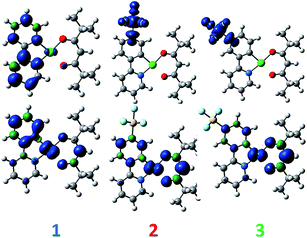 | ||
| Fig. 5 DFT-computed spin density difference plots of the radical anion (top) and radical cation (bottom) of complexes 1–3. | ||
There is a less straightforward structure–property trend when considering the reduction potentials of the three complexes. For 1, the reduction is reversible in nature (Ered = −1.90 V) and is attributed by DFT to the reduction of the pyridine ring of the C^N ligand (Fig. 5). By contrast, the first reduction potentials of both 2 (Ered = −1.57 V) and 3 (Ered = −1.82 V) are irreversible and multi-electron in nature, which is a behaviour consistent with reduction of the –SF5.23 Indeed, the DFT calculations of the radical anion of 2 and 3 depict a spin density located almost exclusively on this group. This is also in line with what we had previously observed23 with cationic iridium complexes bearing –SF5 substituted C^N ligands where their reduction onsets occurred in similar regimes (Ered = −1.60–−1.80 V). A second set of reversible reduction waves was observed for 2 and 3 (Fig. S9 and S10† and Table 1) that we attributed to the analogous reduction of the pyridine ring of the C^N ligand that was observed for 1. These reduction potentials are significantly more cathodically shifted than the reduction observed in 1, with the value for 2 (Ered2 = −2.28 V) marginally more negative than 3 (Ered2 = −2.20 V). Although not a true description of the diradical anion, DFT calculations of the LUMO+1 of 2 and 3 depict orbital plots that are primarily C^Npyridyl in nature (vide infra), which is in line with our assignments.
UV-vis absorption
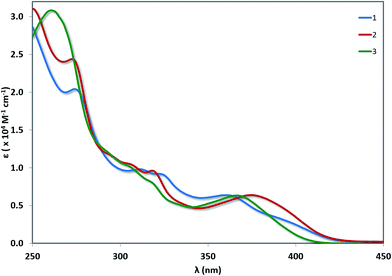
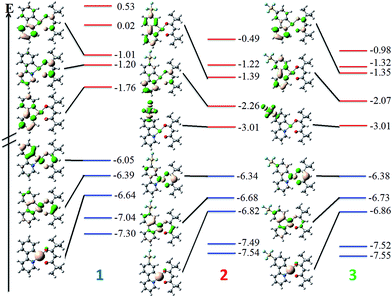
UV-vis absorption spectra for 1–3 are shown in Fig. 6 with the data summarised in Table 2. The TD-DFT simulated spectra (Fig. S14†) show that theory reproduces the main experimental trends. At high energy (250–300 nm), π–π* transitions with large extinction coefficients (ε = 2.0–3.1 × 10⁴ M−1 cm−1), mainly involving the C^N ligands, dominate for all three of these complexes. The highest energy transitions for 1 (Expt: 275 nm, Theor: 262 nm) and 2 (Expt: 274 nm, Theor: 263 nm) are red-shifted compared to that of 3 (Expt: 262 nm, Theor: 255 nm). At longer wavelengths (350–450 nm), broad unstructured absorption bands with smaller extinction coefficients dominate (ε < 1.0 × 10⁴ M−1 cm−1). For complex 1, one distinct band can be identified at 362 nm as well as a less resolved shoulder at 398 nm. TD-DFT predicts the three lowest dipole-allowed transitions at 372 nm (f = 0.05), 356 nm (f = 0.01) and 355 nm (f = 0.11). They are principally ascribed to HOMO → LUMO, HOMO-2 → LUMO and HOMO-1 → LUMO transitions, respectively. The MO diagram is given in Fig. 7. It shows that these transitions are predominantly metal-to-ligand charge transfer (1MLCT) character, as expected, along with some ligand-to-ligand charge transfer (LLCT from pivacac to C^Npyridyl) and some intra-ligand charge transfer (ILCT from C^Nphenyl to C^Npyridyl). By contrast, only one CT band is distinguishable for both 2 and 3, with the CT band of 2 (Expt: 376 nm, Theor: 372 nm) being modestly red-shifted compared to 3 (Expt: 369 nm, Theor: 350 nm). In 2, this band is mainly due to two closely lying excited states according to TD-DFT, the first at 379 nm (f = 0.09) the second at 362 nm (f = 0.07), that both imply transitions from both HOMO and HOMO-1 to LUMO+1, which can be ascribed to CT from the Pt, pivacac and phenyl ring towards the pyridyl moiety. In 3, the situation is very similar with two states at 357 nm (f = 0.07) the second at 346 nm (f = 0.09) involving the same MOs as in 2. As can be seen in Fig. 7 the LUMO of both 2 and 3 present almost the same energy, and the blue-shift of the CT band in 3 compared to 2, is related to the slight stabilization of the HOMO orbital in the former complex.| Complex | λabs (nm) [ε (×104 M−1 cm−1)] | ||||||||||||||||||||||||||||||||||||||||||||||||||||||||||||||||||||||||||||||||||||||||||||||||||
|---|---|---|---|---|---|---|---|---|---|---|---|---|---|---|---|---|---|---|---|---|---|---|---|---|---|---|---|---|---|---|---|---|---|---|---|---|---|---|---|---|---|---|---|---|---|---|---|---|---|---|---|---|---|---|---|---|---|---|---|---|---|---|---|---|---|---|---|---|---|---|---|---|---|---|---|---|---|---|---|---|---|---|---|---|---|---|---|---|---|---|---|---|---|---|---|---|---|---|---|
| a Measurements were carried out in aerated MeCN at room temperature. | |||||||||||||||||||||||||||||||||||||||||||||||||||||||||||||||||||||||||||||||||||||||||||||||||||
| 1 | 275 [2.04], 312 [0.98], 325 [0.90], 362 [0.64], 398(sh) [0.28] | ||||||||||||||||||||||||||||||||||||||||||||||||||||||||||||||||||||||||||||||||||||||||||||||||||
| 2 | 274 [2.42], 297(sh) [1.13], 307(sh) [1.04], 319 [0.96], 376 [0.64] | ||||||||||||||||||||||||||||||||||||||||||||||||||||||||||||||||||||||||||||||||||||||||||||||||||
| 3 | 262 [3.08], 294(sh) [1.18], 307(sh) [0.99], 319(sh) [0.79], 369 [0.63] | ||||||||||||||||||||||||||||||||||||||||||||||||||||||||||||||||||||||||||||||||||||||||||||||||||
Emission spectroscopy
The photoluminescence properties of 1–3 were studied in MeCN solution at 298 K and in the solid state. Their emission profiles in MeCN are shown in Fig. 8, and the relevant photophysical data are given in Table 3. In MeCN solution, the complexes exhibit blue-green to green luminescence. Their emission profiles are highly structured, pointing towards an excited state that possesses a significant triplet ligand centred (3LC) character. 3LC emission is common for heteroleptic platinum complexes bearing O^O-type ligands, as the triplet energies of O^O ligands are normally too high for them to participate in the transitions associated with the T1 excited state. The photoluminescence quantum yields, ΦPL, of 2 and 3 in MeCN are significantly lower than of 1 despite their somewhat similar emission energies, suggesting that not only does the increased steric bulk of the –SF5 not suppress non-radiative decay channels, this substituent in fact promotes larger non-radiative decay kinetics as evidence by the threefold increase in knr.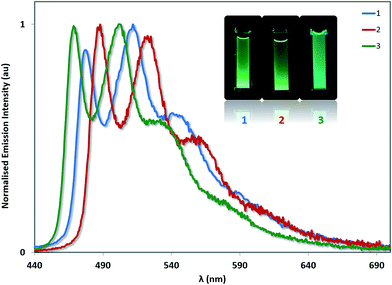 | ||
| Fig. 8 Solution-state emission spectra of 1–3 in MeCN solution. Inset: photographs of complexes 1–3 in MeCN solution under UV irradiation. | ||
| Complex | λemb (nm) | ΦPLc (%) | τed (μs) | kr × 104 s−1 | knr × 105 s−1 | ||||||||||||||||||||||||||||||||||||||||||||||||||||||||||||||||||||||||||||||||||||||||||||||
|---|---|---|---|---|---|---|---|---|---|---|---|---|---|---|---|---|---|---|---|---|---|---|---|---|---|---|---|---|---|---|---|---|---|---|---|---|---|---|---|---|---|---|---|---|---|---|---|---|---|---|---|---|---|---|---|---|---|---|---|---|---|---|---|---|---|---|---|---|---|---|---|---|---|---|---|---|---|---|---|---|---|---|---|---|---|---|---|---|---|---|---|---|---|---|---|---|---|---|---|
| a Measurements at 298 K in deaerated MeCN.b λexc: 360 nm.c Quinine sulfate used as the reference (ΦPL = 54.6% in 0.5 M H2SO4 at 298 K).33d λexc: 375 nm. | |||||||||||||||||||||||||||||||||||||||||||||||||||||||||||||||||||||||||||||||||||||||||||||||||||
| 1 | 477, 512, 541 | 22.6 | 2.54 | 8.90 | 3.05 | ||||||||||||||||||||||||||||||||||||||||||||||||||||||||||||||||||||||||||||||||||||||||||||||
| 2 | 488, 523, 561 | 7.5 | 0.89 | 8.43 | 10.4 | ||||||||||||||||||||||||||||||||||||||||||||||||||||||||||||||||||||||||||||||||||||||||||||||
| 3 | 468, 502, 533 | 8.4 | 0.88 | 9.55 | 10.4 | ||||||||||||||||||||||||||||||||||||||||||||||||||||||||||||||||||||||||||||||||||||||||||||||
| Complex | λema (nm) | ΦPLb (%) | τec (ns) | τed (ns) | |||||||||||||||||||||||||||||||||||||||||||||||||||||||||||||||||||||||||||||||||||||||||||||||
|---|---|---|---|---|---|---|---|---|---|---|---|---|---|---|---|---|---|---|---|---|---|---|---|---|---|---|---|---|---|---|---|---|---|---|---|---|---|---|---|---|---|---|---|---|---|---|---|---|---|---|---|---|---|---|---|---|---|---|---|---|---|---|---|---|---|---|---|---|---|---|---|---|---|---|---|---|---|---|---|---|---|---|---|---|---|---|---|---|---|---|---|---|---|---|---|---|---|---|---|
| a λexc: 360 nm.b Measured using an integrating sphere.c λexc: 375 nm; collected at the principal 3LC band.d λexc: 375 nm; collected at the principal 3CT band.e Neat film.f Powder emission before grinding.g Powder emission after grinding. | |||||||||||||||||||||||||||||||||||||||||||||||||||||||||||||||||||||||||||||||||||||||||||||||||||
| 1e | 488, 523, 629 | 6.8 | 73.42 (33%); 256.8 (42%); 2316 (25%) | 801.5 | |||||||||||||||||||||||||||||||||||||||||||||||||||||||||||||||||||||||||||||||||||||||||||||||
| 1f | 520, 555 | — | 2118 (21%), 5653 (79%) | — | |||||||||||||||||||||||||||||||||||||||||||||||||||||||||||||||||||||||||||||||||||||||||||||||
| 1g | 484, 553, 616 | — | 233.8 (9%), 968.5 (44%), 3010 (47%) | 1882 (82%), 7274 (18%) | |||||||||||||||||||||||||||||||||||||||||||||||||||||||||||||||||||||||||||||||||||||||||||||||
| 2e | 494, 530, 569 | 7.9 | 13.71 (3%); 393.8 (13%); 2072 (85%) | — | |||||||||||||||||||||||||||||||||||||||||||||||||||||||||||||||||||||||||||||||||||||||||||||||
| 2f | 492, 528, 565 | — | 1712 (18%), 6339 (89%) | — | |||||||||||||||||||||||||||||||||||||||||||||||||||||||||||||||||||||||||||||||||||||||||||||||
| 2g | 492, 528, 566 | — | 448.4 (6%), 2002 (44%), 4801 (50%) | 1544 (28%), 5477 (72%) | |||||||||||||||||||||||||||||||||||||||||||||||||||||||||||||||||||||||||||||||||||||||||||||||
| 3e | 485, 523, 614 | 15.3 | 19.92 (4%), 357.7 (21%) 1778 (75%) | 1345 | |||||||||||||||||||||||||||||||||||||||||||||||||||||||||||||||||||||||||||||||||||||||||||||||
| 3f | 483, 512, 545 | — | 1850 (22%), 5102 (78%) | — | |||||||||||||||||||||||||||||||||||||||||||||||||||||||||||||||||||||||||||||||||||||||||||||||
| 3g | 476, 512, 555, 639 | — | 153.8 (9%), 1823 (48%), 2435 (44%) | 1347 (73%), 2942 (27%) | |||||||||||||||||||||||||||||||||||||||||||||||||||||||||||||||||||||||||||||||||||||||||||||||
The photophysics for 1 have been reported multiple times. In the original report of this complex, the emission maximum in 2-MeTHF at 77 K was found to be 477 nm.12a At room temperature, the photophysical properties of 1 have been reported in n-hexane (λem = 488, 524 nm, ΦPL = 15%),30 cyclohexane (λem = 485 nm, ΦPL = 33%),12b DCM (λem = 485 nm, ΦPL = 35%),30 chloroform (λem = 486, 518 nm, ΦPL = 19%)31 and THF (λem = 485, 519 nm, ΦPL = 16%).32 These solvents are less polar than MeCN, which perhaps accounts for the moderate blue-shift we have measured here (λem = 477, 512 nm). Our quantum yield (ΦPL = 22.6%) falls within the range of values previously reported (ΦPL = 16–35%).
Complex 3 emits the bluest of the three complexes (λPL = 468 nm for the E0,0 band). The higher energy emission also matches with the more stabilised oxidation potential and the more blue-shifted absorption onset for 3 compared to 1 or 2. Unexpectedly, the emission of 2 (λPL = 488 nm for the E0,0 band) is red-shifted compared to that of 1 (λPL = 477 nm for the E0,0 band), despite a moderately more stabilised oxidation potential and essentially identical absorption onset compared to 1. Thus, there is no direct connection between the trends observed for ground- and excited-state optoelectronic properties for 2. Both complexes 2 and 3 are less emissive than 1 (ΦPL = 7.5% for 2 and 8.4% for 3).
DFT computed spin density plots of the T1 states (see Fig. S15†) help to explain the divergent ground and excited states behaviour observed in 2. In all cases, these plots show spin density that is delocalised throughout the C^N ligand corroborating the assignment of the dominant 3LC character of the emission. In addition, the spin density plots reveal some metal character in the T1 state, especially in 2 and 3. Indeed, we note that the Mulliken β charge of the Pt centre is only 0.26 in 1 but increases to 0.85 and 0.86 in 2 and 3, respectively. This clearly suggests that there is also a 3MLCT contribution in the emission. In the case of 2 the –SF5 substituent is attached to a carbon atom displaying a strong spin density, and this group therefore directly contributes to stabilizing T1. By contrast, in 3, the same substituent is attached to a carbon atom acting as a node in the triplet spin density, so that it is not involved directly in the T1 state, explaining why the emission of 2 is significantly red-shifted compared to both 1 and 3.
It is difficult to find a family of comparable examples with which to cross compare the optoelectronic properties of complexes 1–3. However, the photophysics of [Pt(ppy)(acac)] (where acac is pentane-3,5-dionate) has been reported in DCM (λPL = 485 nm).30 This value falls between those reported34 for two complexes bearing electron-withdrawing –BMes2 substituents in a meta (λPL = 538 nm) and para (λPL = 481 nm) relationship with respect to the Pt–CC^N, analogous to the trend we observe for 1–3.
Aside from its stronger electron-withdrawing nature, the –SF5 moiety is also a large and sterically bulky substituent that can also impact the solid-state packing of these complexes and as a consequence their photophysical properties. To investigate the impact of the –SF5 group on the degree of excimer emission, we recorded the emission spectra of 1–3 as neat thin films by spin-coating concentrated toluene solutions of each complex onto quartz substrates (Fig. 9). It should be noted that in doped films (up to 37 wt% in a PVK/OXD-7 host), 1 has been shown previously to display 3LC emission almost exclusively from its monomeric state, with minimal red-shifted excimer emission arising from Pt–Pt aggregates.31 By contrast, in the neat film we observe predominantly excimer emission as well as some monomeric 3LC contributions for 1 (Table 4). The excited state lifetime measured for 1 on the principal 3LC band (λem: 488 nm) is multicomponent in nature, with a significant contribution from a long-lived component (τe = 2.32 μs) (Fig. S11†). The lifetime measured on the excimeric band (λem: 629 nm) is single component and shorter (τe = 0.80 μs) (Fig. S12†).
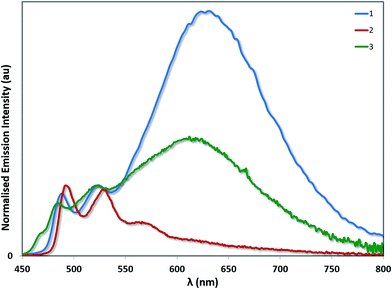 | ||
| Fig. 9 Solid-state emission spectra of complexes 1–3. The emission profiles have been normalised on the principal 3LC band for each complex. | ||
The neat film photophysics of 2 and 3 reveal contrasting phenomena. Complex 2 emits exclusively from its monomeric state, while 3 mirrors that of 1, emitting from a combination of 3LC and excimeric states. The relative intensity of the excimer to the 3LC emission in 1 is greater than in 3, suggesting that excimer formation is more facile in the case of 1 due to the increased steric hindrance conferred by the –SF5 group in 3. In the excited state lifetimes, the 3LC emission of 2 and 3 both have long lived contributions (τe = 2.07 μs for 2 and 1.78 μs for 3). However, only 3 exhibits a single component lifetime base on the excimer band (τe = 1.35 μs for 3). The quantum yields for 1 (ΦPL = 6.8%) and 2 (ΦPL = 7.9%) are diminished in the solid state, but that of 3 (ΦPL = 15.3%) is moderately enhanced.
To determine if the presence of excimeric emission in 3 and its absence in 2 is directly related to difference between meta and para substitutions, we performed DFT calculations on dimers of these two compounds, considering one of the complex in its S0 geometry and the other in its T1 structure. The optimization of these structures led to excimeric dimers presenting very similar interaction energies (see the ESI†), with distances between the two complexes closer than in the XRD structures, as expected. The TD-DFT calculations performed on the dimer of 2 revealed additional red-shifted transitions compared to the monomer, and the same holds for 3. This clearly hints that the experimentally observed differences of emission in the solid-state (Fig. 9) are related to the packing of the compounds rather than to their intrinsic electronic structures.
Thus, we can tentatively draw parallels between the solid-state structures and the photophysical properties in the neat film. All three complexes show long Pt–Pt distances in their crystal structures, which precludes 3MMLCT states from making a significant contribution to the excimeric state. Indeed, the shortest Pt–Pt distance is observed for complex 2, while this complex displays essentially no excimer emission in the film. Thus the dominant excimer interaction in these complexes is likely to be controlled by inter-ligand π–π interactions, which although less common, has been reported previously.16a,35 In addition, previously reported theoretical studies on significantly less sterically bulky complexes than 1–3 also argue for significant π–π* contributions to the excimer, making it plausible that this is the dominant interaction in this instance.16b Although all three complexes pack differently in the solid-state, the shorter C^Npyridine–C^Nphenyl centroid-to-centroid distances of opposing C^N ligands measured for 1 (3.932 Å) and 3 (3.916 Å) than for complex 2 (4.036 Å) might explain our observations of interligand π–π* emission only from 1 and 3. Furthermore, the solid-state packing of 1 and 3 are related by their formation of dimeric structures (with additional secondary interactions in 1 giving rise to tetrameric structures), while by contrast, 2 forms multimeric columnar structures throughout the crystal.
A related trend is observed in the powder photophysics. All the powder samples show green/blue-green luminescence under UV light. However, upon grinding the powders, red-shifted excimer emission was observed, demonstrating the mechanochromic properties of 1–3 (see Fig. 10 and S13†).22 However, these effects were significantly more pronounced in the case of 1 and 3, than for 2 thereby demonstrating that excimer formation is much more facile in the cases of 1 and 3. Monomer emission for all three complexes could be restored by redissolving the ground powder in a volatile solvent such as DCM.
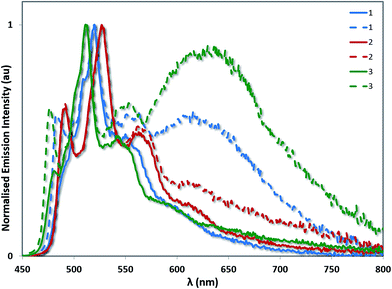 | ||
| Fig. 10 Powder emission spectra of complexes 1–3 before (solid lines) and after grinding (dashed lines). The emission profiles have been normalised on the principal 3LC band for each complex. | ||
Conclusions
Two isomeric [Pt(C^N)(pivacac)] complexes 2 and 3 bearing strongly electron-withdrawing –SF5 substituents on the phenyl ring of the C^N ligand have been synthesised and their optoelectronic properties have been compared to the reference complex [Pt(ppy)(pivacac)], 1, where there is no substituent on the phenyl ring. The regiochemistry of the –SF5 exerts a strong effect on the photophysical properties of the complex. In 2, where the –SF5 is in a meta-relationship with respect to the Pt–C bond, the emission profile of the complex is red-shifted compared to when there is no –SF5 (1) while in 3, the emission is blue-shifted compared to 1. This is rationalised on the basis of DFT calculations: in the case of 2, spin-density contributions coming from the –SF5 group lead to a stabilisation of the T1 state of 2 relative to 1 and 3; in the case of 3, the –SF5 is situated at a nodal position on the C^N phenyl ring, and thus acts only to stabilise the metal-orbitals and thus blue-shift the emission. In the solid-state, the steric bulk (and regiochemistry of this steric bulk) of the –SF5 dictates the capacity of these complexes to display excimeric emission. Complex 1, which has no functionality on the C^N ligand, emits from an overwhelmingly π–π* dominated excimeric state (with only minimal monomeric 3LC contributions). Complex 2 is sensitive to the meta relationship of the –SF5 with respect to the metal centre, showing emission only from the monomeric 3LC state in neat film. The para relationship of the –SF5 with respect to the metal is not enough to dissuade the formation of excimers for this complex, although the intensity of emission relative to monomeric 3LC emission is less pronounced than for 1.Acknowledgements
EZ-C acknowledges the University of St Andrews for financial support. We thank Johnson Matthey and Umicore AG for the gift of materials. We would like to thank the Engineering and Physical Sciences Research Council for financial support for Adam Henwood: EPSRC DTG Grants: EP/J500549/1; EP/K503162/1; EP/L505097/1. We thank the EPSRC UK National Mass Spectrometry Facility at Swansea University for analytical services. DJ thanks the LumoMat RFI project for support. This research used computational resources of (i) the GENCI-CINES/IDRIS; (ii) CCIPL (Centre de Calcul Intensif des Pays de Loire); (iii) a local Troy cluster.References
- (a) W. J. Choi, S. Choi, K. Ohkubo, S. Fukuzumi, E. J. Cho and Y. You, Chem. Sci., 2015, 6, 1454–1464 RSC; (b) C. K. Prier, D. A. Rankic and D. W. C. MacMillan, Chem. Rev., 2013, 113, 5322–5363 CrossRef CAS PubMed.
- (a) Z. Han and R. Eisenberg, Acc. Chem. Res., 2014, 47, 2537–2544 CrossRef CAS PubMed; (b) L. L. Tinker, N. D. McDaniel and S. Bernhard, J. Mater. Chem., 2009, 19, 3328 RSC; (c) E. S. Andreiadis, M. Chavarot-Kerlidou, M. Fontecave and V. Artero, Photochem. Photobiol., 2011, 87, 946–964 CrossRef CAS PubMed.
- (a) For recent reviews see: K. K.-W. Lo, M.-W. Louie and K. Y. Zhang, Coord. Chem. Rev., 2010, 254, 2603–2622 CrossRef CAS; (b) K. K.-W. Lo and K. K.-S. Tso, Inorg. Chem. Front., 2015, 2, 510–524 RSC; (c) S. W. Botchway, M. Charnley, J. W. Haycock, A. W. Parker, D. L. Rochester, J. A. Weinstein and J. A. G. Williams, Proc. Natl. Acad. Sci. U. S. A., 2008, 105, 16071–16076 CrossRef CAS PubMed.
- (a) D. Ma, T. Tsuboi, Y. Qiu and L. Duan, Adv. Mater., 2017, 29, 1603253 CrossRef PubMed; (b) X. Wang, T. Peng, C. Nguyen, Z.-H. Lu, N. Wang, W. Wu, Q. Li and S. Wang, Adv. Funct. Mater., 2017, 27, 1604318 CrossRef; (c) X. C. Hang, T. Fleetham, E. Turner, J. Brooks and J. Li, Angew. Chem., Int. Ed., 2013, 52, 6753–6756 CrossRef CAS PubMed; (d) X. Yang, G. Zhou and W.-Y. Wong, Chem. Soc. Rev., 2015, 44, 8484–8575 RSC.
- V. W. Yam, V. K. Au and S. Y. Leung, Chem. Rev., 2015, 115, 7589–7728 CrossRef CAS PubMed.
- (a) K. J. Lotito and J. C. Peters, Chem. Commun., 2010, 46, 3690–3692 RSC; (b) V. A. Krylova, P. I. Djurovich, J. W. Aronson, R. Haiges, M. T. Whited and M. E. Thompson, Organometallics, 2012, 31, 7983–7993 CrossRef CAS; (c) M. Elie, F. Sguerra, F. Di Meo, M. D. Weber, R. Marion, A. Grimault, J. F. Lohier, A. Stallivieri, A. Brosseau, R. B. Pansu, J. L. Renaud, M. Linares, M. Hamel, R. D. Costa and S. Gaillard, ACS Appl. Mater. Interfaces, 2016, 8, 14678–14691 CrossRef CAS PubMed.
- A. F. Henwood, M. Lesieur, A. K. Bansal, V. Lemaur, D. Beljonne, D. G. Thompson, D. Graham, A. M. Z. Slawin, I. D. W. Samuel, C. S. J. Cazin and E. Zysman-Colman, Chem. Sci., 2015, 6, 3248–3261 RSC.
- X. He and V. W.-W. Yam, Coord. Chem. Rev., 2011, 255, 2111–2123 CrossRef CAS.
- (a) J. Kalinowski, V. Fattori, M. Cocchi and J. A. G. Williams, Coord. Chem. Rev., 2011, 255, 2401–2425 CrossRef CAS; (b) B. X. Yang, C. Yao and G. Zhou, Platinum Met. Rev., 2013, 57, 2–16 CrossRef; (c) K. Li, G. S. Ming Tong, Q. Wan, G. Cheng, W.-Y. Tong, W.-H. Ang, W.-L. Kwong and C.-M. Che, Chem. Sci., 2016, 7, 1653–1673 RSC.
- (a) P. K. Chow, C. Ma, W.-P. To, G. S. M. Tong, S.-L. Lai, S. C. F. Kui, W.-M. Kwok and C.-M. Che, Angew. Chem., Int. Ed., 2013, 52, 11775–11779 CrossRef CAS PubMed; (b) P.-K. Chow, G. Cheng, G. S. M. Tong, C. Ma, W.-M. Kwok, W.-H. Ang, C. Y.-S. Chung, C. Yang, F. Wang and C.-M. Che, Chem. Sci., 2016, 7, 6083–6098 RSC; (c) Z.-Q. Zhu, T. Fleetham, E. Turner and J. Li, Adv. Mater., 2015, 27, 2533–2537 CrossRef CAS PubMed.
- (a) C. Bronner and O. S. Wenger, Dalton Trans., 2011, 40, 12409–12420 RSC; (b) M. Zhang, C. Zhu and L.-W. Ye, Synthesis, 2017, 49(6), 1150–1157 CAS.
- (a) J. Brooks, Y. Babayan, S. Lamansky, P. I. Djurovich, I. Tsyba, R. Bau and M. E. Thompson, Inorg. Chem., 2002, 41, 3055–3066 CrossRef CAS PubMed; (b) A. Bossi, A. F. Rausch, M. J. Leitl, R. Czerwieniec, M. T. Whited, P. I. Djurovich, H. Yersin and M. E. Thompson, Inorg. Chem., 2013, 52, 12403–12415 CrossRef CAS PubMed.
- (a) A. F. Rausch, L. Murphy, J. A. G. Williams and H. Yersin, Inorg. Chem., 2011, 51, 312–319 CrossRef PubMed; (b) A. Rausch, H. Homeier and H. Yersin, ed. A. J. Lees, Organometallic Pt(II) and Ir(III) Triplet Emitters for OLED Applications and the Role of Spin–Orbit Coupling: A Study Based on High-Resolution Optical Spectroscopy, Photophysics of Organometallics, Springer, Berlin/Heidelberg, 2010, pp. 193–235 Search PubMed.
- W. B. Connick, R. E. Marsh, W. P. Schaefer and H. B. Gray, Inorg. Chem., 1997, 36, 913–922 CrossRef CAS.
- A. Aliprandi, D. Genovese, M. Mauro and L. De Cola, Chem. Lett., 2015, 44, 1152–1169 CrossRef CAS.
- (a) J. A. Bailey, M. G. Hill, R. E. Marsh, V. M. Miskowski, W. P. Schaefer and H. B. Gray, Inorg. Chem., 1995, 34, 4591–4599 CrossRef CAS; (b) D. Kim and J.-L. Brédas, J. Am. Chem. Soc., 2009, 131, 11371–11380 CrossRef CAS PubMed.
- (a) C. Zhou, L. Yuan, Z. Yuan, N. K. Doyle, T. Dilbeck, D. Bahadur, S. Ramakrishnan, A. Dearden, C. Huang and B. Ma, Inorg. Chem., 2016, 55, 8564–8569 CrossRef CAS PubMed; (b) M. Han, Y. Tian, Z. Yuan, L. Zhu and B. Ma, Angew. Chem., Int. Ed., 2014, 53, 10908–10912 CrossRef CAS PubMed.
- T. Fleetham, L. Huang and J. Li, Adv. Funct. Mater., 2014, 24, 6066–6073 CrossRef CAS.
- M. Atoji, J. W. Richardson and R. E. Rundle, J. Am. Chem. Soc., 1957, 79, 3017–3020 CrossRef CAS.
- (a) S. B. Ko, H. J. Park, S. Gong, X. Wang, Z. H. Lu and S. Wang, Dalton Trans., 2015, 44, 8433–8443 RSC; (b) C.-H. Chen, F.-I. Wu, Y.-Y. Tsai and C.-H. Cheng, Adv. Funct. Mater., 2011, 21, 3150–3158 CrossRef CAS.
- V. W.-W. Yam, K. M.-C. Wong and N. Zhu, J. Am. Chem. Soc., 2002, 124, 6506–6507 CrossRef CAS PubMed.
- (a) M. Krikorian, S. Liu and T. M. Swager, J. Am. Chem. Soc., 2014, 136, 2952–2955 CrossRef CAS PubMed; (b) A. Han, P. Du, Z. Sun, H. Wu, H. Jia, R. Zhang, Z. Liang, R. Cao and R. Eisenberg, Inorg. Chem., 2014, 53, 3338–3344 CrossRef CAS PubMed; (c) Y. Sagara, S. Yamane, M. Mitani, C. Weder and T. Kato, Adv. Mater., 2016, 28, 1073–1095 CrossRef CAS PubMed.
- N. M. Shavaleev, G. Xie, S. Varghese, D. B. Cordes, A. M. Z. Slawin, C. Momblona, E. Ortí, H. J. Bolink, I. D. W. Samuel and E. Zysman-Colman, Inorg. Chem., 2015, 54, 5907–5914 CrossRef CAS PubMed.
- P. R. Savoie and J. T. Welch, Chem. Rev., 2014, 115, 1130–1190 CrossRef PubMed.
- (a) V. N. Kozhevnikov, Y. Zheng, M. Clough, H. A. Al-Attar, G. C. Griffiths, K. Abdullah, S. Raisys, V. Jankus, M. R. Bryce and A. P. Monkman, Chem. Mater., 2013, 25, 2352–2358 CrossRef CAS; (b) A. F. Henwood, A. K. Bansal, D. B. Cordes, A. M. Z. Slawin, I. D. W. Samuel and E. Zysman-Colman, J. Mater. Chem. C, 2016, 4, 3726–3737 RSC; (c) G. G. Shan, H. B. Li, H. Z. Sun, H. T. Cao, D. X. Zhu and Z. M. Su, Dalton Trans., 2013, 42, 11056–11065 RSC.
- J.-Y. Cho, K. Y. Suponitsky, J. Li, T. V. Timofeeva, S. Barlow and S. R. Marder, J. Organomet. Chem., 2005, 690, 4090–4093 CrossRef CAS.
- C. Janiak, J. Chem. Soc., Dalton Trans., 2000, 3885–3896 RSC.
- Y.-J. Cho, S.-Y. Kim, H.-J. Son, D. W. Cho and S. O. Kang, Phys. Chem. Chem. Phys., 2017 10.1039/C1036CP08651A.
- V. V. Pavlishchuk and A. W. Addison, Inorg. Chim. Acta, 2000, 298, 97–102 CrossRef CAS.
- C. Karakus, L. H. Fischer, S. Schmeding, J. Hummel, N. Risch, M. Schaferling and E. Holder, Dalton Trans., 2012, 41, 9623–9632 RSC.
- D. Kourkoulos, C. Karakus, D. Hertel, R. Alle, S. Schmeding, J. Hummel, N. Risch, E. Holder and K. Meerholz, Dalton Trans., 2013, 42, 13612–13621 RSC.
- (a) Z. M. Hudson, B. A. Blight and S. Wang, Org. Lett., 2012, 14, 1700–1703 CrossRef CAS PubMed; (b) S. W. Thomas Iii, S. Yagi and T. M. Swager, J. Mater. Chem., 2005, 15, 2829 RSC.
- W. H. Melhuish, J. Phys. Chem., 1961, 65, 229–235 CrossRef CAS.
- Y.-L. Rao, D. Schoenmakers, Y.-L. Chang, J.-S. Lu, Z.-H. Lu, Y. Kang and S. Wang, Chem. – Eur. J., 2012, 18, 11306–11316 CrossRef CAS PubMed.
- V. M. Miskowski and V. H. Houlding, Inorg. Chem., 1989, 28, 1529–1533 CrossRef CAS.
Footnotes |
| † Electronic supplementary information (ESI) available: Synthesis, characterization, details of photophysical measurements and supplementary theoretical data can be found in the extra supporting information (ESI) document. CCDC 1532909 and 1532910 contain the supplementary crystallographic data for this paper. For ESI and crystallographic data in CIF or other electronic format see DOI: 10.1039/c7ra03190d |
| ‡ Data supporting this study are available at http://dx.doi.org/10.17630/4b7e9abe-51b4-4189-8db2-ec365cb9839d. |
| This journal is © The Royal Society of Chemistry 2017 |


