 Open Access Article
Blue-shifted emission and enhanced quantum efficiency via π-bridge elongation in carbazole–carborane dyads†
Zhaojin
Wang
a,
Peng
Jiang
a,
Tianyu
Wang
a,
Graeme J.
Moxey
b,
Marie P.
Cifuentes
ab,
Chi
Zhang
*a and
Mark G.
Humphrey
*ab
aSchool of Chemical and Material Engineering, Jiangnan University, Wuxi 214122, Jiangsu Province, China. E-mail: mark.humphrey@jiangnan.edu.cn
bResearch School of Chemistry, Australian National University, Canberra, ACT 2601, Australia. E-mail: Mark.Humphrey@anu.edu.au
First published on 20th May 2016
Abstract
Carbazole–carborane linear dyads and di(carbazole)–carborane V-shaped dyads with phenyleneethynylene-based bridges have been synthesized. The V-shaped dyads display the expected red-shifts in the location of their UV-Vis absorption maxima on bridge-lengthening, but show unusual blue-shifts in charge-transfer (CT) emission on the same π-system lengthening. These blue-shifts can be attributed to the 2n + 3 electron count within the carborane cluster in the excited state. The linear dyads luminesce via a combination of local excited (LE) and CT emission, with a red-shift in LE emission and a blue-shift in CT emission accompanying π-bridge elongation. A quantum efficiency as high as 86% in the solution state is achieved from the hybrid LE/CT emission. Time-dependent density functional theory (TD-DFT) calculations at the excited state of these compounds have clarified the photoluminescence blue-shift and suggested a typical cluster C–C bond elongation in the V-shaped dyads. Calculations on the elongated linear dyads have suggested that the electron density is localized at the phenyleneethynylene-containing bridge.
Introduction
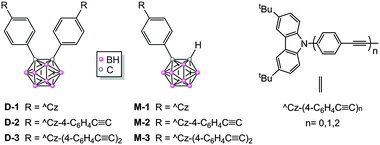
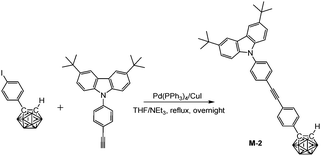
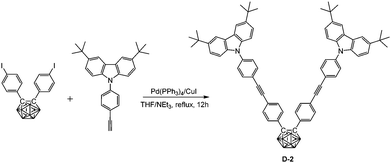
The last two decades have witnessed wide-ranging applications of electron donor–acceptor (D–A) dyads in the fields of photovoltaics,1 electronics, and light-emitting diodes.2 The pursuit of improved dyads has resulted in the study of a large number of donors, but the range of acceptors investigated is still limited.3 One promising candidate as an acceptor, o-carborane (o-Cb, C2B10H12) has attracted considerable attention recently,4 not only because of its strong electron deficiency,4b,j,5 but also because of its three-dimensional pseudo-aromaticity, high thermal stability, and bio-compatibility, which give this novel acceptor several advantages as a key module in the design of new materials.2g,6Many o-Cb dyads have been reported, and their photo-luminescence (PL) properties have been studied extensively (the majority are in fact o-Cb triads with two identical donors).7o-Cb dyads usually exhibit emission that is predominantly charge-transfer (CT) in nature, with large Stokes shifts, intensities that are solvent-dependent, relatively low efficiencies, and quenching in polar solvents. In contrast to their solution behaviour, o-Cb dyads experience a significant enhancement in intensity on proceeding to the solid state, due to aggregation-induced emission (AIE)8 and, in one case, crystal-induced emission (CIE).9 In the neat film state, recently reported o-Cb triad assemblies with electron donor and acceptor groups have also exhibited excellent thermally activated delayed fluorescence (TADF) in addition to AIE, with quantum efficiencies up to 97%.10 Nevertheless, with minimal exceptions,11 studies of o-Cb dyads have focused on compounds with small π-systems, as the scope of the linkages within the o-Cb dyads has thus far been confined to a phenylene unit; in particular, efforts to adjust or improve the PL are limited to substituent variation. In view of the enormous importance of the π-bridge in electron transfer,12 we reasoned that oligo(phenylene-ethynylene) units may prove beneficial bridges connecting di-tert-butylcarbazole donor(s) (^Cz, D) and o-carborane acceptor (o-Cb, A) and herein report six o-Cb dyads (D-1/D-2/D-3, M-1/M-2/M-3, Scheme 1), together with the unusual trend in their PL properties that is seen on π-bridge extension.
Results and discussion
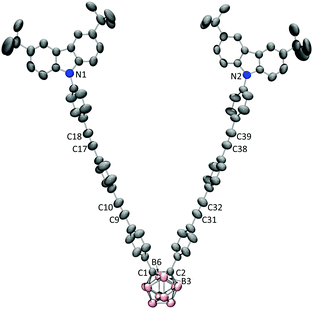
V-shaped dyads D-1/D-2/D-3 and linear dyads M-1/M-2/M-3 were synthesized as described in the experimental section and characterized by the usual spectroscopies and a single-crystal X-ray diffraction study of D-3 (Fig. 1). Fig. 2 shows the linear optical absorption spectra of these o-Cb dyads. The same variation in spectra on π-bridge elongation is observed for the V-shaped (D) and linear (M) sets of dyads. Excluding the constant absorption at ca. 295 nm, the o-Cb dyads display similar red-shifts in bands corresponding to the same type of electronic excitation. For example, the absorption corresponding to one π^CzB–π^CzB* transition (B = bridge) appears at 331 nm for D-1,13 347 nm for D-2, and 348 nm for D-3, while the absorption for a further π^CzB–πCbB* transition appears at 342 nm for D-1, 368 nm for D-2, and is further red-shifted for D-3.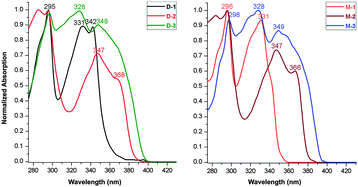 | ||
| Fig. 2 Normalized absorption of D-1/D-2/D-3 (left) and M-1/M-2/M-3 (right) dyads in cyclohexane solvent. | ||
The PL spectra of the V-shaped dyads were assessed following excitation at 350 nm (Fig. 3a–c). A blue-shift in the PL maximum is seen upon π-bridge elongation, in contrast to the red-shift seen with the absorption bands following the same bridge lengthening. In cyclohexane, the maximum emission peaks appear at 570 nm for D-1, 521 nm for D-2, and 496 nm for D-3, a blue-shift of 74 nm following incorporation of a di(phenyleneethynylene) linkage. A similar variation was observed in carbon tetrachloride and toluene, with the emission shifting from 591 nm to 514 nm and from 632 nm to 563 nm under the same π-system lengthening, corresponding to a blue shift of 77 nm and 69 nm, respectively. This constant blue shift is not seen either in more polar solvents (because this CT emission is quenched, leaving only local excited (LE) emissions (Fig. 3d)) or in the solid state (because only a weak to moderate orange emission is seen, due to an aggregation-caused quenching (ACQ) effect). Among these V-shaped dyads, D-2 is the most highly emissive, with quantum efficiencies (QE, Φ) 16–35% in the less polar solvents (Table S1 in ESI†).
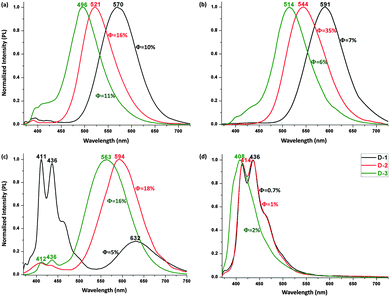 | ||
| Fig. 3 Normalized PL spectra of D-1, D-2 and D-3 (2 μM) in c-C6H12 (a), CCl4 (b), toluene (c) and CHCl3 (d), with excitation at 350 nm. | ||
The polyhedral skeletal electron pair theory (PSEPT) electron counting rules (Wade–Mingos rules) dictate that the o-Cb clusters are held together by 26 (2n + 2, n = 12) skeletal electrons.14 Ordinarily, one would expect that the HOMO would rise while the LUMO would fall in energy following π-bridge extension in such dyads, which together result in red shifts in the absorption bands. However, previous studies of the V-shaped o-Cb dyad D-1 revealed the presence of a key excited state containing Cz˙+ and Cb˙− and a typical carboranyl C–C bond cleavage,13 and thus the origin of PL is actually the charge-separated Cz˙+–π–Cb˙−. The electron-counting of the o-Cb cluster is therefore 2n + 3 in this case, and the electronic properties of both Cz and Cb are inverted relative to their initial properties. The energetic trend in HOMO (located at ^Cz) and LUMO (located at o-Cb) is therefore reversed following π-extension, the HOMO falling and the LUMO rising in energy, resulting in the observed blue-shift in PL. We anticipate that the PL behaviour of other o-Cb dyads can be tuned in a similar fashion, as is corroborated by two oligo(phenylene) linked examples.13
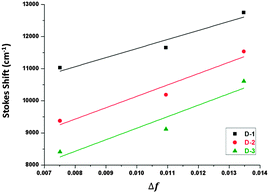
Fig. 4 shows Mataga–Lippert plots for the solvatochromic shifts of the CT emission of the V-shaped dyads and the estimation of the dipole moment was empirically following the Mataga–Lippert equation, expressed as follows:
To verify the general nature of this unusual blue-shift, we examined the linear dyads, M-1/M-2/M-3, which possess more complicated PL due to dual emission.13bFig. 5a shows the emission spectra in which the LE band (<450 nm) and the CT band (>450 nm) are broad and possess large Stokes shifts. The LE band shows a slight red-shift of 9 nm in proceeding from M-1 to M-2 whereas the CT band shows a blue-shift of 42 nm. This variation continues on proceeding to M-3, affording a band with both LE and CT character (Fig. S2.2(f) in ESI†). The relative intensities of the LE and CT emissions vary upon π-bridge elongation (LE![[thin space (1/6-em)]](https://www.rsc.org/images/entities/char_2009.gif) :
:![[thin space (1/6-em)]](https://www.rsc.org/images/entities/char_2009.gif) CT intensity ratios 1
CT intensity ratios 1![[thin space (1/6-em)]](https://www.rsc.org/images/entities/char_2009.gif) :
:![[thin space (1/6-em)]](https://www.rsc.org/images/entities/char_2009.gif) 10 (M-1), 1
10 (M-1), 1![[thin space (1/6-em)]](https://www.rsc.org/images/entities/char_2009.gif) :
:![[thin space (1/6-em)]](https://www.rsc.org/images/entities/char_2009.gif) 1.5 (M-2), 1
1.5 (M-2), 1![[thin space (1/6-em)]](https://www.rsc.org/images/entities/char_2009.gif) :
:![[thin space (1/6-em)]](https://www.rsc.org/images/entities/char_2009.gif) ≈0 (M-3)). More importantly, the harvested QE increases significantly on π-extension; for example, the QE of M-3 is 86% in c-C6H12 and 85% in toluene, the highest values for emissive o-Cb derivatives in the solution state,7f,15 while the QEs for M-2 and M-1 are much lower. The linear dyads exhibit emission quenching in the more polar solvents, M-3 harvesting only 2% QE in THF (Table S1 in ESI†). Study of the PL in the solid state showed that M-3 possesses a weak blue emission while the other linear compounds show weak multiplex emission.
≈0 (M-3)). More importantly, the harvested QE increases significantly on π-extension; for example, the QE of M-3 is 86% in c-C6H12 and 85% in toluene, the highest values for emissive o-Cb derivatives in the solution state,7f,15 while the QEs for M-2 and M-1 are much lower. The linear dyads exhibit emission quenching in the more polar solvents, M-3 harvesting only 2% QE in THF (Table S1 in ESI†). Study of the PL in the solid state showed that M-3 possesses a weak blue emission while the other linear compounds show weak multiplex emission.
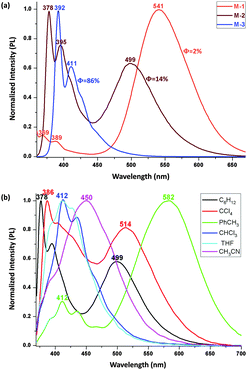 | ||
| Fig. 5 (a) Normalized PL of M-1 (20 μM), M-2 and M-3 (2 μM) in C6H12; (b) normalized PL of M-2 (2 μM) in different solvents, both were excited at 350 nm. | ||
Within an individual linear dyad, there is a clear-cut progression from LE to CT emission, as can be seen in the PL spectra of M-2 in Fig. 5b. The higher energy peak corresponds to LE emission (LE′) and the lower energy peak to CT, so the energy difference between the LE′ and CT maxima is ca. 0.797 eV in c-C6H12, ca. 0.802 eV in CCl4, ca. 0.880 eV in toluene, and even larger in more polar solvents as the CT state decreases in energy faster than the LE′ state (Table 1). Once a threshold for quenching is met, the larger stabilization results in a change in character of the emission from LE to CT and dramatic quenching, not only in CT but also in LE, until no QE is harvested for all o-Cb dyads. In other words, although the linear dyads exhibit both LE and CT emission, the progression from LE to CT emission (that may be accompanied by C–C bond cleavage) will inevitably lead to an overall loss in PL intensity. The π-bridge elongation on proceeding to M-3 reduces this comparative stabilization of CT vs. LE. These results also suggest that by changing the electron donor, one should be able to influence the relative LE and CT emissions, and thereby tune the PL in a relatively simple fashion.
| Energy (eV) | c-C6H12 | CCl4 | PhCH3 | CHCl3 |
|---|---|---|---|---|
| LE′ | 3.287 | 3.219 | 3.015 | 3.015 |
| CT | 2.490 | 2.417 | 2.135 | — |
| ΔE (eV) | 0.797 | 0.802 | 0.880 | — |
To better understand the unusual properties of these π-bridge-elongated o-Cb dyads, time-dependent density-functional theory (TD-DFT) calculations were performed at the (u)M06-2X16/6-31G(d,p) level. The calculated electronic transitions for all the o-Cb dyads in their ground states are in good agreement with the red-shift in their homogeneous absorption bands (Table S3, ESI†). Moreover, the experimentally-observed blue shift in PL is also verified in the emission modelling of the V-shaped o-Cb dyads. Fig. 6 shows the calculated electronic transitions of D-1 and D-2 at the first singlet excited state (S1). The optimized geometries of the S1 state contain characteristic carboranyl C⋯C distances of 2.291 Å for D-1 and 2.245 Å for D-2, in accordance with reported values.17 Such elongated C–C bonds are characteristic of o-Cb anions with 2n + 3 skeletal electrons.17b The calculated wavelengths, 444.83 nm for D-1 and 425.11 nm for D-2, along with the oscillator strengths (f) 0.2117 and 0.9057, respectively, are in agreement with the observed blue-shift if one neglects the underestimation due to the high content of Hartree–Fock exchange (54%) within the M06-2X functional.16 The HOMO–LUMO gap does not change significantly; the blue shift in proceeding from D-1 to D-2 can therefore be attributed to greater participation of transitions from the LUMO to orbitals lower than the HOMO (for example, the 26.3% contribution from LUMO to HOMO−4).
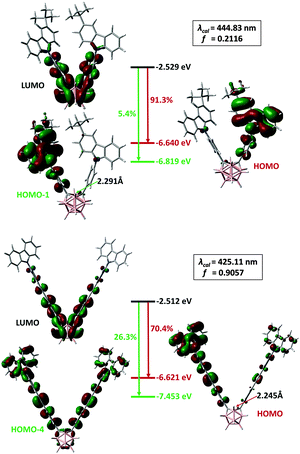 | ||
| Fig. 6 Emission simulations of D-1 (top) and D-2 (bottom). The carboranyl C⋯C distance is listed in Å and the assignment of the electronic transitions is shown as a percentage. | ||
The emission modelling of M-3 at the S1 state revealed a strong bias towards LE emission (Fig. S3.12 in the ESI†), supported in two ways. Firstly, the S1 geometry is similar to that of the ground state S0 with only a slightly longer carboranyl C–C bond (difference ca. 0.027 Å: the comparable value in D-2 is 0.562 Å). Secondly, the LUMO at the S1 state is mostly located on the π-bridge (Fig. 7c) with only a ca. 2.9% contribution from o-Cb, and therefore comparable to that of the S0 state. To evaluate the possible CT emission in M-3, modelling on the one-electron-imposed state (an imaginary anion to mimic the LUMO at the S1 state: Fig. 7b) was undertaken; this revealed a similar distribution in the highest singly occupied molecular orbital (HSOMO at the DFT level), for which the contribution from o-Cb is only 4.1%, consistent with resemblance between the S1 states for LE and CT emission. Such a hybrid excited state agrees with the observed LE-predominant emission, the CT character in more polar solvents, and the LE to CT transformation.
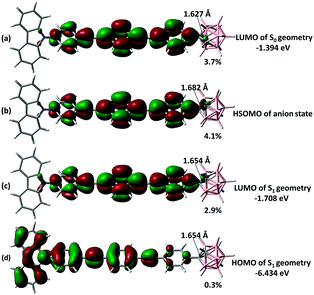 | ||
| Fig. 7 Selected frontier orbitals of M-3 for different states. The carboranyl C–C bond length is listed in Å and the o-Cb contribution to each orbital is shown as a percentage. | ||
By consulting both the LUMO of D-3 (Fig. S3.9 in the ESI†) and M-3 at the S1 state structure, the cluster contribution which is in response to the electron withdrawing effect of o-Cb is overwhelming in the V-shaped D-3 (58.8%) while it is actually inclined to the absence in the linear M-3. Therefore the photophysical properties of o-Cb dyads, especially those at their excited state, are strongly determined by the π-extending bridge, as well as the fashion of substitution.
Conclusions
In summary, π-bridge elongation has been shown to be a highly effective way to tune the photoluminescence of both V-shaped and linear o-Cb dyads and, in particular, a facile route to an extraordinary blue-shift in PL. The π-bridge elongation in the linear dyads also leads to a unique hybrid excited state, LE and CT emission, and very high PL efficiency. These outcomes can be attributed to the unique electronic structure of o-Cb in the corresponding excited states, as supported by the TD-DFT calculations. Our findings suggest that o-Cb dyads can be engineered to possess very large excited-state dipole moments, as in the V-shaped assemblies, and that emissive o-Cb dyads can be designed with specific PL properties, as in the linear constructions.Experimental section
The preparative work was carried out under a nitrogen atmosphere using standard Schlenk techniques. Solvents were freshly distilled under nitrogen from either sodium or calcium hydride prior to use. Reactants 3,6-di-tert-butyl-9H-carbazole, 3,6-di-tert-butyl-9-(4-ethynylphenyl)-9H-carbazole, 3,6-di-tert-butyl-9-(4-((4-ethynyl phenyl)ethynyl)phenyl)-9H-carbazole, (4-iodophenyl)-o-carborane and bis(4-iodophenyl)-o-carborane were prepared according to literature methods.18 Other chemicals were used as commercial products without further purification. Tetrakis(triphenylphosphine)palladium(0) (J&K) was 99.8% grade. The NMR data were obtained on a Bruker DRX 400 spectrometer; chemical shifts are given with respect to CHCl3/CDCl3 (δ1H = 7.24 ppm, δ13C = 77.00 ppm) and external BF3·Et2O (δ11B = 0 ppm). Mass spectral data were recorded on a Bruker Daltonics ultrafleXtreme MALDI-TOF/TOF, Micromass/Waters LCT-ZMD single quadrupole liquid chromatograph-MS or a VG Quattro II triple quadrupole MS. Elemental analyses were performed on Elementar vario MICRO cube (Germany). The absorption and photoluminescence spectra were recorded on a UV-Vis-NIR spectrophotometer (Shimadzu UV-3600 plus) and a fluorescence spectrophotometer (Hitachi F-4600) equipped with high performance R928 photomultiplier detector.Synthesis of M-1, M-2, M-3, D-1, D-2 and D-3
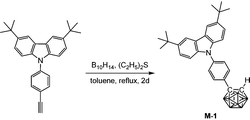
The synthesis of M-1 followed the conventional method for the preparation of o-carborane derivatives using B10H14 as the precursor.19 Heating 3,6-di-tert-butyl-9-(4-ethynylphenyl)-9H-carbazole (380 mg, 1.0 mmol), B10H14 (147 mg, 1.2 mmol) and diethyl sulfide (220 mg, 2.4 mmol) in refluxing anhydrous toluene for 2 days afforded M-1 (273 mg, 55%) as a white powder after work-up. 1H NMR (400 MHz, CDCl3): δ (ppm) 8.12 (2H, s, Ar–H), 7.67 (2H, d, 8.5 Hz, Ar–H), 7.54 (2H, d, 8.5 Hz, Ar–H), 7.45 (2H, d, 8.5 Hz, Ar–H), 7.34 (2H, d, 8.5 Hz, Ar–H), 4.02 (1H, s, Ccarb–H), 3.6–1.6 (10H, br, B–H), 1.45 (18H, s, CH3); 13C NMR (101 MHz, CDCl3): δ (ppm) 143.59, 140.03, 138.55, 131.34, 129.22, 126.32, 123.80, 123.75, 116.41, 109.06 (18C, Ar–C), 76.04 (Ccarb), 60.48 (Ccarb), 34.75 (2C, CMe3), 31.95 (6C, CH3); 11B NMR (128 MHz, CDCl3): δ (ppm) −1.16 (1B), −2.33 (1B), −8.20 (2B), −9.43 (2B), −9.91 (2B), −11.27 (2B); MS (MALDI-TOF): m/z calcd for C28H39B10N 498.405 (100%), found for C28H39B10N 498.414 (100%). Anal. calcd for C28H39B10N: C, 67.57; H, 7.90; N, 2.81. Found: C, 67.83; H, 8.13; N, 2.52.
The synthesis of D-1 proceeded via Buchwald–Hartwig coupling20 of bis(4-iodophenyl)-o-carborane (548 mg, 1.0 mmol) and 3,6-di-tert-butyl-9H-carbazole (560 mg, 2.0 mmol), and using Pd2(dba)3 (19 mg, 0.02 mmol), tBu3P (260 μL, 10% in pentane, 0.08 mmol) and KOtBu (225 mg, 2.0 mmol) as catalysts or additives. The reaction mixture was heated in refluxing toluene for 12 h under a N2 atmosphere. The crude product was purified by flash chromatography on silica gel using hexane as eluent, affording D-1 (451 mg, 53%) as a white powder. 1H NMR (400 MHz, CDCl3): δ (ppm) 8.07 (4H, s, Ar–H), 7.65 (4H, d, 8.5 Hz, Ar–H), 7.42 (4H, d, 8.5 Hz, Ar–H), 7.23 (4H, d, 8.5 Hz, Ar–H), 7.18 (4H, d, 8.5 Hz, Ar–H), 3.92–1.97 (10H, br, B–H), 1.39 (36H, s, CH3); 13C NMR (101 MHz, CDCl3): δ (ppm) 143.52, 140.28, 138.36, 132.16, 128.49, 125.67, 123.78, 123.76, 116.36, 108.87 (36C, Ar–C), 84.73 (2C, Ccarb), 34.67 (4C, CMe3), 31.91 (12C, CH3); 11B NMR (128 MHz, CDCl3): δ (ppm) −2.13 (4B, br), −10.20 (6B, br); MS (MALDI-TOF): m/z calcd for C54H66B10N2 851.620, found for C54H66B10N2 851.620. Anal. calcd for C54H66B10N2: C, 76.19; H, 7.81; N, 3.29. Found: C, 75.93; H, 7.74; N, 3.16.
In a 100 mL Schlenk tube, a mixed solvent of THF/NEt3 (20 mL/10 mL) was degassed by freeze–pump–thaw cycles and then frozen again using liquid nitrogen. After purging with a N2 stream, (4-iodophenyl)-o-carborane (347 mg, 1.0 mmol), 3,6-di-tert-butyl-9-(4-ethynyl-phenyl)-9H-carbazole (380 mg, 1.0 mmol), Pd(PPh3)4 (35 mg, 0.03 mmol), and CuI (10 mg, 0.05 mmol) were added and the N2 atmosphere was evacuated-backfilled twice. The reaction mixture was slowly warmed to room temperature and then refluxed overnight. After cooling and evaporation of the solvent, the crude product was purified by flash chromatography on silica gel using hexane/CH2Cl2 (v![[thin space (1/6-em)]](https://www.rsc.org/images/entities/char_2009.gif) :
:![[thin space (1/6-em)]](https://www.rsc.org/images/entities/char_2009.gif) v 10
v 10![[thin space (1/6-em)]](https://www.rsc.org/images/entities/char_2009.gif) :
:![[thin space (1/6-em)]](https://www.rsc.org/images/entities/char_2009.gif) 1) as eluent. Recrystallization from a hot mixed solvent of hexane/CH2Cl2 (v/v, 3
1) as eluent. Recrystallization from a hot mixed solvent of hexane/CH2Cl2 (v/v, 3![[thin space (1/6-em)]](https://www.rsc.org/images/entities/char_2009.gif) :
:![[thin space (1/6-em)]](https://www.rsc.org/images/entities/char_2009.gif) 1) gave M-2 (482 mg, 81%). 1H NMR (400 MHz, CDCl3): δ (ppm) 8.14 (2H, s, Ar–H), 7.72 (2H, d, 8.5 Hz, Ar–H), 7.56 (2H, d, 8.5 Hz, Ar–H), 7.48 (6H, m, Ar–H), 7.38 (2H, d, 8.5 Hz, Ar–H), 3.93 (1H, s, Ccarb–H), 3.4–1.6 (10H, br, B–H), 1.46 (18H, s, CH3); 13C NMR (101 MHz, CDCl3): δ (ppm) 143.32, 138.76, 138.60, 133.18, 133.14, 131.83, 127.61, 126.36, 125.13, 123.75, 123.62, 120.82, 116.33, 109.15 (24C, Ar–C), 91.35, 88.40 (2C, C
1) gave M-2 (482 mg, 81%). 1H NMR (400 MHz, CDCl3): δ (ppm) 8.14 (2H, s, Ar–H), 7.72 (2H, d, 8.5 Hz, Ar–H), 7.56 (2H, d, 8.5 Hz, Ar–H), 7.48 (6H, m, Ar–H), 7.38 (2H, d, 8.5 Hz, Ar–H), 3.93 (1H, s, Ccarb–H), 3.4–1.6 (10H, br, B–H), 1.46 (18H, s, CH3); 13C NMR (101 MHz, CDCl3): δ (ppm) 143.32, 138.76, 138.60, 133.18, 133.14, 131.83, 127.61, 126.36, 125.13, 123.75, 123.62, 120.82, 116.33, 109.15 (24C, Ar–C), 91.35, 88.40 (2C, C![[triple bond, length as m-dash]](https://www.rsc.org/images/entities/char_e002.gif) C), 75.96 (Ccarb), 60.08 (Ccarb), 34.75 (2C, CMe3), 31.98 (6C, CH3); 11B NMR (128 MHz, CDCl3): δ (ppm) −1.30 (1B), −2.49 (1B), −8.19 (2B), −9.41 (2B), −10.09 (2B), −11.38 (2B); MS (MALDI-TOF): m/z calcd for C36H43B10N 598.436, found for C36H43B10N 598.439; HRMS (EI): m/z calcd for C36H43B10N 598.4248 (100%), found for C36H43B10N 598.4252 (100%). Anal. calcd for C36H43B10N: C, 72.32; H, 7.25; N, 2.34. Found: C, 71.96; H, 7.20; N, 2.28.
C), 75.96 (Ccarb), 60.08 (Ccarb), 34.75 (2C, CMe3), 31.98 (6C, CH3); 11B NMR (128 MHz, CDCl3): δ (ppm) −1.30 (1B), −2.49 (1B), −8.19 (2B), −9.41 (2B), −10.09 (2B), −11.38 (2B); MS (MALDI-TOF): m/z calcd for C36H43B10N 598.436, found for C36H43B10N 598.439; HRMS (EI): m/z calcd for C36H43B10N 598.4248 (100%), found for C36H43B10N 598.4252 (100%). Anal. calcd for C36H43B10N: C, 72.32; H, 7.25; N, 2.34. Found: C, 71.96; H, 7.20; N, 2.28.
In a 100 mL Schlenk tube, a mixed solvent of THF/NEt3 (15 mL/10 mL) was degassed by freeze–pump–thaw cycles and then frozen again using liquid nitrogen. After purging with a N2 stream, bis(4-iodophenyl)-o-carborane (548 mg, 1.0 mmol), 3,6-di-tert-butyl-9-(4-ethynylphenyl)-9H-carbazole (759 mg, 2.0 mmol), Pd(PPh3)4 (69 mg, 0.06 mmol), and CuI (12 mg, 0.06 mmol) were added and the N2 atmosphere was evacuated-backfilled twice. The reaction mixture was gradually warmed to room temperature and afterwards refluxed for 12 h. After cooling and evaporation of the solvent, the crude product was purified by flash chromatography on silica gel using hexane/CH2Cl2 (v![[thin space (1/6-em)]](https://www.rsc.org/images/entities/char_2009.gif) :
:![[thin space (1/6-em)]](https://www.rsc.org/images/entities/char_2009.gif) v 10
v 10![[thin space (1/6-em)]](https://www.rsc.org/images/entities/char_2009.gif) :
:![[thin space (1/6-em)]](https://www.rsc.org/images/entities/char_2009.gif) 1) as eluent. Recrystallization from a hot mixed solvent of hexane/CH2Cl2 (v/v, 3
1) as eluent. Recrystallization from a hot mixed solvent of hexane/CH2Cl2 (v/v, 3![[thin space (1/6-em)]](https://www.rsc.org/images/entities/char_2009.gif) :
:![[thin space (1/6-em)]](https://www.rsc.org/images/entities/char_2009.gif) 1) gave D-2 (988 mg, 94%). 1H NMR (400 MHz, CDCl3): δ (ppm) 8.13 (4H, s, Ar–H), 7.68 (4H, d, 8.5 Hz, Ar–H), 7.55 (4H, d, 8.5 Hz, Ar–H), 7.45 (8H, m, Ar–H), 7.36 (8H, m, Ar–H), 3.8–2.0 (10H, br, B–H), 1.45 (36H, s, CH3); 13C NMR (101 MHz, CDCl3): δ (ppm) 143.30, 138.75, 138.61, 133.09, 131.46, 130.61, 130.34, 126.34, 125.45, 123.73, 123.62, 120.77, 116.31, 109.14 (48C, Ar–C), 91.60, 88.54 (4C, C
1) gave D-2 (988 mg, 94%). 1H NMR (400 MHz, CDCl3): δ (ppm) 8.13 (4H, s, Ar–H), 7.68 (4H, d, 8.5 Hz, Ar–H), 7.55 (4H, d, 8.5 Hz, Ar–H), 7.45 (8H, m, Ar–H), 7.36 (8H, m, Ar–H), 3.8–2.0 (10H, br, B–H), 1.45 (36H, s, CH3); 13C NMR (101 MHz, CDCl3): δ (ppm) 143.30, 138.75, 138.61, 133.09, 131.46, 130.61, 130.34, 126.34, 125.45, 123.73, 123.62, 120.77, 116.31, 109.14 (48C, Ar–C), 91.60, 88.54 (4C, C![[triple bond, length as m-dash]](https://www.rsc.org/images/entities/char_e002.gif) C), 84.83 (2C, Ccarb), 34.73 (4C, CMe3), 31.96 (12C, CH3); 11B NMR (128 MHz, CDCl3): δ (ppm) −1.99 (4B, br), −9.97 (6B, br); MS (MALDI-TOF): m/z calcd for C70H74B10N2 1051.682, found for C70H74B10N2 1051.676; HRMS (TOF-MS ES): m/z calcd for C70H74B10N2 1051.6783, found for C70H74B10N2 1051.6782. Anal. calcd for C70H74B10N2: C, 79.96; H, 7.09; N, 2.66. Found: C, 79.70; H, 7.37; N, 2.34.
C), 84.83 (2C, Ccarb), 34.73 (4C, CMe3), 31.96 (12C, CH3); 11B NMR (128 MHz, CDCl3): δ (ppm) −1.99 (4B, br), −9.97 (6B, br); MS (MALDI-TOF): m/z calcd for C70H74B10N2 1051.682, found for C70H74B10N2 1051.676; HRMS (TOF-MS ES): m/z calcd for C70H74B10N2 1051.6783, found for C70H74B10N2 1051.6782. Anal. calcd for C70H74B10N2: C, 79.96; H, 7.09; N, 2.66. Found: C, 79.70; H, 7.37; N, 2.34.
The synthesis of M-3 followed that of M-2, but employed (4-iodophenyl)-o-carborane (347 mg, 1.0 mmol), 3,6-di-tert-butyl-9-(4-((4-ethynylphenyl)ethynyl)phenyl)-9H-carbazole (480 mg, 1.0 mmol), Pd(PPh3)4 (35 mg, 0.03 mmol), and CuI (10 mg, 0.05 mmol). M-3 was obtained by recrystallization from a hot hexane/CH2Cl2 (v/v, 3![[thin space (1/6-em)]](https://www.rsc.org/images/entities/char_2009.gif) :
:![[thin space (1/6-em)]](https://www.rsc.org/images/entities/char_2009.gif) 1) solution (574 mg, 82%). 1H NMR (400 MHz, CDCl3): δ (ppm) 8.14 (2H, s, Ar–H), 7.73 (2H, d, 8.5 Hz, Ar–H), 7.56 (2H, d, 8.5 Hz, Ar–H), 7.55–7.35 (12H, m, Ar–H), 3.91 (1H, s, Ccarb–H), 1.46 (18H, s, CH3); 13C NMR (101 MHz, CDCl3): δ (ppm) 143.27, 138.80, 138.39, 133.25, 133.06, 131.82, 131.69, 131.63, 127.60, 126.37, 125.03, 123.74, 123.60, 123.53, 122.49, 121.20, 116.32, 109.18 (30C, Ph), 91.57, 91.06, 89.65, 89.60 (4C, C
1) solution (574 mg, 82%). 1H NMR (400 MHz, CDCl3): δ (ppm) 8.14 (2H, s, Ar–H), 7.73 (2H, d, 8.5 Hz, Ar–H), 7.56 (2H, d, 8.5 Hz, Ar–H), 7.55–7.35 (12H, m, Ar–H), 3.91 (1H, s, Ccarb–H), 1.46 (18H, s, CH3); 13C NMR (101 MHz, CDCl3): δ (ppm) 143.27, 138.80, 138.39, 133.25, 133.06, 131.82, 131.69, 131.63, 127.60, 126.37, 125.03, 123.74, 123.60, 123.53, 122.49, 121.20, 116.32, 109.18 (30C, Ph), 91.57, 91.06, 89.65, 89.60 (4C, C![[triple bond, length as m-dash]](https://www.rsc.org/images/entities/char_e002.gif) C), 75.92 (Ccarb), 60.06 (Ccarb), 34.74 (2C, CMe3), 31.98 (6C, CH3); 11B NMR (128 MHz, CDCl3): δ (ppm) −1.26 (1B), −2.44 (1B), −8.17 (2B), −9.39 (2B), −10.07 (2B), −11.36 (2B); MS (MALDI-TOF): m/z calcd for C44H47B10N 698.468 (100%), found for C44H47B10N 698.465 (100%); HRMS (EI): m/z calcd for C44H47B10N 698.4561, found for C44H47B10N 698.4539. Anal. calcd for C44H47B10N: C, 75.71; H, 6.79; N, 2.01. Found: C, 75.45; H, 6.44; N, 1.85.
C), 75.92 (Ccarb), 60.06 (Ccarb), 34.74 (2C, CMe3), 31.98 (6C, CH3); 11B NMR (128 MHz, CDCl3): δ (ppm) −1.26 (1B), −2.44 (1B), −8.17 (2B), −9.39 (2B), −10.07 (2B), −11.36 (2B); MS (MALDI-TOF): m/z calcd for C44H47B10N 698.468 (100%), found for C44H47B10N 698.465 (100%); HRMS (EI): m/z calcd for C44H47B10N 698.4561, found for C44H47B10N 698.4539. Anal. calcd for C44H47B10N: C, 75.71; H, 6.79; N, 2.01. Found: C, 75.45; H, 6.44; N, 1.85.
The synthesis of D-3 followed that of D-2, but employed bis(4-iodophenyl)-o-carborane (548 mg, 1.0 mmol), 3,6-di-tert-butyl-9-(4-((4-ethynylphenyl)ethynyl)phenyl)-9H-carbazole (959 mg, 2.0 mmol), Pd(PPh3)4 (69 mg, 0.06 mmol), and CuI (12 mg, 0.06 mmol). D-3 was obtained by recrystallization from a hot hexane/CH2Cl2 (v/v, 3![[thin space (1/6-em)]](https://www.rsc.org/images/entities/char_2009.gif) :
:![[thin space (1/6-em)]](https://www.rsc.org/images/entities/char_2009.gif) 1) solution (995 mg, 80%). 1H NMR (400 MHz, CDCl3): δ (ppm) 8.13 (4H, s, Ar–H), 7.72 (4H, d, 8.5 Hz, Ar–H), 7.56 (4H, d, 8.5 Hz, Ar–H), 7.54–7.30 (24H, m, Ar–H), 3.90–1.90 (10H, br, B–H), 1.46 (36H, s, CH3); 13C NMR (101 MHz, CDCl3): δ (ppm) 143.28, 138.84, 138.43, 133.05, 131.64, 131.62, 131.44, 130.59, 130.41, 126.39, 125.36, 123.73, 123.63, 123.54, 122.46, 121.22, 116.31, 109.18 (60C, Ar–C), 91.82, 91.06, 89.74, 89.64 (8C, C
1) solution (995 mg, 80%). 1H NMR (400 MHz, CDCl3): δ (ppm) 8.13 (4H, s, Ar–H), 7.72 (4H, d, 8.5 Hz, Ar–H), 7.56 (4H, d, 8.5 Hz, Ar–H), 7.54–7.30 (24H, m, Ar–H), 3.90–1.90 (10H, br, B–H), 1.46 (36H, s, CH3); 13C NMR (101 MHz, CDCl3): δ (ppm) 143.28, 138.84, 138.43, 133.05, 131.64, 131.62, 131.44, 130.59, 130.41, 126.39, 125.36, 123.73, 123.63, 123.54, 122.46, 121.22, 116.31, 109.18 (60C, Ar–C), 91.82, 91.06, 89.74, 89.64 (8C, C![[triple bond, length as m-dash]](https://www.rsc.org/images/entities/char_e002.gif) C), 84.81 (2C, Ccarb), 34.74 (4C, CMe3), 31.98 (12C, CH3); 11B NMR (128 MHz, CDCl3): δ (ppm) −2.59 (5B, br), −9.74 (5B, br); MS (MALDI-TOF): m/z calcd for C86H82B10N2 1251.730 (100%), found for C86H82B10N2 1251.730 (100%); HRMS (ES): m/z calcd for C86H82B10N2 1251.7330 found for C86H82B10N2 1251.7345. Anal. calcd for C86H82B10N2: C, 82.52; H, 6.60; N, 2.24. Found: C, 82.77; H, 6.54; N, 2.09.
C), 84.81 (2C, Ccarb), 34.74 (4C, CMe3), 31.98 (12C, CH3); 11B NMR (128 MHz, CDCl3): δ (ppm) −2.59 (5B, br), −9.74 (5B, br); MS (MALDI-TOF): m/z calcd for C86H82B10N2 1251.730 (100%), found for C86H82B10N2 1251.730 (100%); HRMS (ES): m/z calcd for C86H82B10N2 1251.7330 found for C86H82B10N2 1251.7345. Anal. calcd for C86H82B10N2: C, 82.52; H, 6.60; N, 2.24. Found: C, 82.77; H, 6.54; N, 2.09.
Theoretical calculations
Density functional theory (DFT) computations were carried out with the Gaussian 09 package.21 Ground state geometries were fully optimized with the M06-2X functional using the 6-31G(d,p) basis set for all atoms. The excitation energies and oscillator strengths for the lowest 5 singlet–singlet transitions from the ground state optimized geometry were obtained by time-dependent (TD)-DFT calculations also using the M06-2X functional and the 6-31G(d,p) basis set. Selected geometries of D-1, D-2, and M-3 at their first singlet excited state were optimized at the TD-DFT level using uM06-2X/6-31G(d,P), followed by frequency analysis to verify the absence of any imaginary frequency. Emission data was obtained from the excited-state calculations without considering solvent effects. The orbital composition analysis showing the contribution of the carborane cluster was performed by Mulliken partitioning using the Multiwfn program.22 To simplify the calculations, model compounds omitted the two tert-butyl groups except for D-1, which retained one tert-butyl group on each carbazole unit.Acknowledgements
We thank the Program of Introducing Talents of Discipline to Universities (111 Project B13025), the Fundamental Research Funds for the Central Universities (JUSRP11423), the Natural Science Foundation of Jiangsu Province, China (No. BK20140140), the National Natural Science Foundation of China (No. 21502072), and the Australian Research Council for support.Notes and references
- (a) Y. Lin, Y. Li and X. Zhan, Chem. Soc. Rev., 2012, 41, 4245 RSC; (b) G. Bottari, G. de la Torre, D. M. Guldi and T. Torres, Chem. Rev., 2010, 110, 6768 CrossRef CAS PubMed; (c) B. P. Rand, J. Genoe, P. Heremans and J. Poortmans, Prog. Photovoltaics, 2007, 15, 659 CrossRef CAS.
- (a) F. Laquai, Y.-S. Park, J.-J. Kim and T. Basche, Macromol. Rapid Commun., 2009, 30, 1203 CrossRef CAS PubMed; (b) D. M. Guldi, B. M. Illescas, C. Ma Atienza, M. Wielopolskia and N. Martin, Chem. Soc. Rev., 2009, 38, 1587 RSC; (c) Y. Tao, K. Yuan, T. Chen, P. Xu, H. Li, R. Chen, C. Zheng, L. Zhang and W. Huang, Adv. Mater., 2014, 26, 7931 CrossRef CAS PubMed; (d) Q. Zhang, B. Li, S. Huang, H. Nomura, H. Tanaka and C. Adachi, Nat. Photonics, 2014, 8, 326–332 CrossRef CAS; (e) H. Uoyama, K. Goushi, K. Shizu, H. Nomura and C. Adachi, Nature, 2012, 492, 234 CrossRef CAS PubMed; (f) Z. An, C. Zheng, Y. Tao, R. Chen, H. Shi, T. Chen, Z. Wang, H. Li, R. Deng, X. Liu and W. Huang, Nat. Mater., 2015, 14, 685 CrossRef CAS PubMed; (g) N. S. Hosmane, Boron Science: New technologies and Applications, CRC Press, Boca Raton, FL, 2011 Search PubMed.
- (a) S. V. Rosokha and J. K. Kochi, Acc. Chem. Res., 2008, 41, 641 CrossRef CAS PubMed; (b) M. Gonzalez, J. L. Segura, C. Seoane, N. Martin, J. Garin, J. Orduna, R. Alcala, B. Villacampa, V. Hernandez and J. T. L. Navarrete, J. Org. Chem., 2001, 66, 8872 CrossRef CAS PubMed.
- (a) M. F. Hawthorne, J. I. Zink, J. M. Skelton, M. J. Bayer, C. Liu, E. Livshits, R. Baer and D. Neuhauser, Science, 2004, 303, 1849 CrossRef CAS PubMed; (b) A. M. Spokoyny, C. W. Machan, D. J. Clingerman, M. S. Rosen, M. J. Wiester, R. D. Kennedy, C. L. Stern, A. A. Sarjeant and C. A. Mirkin, Nat. Chem., 2011, 3, 590 CrossRef CAS PubMed; (c) M. F. Hawthorne and A. Maderna, Chem. Rev., 1999, 99, 3421 CrossRef CAS PubMed; (d) A. F. Armstrong and J. F. Valliant, Dalton Trans., 2007, 4240, 10.1039/b709843j; (e) A. M. Spokoyny, T. C. Li, O. K. Farha, C. W. Machan, C. She, C. L. Stern, T. J. Marks, J. T. Hupp and C. A. Mirkin, Angew. Chem., Int. Ed., 2010, 49, 5339 CrossRef CAS PubMed; (f) I. B. Sivaev and V. V. Bregadze, Eur. J. Inorg. Chem., 2009, 1433, DOI:10.1002/ejic.200900003; (g) K. Tanaka and Y. Chujo, Macromol. Rapid Commun., 2012, 33, 1235 CrossRef CAS PubMed; (h) J. A. Christie, R. P. Forrest, S. A. Corcelli, N. A. Wasio, R. C. Quardokus, R. Brown, S. A. Kandel, Y. Lu, C. S. Lent and K. W. Henderson, Angew. Chem., Int. Ed., 2015, 54, 15448 CrossRef CAS PubMed; (i) R. N. Grimes, Carboranes, Academic Press, New York, 2nd edn, 2011 Search PubMed; (j) M. F. Hawthorne and Z. P. Zheng, Acc. Chem. Res., 1997, 30, 267 CrossRef CAS; (k) X. Li, H. Yan and Q. Zhao, Chem. – Eur. J., 2016, 22, 1888 CrossRef CAS PubMed.
- M. Scholz and E. Hey-Hawkins, Chem. Rev., 2011, 111, 7035 CrossRef CAS PubMed.
- (a) B. P. Dash, R. Satapathy, J. A. Maguire and N. S. Hosmane, New J. Chem., 2011, 35, 1955 RSC; (b) R. N. Grimes, Dalton Trans., 2015, 44, 5939 RSC.
- (a) S.-Y. Kim, Y.-J. Cho, G. F. Jin, W.-S. Han, H.-J. Son, D. W. Cho and S. O. Kang, Phys. Chem. Chem. Phys., 2015, 17, 15679 RSC; (b) K.-R. Wee, Y.-J. Cho, J. K. Song and S. O. Kang, Angew. Chem., Int. Ed., 2013, 52, 9682 CrossRef CAS PubMed; (c) S. Mukherjee and P. Thilagar, Chem. Commun., 2016, 52, 1070 RSC; (d) A. Ferrer-Ugalde, A. Gonzalez-Campo, C. Vinas, J. Rodriguez-Romero, R. Santillan, N. Farfan, R. Sillanpaa, A. Sousa-Pedrares, R. Nunez and F. Teixidor, Chem. – Eur. J., 2014, 20, 9940 CrossRef CAS PubMed; (e) A. Ferrer-Ugalde, E. Jose Juarez-Perez, F. Teixidor, C. Vinas, R. Sillanpaa, E. Perez-Inestrosa and R. Nunez, Chem. – Eur. J., 2012, 18, 544 CrossRef CAS PubMed; (f) L. Weber, J. Kahlert, R. Brockhinke, L. Boehling, J. Halama, A. Brockhinke, H.-G. Stammler, B. Neumann, C. Nervi, R. A. Harder and M. A. Fox, Dalton Trans., 2013, 42, 10982 RSC; (g) L. Weber, J. Kahlert, R. Brockhinke, L. Boehling, A. Brockhinke, H.-G. Stammler, B. Neumann, R. A. Harder and M. A. Fox, Chem. – Eur. J., 2012, 18, 8347 CrossRef CAS PubMed; (h) J. Kahlert, L. Boehling, A. Brockhinke, H.-G. Stammler, B. Neumann, L. M. Rendina, P. J. Low, L. Weber and M. A. Fox, Dalton Trans., 2015, 44, 9766 RSC . For dyads centered on small boron molecules, see: ; (i) C. D. Entwistle and T. B. Marder, Angew. Chem., Int. Ed., 2002, 41, 2927 CrossRef CAS; (j) M. Elbing and G. C. Bazan, Angew. Chem., Int. Ed., 2008, 47, 834 CrossRef CAS PubMed; (k) C.-H. Zhao, A. Wakamiya, Y. Inukai and S. Yamaguchi, J. Am. Chem. Soc., 2006, 128, 15934 CrossRef CAS PubMed; (l) K. Suzuki, S. Kubo, K. Shizu, T. Fukushima, A. Wakamiya, Y. Murata, C. Adachi and H. Kaji, Angew. Chem., Int. Ed., 2015, 54, 15231 CrossRef CAS PubMed; (m) Z. M. Hudson and S. Wang, Acc. Chem. Res., 2009, 42, 1584 CrossRef CAS PubMed; (n) F. Jaekle, Chem. Rev., 2010, 110, 3985 CrossRef PubMed; (o) A. G. Bonn and O. S. Wenger, J. Org. Chem., 2015, 80, 4097 CrossRef CAS PubMed.
- (a) K. Kokado and Y. Chujo, Dalton Trans., 2011, 40, 1919 RSC; (b) K. Kokado and Y. Chujo, J. Org. Chem., 2011, 76, 316 CrossRef CAS PubMed; (c) M. Tominaga, H. Naito, Y. Morisaki and Y. Chujo, New J. Chem., 2014, 38, 5686 RSC.
- H. Naito, Y. Morisaki and Y. Chujo, Angew. Chem., Int. Ed., 2015, 54, 5084 CrossRef CAS PubMed.
- R. Furue, T. Nishimoto, I. S. Park, J. Lee and T. Yasuda, Angew. Chem., Int. Ed., 2016 DOI:10.1002/anie.201603232.
- (a) S.-Y. Kim, A.-R. Lee, G. F. Jin, Y.-J. Cho, H.-J. Son, W.-S. Han and S. O. Kang, J. Org. Chem., 2015, 80, 4573 CrossRef CAS PubMed; (b) B. P. Dash, R. Satapathy, E. R. Gaillard, J. A. Maguire and N. S. Hosmane, J. Am. Chem. Soc., 2010, 132, 6578 CrossRef CAS PubMed.
- A. Arrigo, A. Santoro, F. Puntoriero, P. P. Laine and S. Campagna, Coord. Chem. Rev., 2015, 304, 109 CrossRef.
- (a) K.-R. Wee, W.-S. Han, D. W. Cho, S. Kwon, C. Pac and S. O. Kang, Angew. Chem., Int. Ed., 2012, 51, 2677 CrossRef CAS PubMed; (b) S. Kwon, K.-R. Wee, Y.-J. Cho and S. O. Kang, Chem. – Eur. J., 2014, 20, 5953–5960 CrossRef CAS PubMed.
- A. J. Welch, Chem. Commun., 2013, 49, 3615 RSC.
- G. F. Jin, Y.-J. Cho, K.-R. Wee, S. A. Hong, I.-H. Suh, H.-J. Son, J.-D. Lee, W.-S. Han, D. W. Cho and S. O. Kang, Dalton Trans., 2015, 44, 2780 RSC.
- Y. Zhao and D. G. Truhlar, Theor. Chem. Acc., 2008, 120, 215 CrossRef CAS.
- (a) M. A. Fox, C. Nervi, A. Crivello and P. J. Low, Chem. Commun., 2007, 2372 RSC; (b) J. Kahlert, H. G. Stammler, B. Neumann, R. A. Harder, L. Weber and M. A. Fox, Angew. Chem., Int. Ed., 2014, 53, 3702 CrossRef CAS PubMed.
- (a) Y. Liu, M. Nishiura, Y. Wang and Z. M. Hou, J. Am. Chem. Soc., 2006, 128, 5592 CrossRef CAS PubMed; (b) R. M. Adhikari and D. C. Neckers, J. Phys. Chem. A, 2009, 113, 417 CrossRef CAS PubMed; (c) M. A. Fox, J. A. K. Howard, J. A. H. MacBride, A. Mackinnon and K. Wade, J. Organomet. Chem., 2003, 680, 155 CrossRef CAS.
- (a) H. J. Bae, H. Kim, K. M. Lee, T. Kim, Y. S. Lee, Y. Do and M. H. Lee, Dalton Trans., 2014, 43, 4978 RSC; (b) Y. H. Lee, J. Park, S.-J. Jo, M. Kim, J. Lee, S. U. Lee and M. H. Lee, Chem. – Eur. J., 2015, 21, 2052 CrossRef CAS PubMed; (c) H. J. Bae, J. Chung, H. Kim, J. Park, K. M. Lee, T.-W. Koh, Y. S. Lee, S. Yoo, Y. Do and M. H. Lee, Inorg. Chem., 2014, 53, 128 CrossRef CAS PubMed.
- (a) A. S. Guram, R. A. Rennels and S. L. Buchwald, Angew. Chem., Int. Ed., 1995, 34, 1348 CrossRef CAS; (b) J. Louie and J. F. Hartwig, Tetrahedron Lett., 1995, 36, 3609 CrossRef CAS.
- M. J. Frisch, G. W. Trucks, H. B. Schlegel, G. E. Scuseria, M. A. Robb, J. R. Cheeseman, G. Scalmani, V. Barone, B. Mennucci, G. A. Petersson, H. Nakatsuji, M. Caricato, X. Li, H. P. Hratchian, A. F. Izmaylov, J. Bloino, G. Zheng, J. L. Sonnenberg, M. Hada, M. Ehara, K. Toyota, R. Fukuda, J. Hasegawa, M. Ishida, T. Nakajima, Y. Honda, O. Kitao, H. Nakai, T. Vreven, J. A. Montgomery, Jr., J. E. Peralta, F. Ogliaro, M. Bearpark, J. J. Heyd, E. Brothers, K. N. Kudin, V. N. Staroverov, T. Keith, R. Kobayashi, J. Normand, K. Raghavachari, A. Rendell, J. C. Burant, S. S. Iyengar, J. Tomasi, M. Cossi, N. Rega, J. M. Millam, M. Klene, J. E. Knox, J. B. Cross, V. Bakken, C. Adamo, J. Jaramillo, R. Gomperts, R. E. Stratmann, O. Yazyev, A. J. Austin, R. Cammi, C. Pomelli, J. W. Ochterski, R. L. Martin, K. Morokuma, V. G. Zakrzewski, G. A. Voth, P. Salvador, J. J. Dannenberg, S. Dapprich, A. D. Daniels, O. Farkas, J. B. Foresman, J. V. Ortiz, J. Cioslowski and D. J. Fox, Gaussian 09, Revision B.01, Gaussian, Inc., Wallingford CT, 2010 Search PubMed.
- (a) T. Lu and F. Chen, J. Comput. Chem., 2012, 33, 580 CrossRef CAS PubMed; (b) T. Lu and F. Chen, Acta Chim. Sin., 2011, 69, 2393 CAS.
Footnote |
| † Electronic supplementary information (ESI) available: NMR spectra, crystallographic procedures, photophysical studies, Cartesian coordinates and energies of DFT optimized structures. CCDC 1457766. For ESI and crystallographic data in CIF or other electronic format see DOI: 10.1039/c6cp02870e |
| This journal is © the Owner Societies 2016 |

