 Open Access Article
Shifting the scaling relations of single-atom catalysts for facile methane activation by tuning the coordination number†
Changhyeok
Choi
 a,
Sungho
Yoon
 b and
Yousung
Jung
 *a
*a
aDepartment of Chemical and Biomolecular Engineering, Korea Advanced Institute of Science and Technology (KAIST), Daejeon 34141, Republic of Korea. E-mail: ysjn@kaist.ac.kr
bDepartment of Chemistry, Chung-Ang University, Seoul 06974, Republic of Korea
First published on 12th January 2021
Abstract
We investigate oxidative methane activation on a wide range of single transition metal atom catalysts embedded on N-doped graphene derivatives using density functional theory calculations. An inverse scaling relationship between *O formation and its hydrogen affinity is observed, consistent with a previous report. However, we find that the latter scaling line can be shifted towards a more reactive region by tuning the coordination number (CN) of the active metal sites. Specifically, we find that lowering the CN plays an important role in increasing the reactivity for methane activation via a radical-like transition state by moving the scaling lines. Thus, in the new design strategy suggested here, different from the conventional efforts focusing mainly on breaking the scaling relations, one maintains the scaling relations but moves them towards more reactive regions by controlling the coordination number of the active sites. With this design principle, we suggest several single atom catalysts with lower C–H activation barriers than some of the most active methane activation catalysts in the literature such as Cu-based zeolites.
1. Introduction
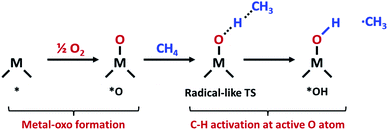
The increasing availability of natural gas and shale gas drives the demand for efficient catalysts for methane conversion.1 Methane, the most abundant component of natural gas (>70%), is an attractive feedstock due to its large reserves and various uses. In the chemical industry, methane is converted into various high value-added products such as alcohols, C2+ alkanes and olefins through multistep indirect processes involving methane steam reforming.2 However, the direct conversion of methane is still challenging due to high dissociation energy in the first C–H bonds. The non-polar and inert nature of methane thus hampers greatly the methane activation and leads to energy-intensive processes for conversion.3In nature, methane is oxidized to methanol by an enzymatic system called a methane monooxygenase (MMO) under ambient conditions. The active sites of particulate MMO (pMMO) have been suggested as di-copper clusters coordinated by N atoms.4,5 At the active site of pMMO, methane is oxidatively activated via a radical-like transition state (TS).6 In this mechanism, the C–H bond is dissociated by the surface O atom in the metal-oxo group which forms the CH3 radical (Fig. 1).
Many heterogeneous methane activation catalysts such as cation-exchange zeolites7–9 and metal–organic frameworks (MOFs)10,11 also follow a similar radical-like TS. The net reaction of methane activation can be written as *O + CH4 → *OH + ·CH3 (* = adsorption site). In this radical-like TS, the active site (*O) formation energy (Ef) and the hydrogen affinity (EH) of this active *O species have been proposed as a suitable descriptor of reactivity for methane activation.12–15 The universal linear scaling relationship between EH and the TS energy of methane activation was identified for various catalysts such as cation-exchanged zeolites, MOFs, decorated graphene nanosheets, metal oxides, and transition metal surfaces.12 Furthermore, the EH has an inverse linear scaling relationship with active site (*O) formation energy (Ef) due to the trade-off between the stability and reactivity of *O.12–14 Interestingly, two, rather than one, universal, distinct linear scaling lines between Ef and EH were observed.12 For example, catalysts lying on the higher-reactivity linear scaling line include cation-exchange zeolites and metal oxides, and those on the lower-reactivity line include MOFs, decorated graphene nanosheets, and transition metal surfaces, but the origin of such distinct scaling lines was not clearly understood. One possibility for the origin of the two scaling lines offered by the authors includes the ability of the substrate to delocalize the changes in charge during the *O formation.12 That is, substrates which poorly delocalize charges (insulating substrates) tend to follow the higher-reactivity linear scaling line, while substrates exhibiting higher conductivity follow the lower-reactivity line. However, in a more recent study that considered various types of MOF for methane activation, a full range of charge delocalization was observed but it resulted in only one scaling line, suggesting that the charge delocalization may not be responsible for the existence of two distinct scaling lines.13 The origin of different scaling lines which can serve as an important design principle to discover more efficient catalysts thus remains unexplained, and the latter understanding is the subject of this paper we intend to address here.
One key factor that differentiates these two linear scaling lines, which we focus on, is the coordination number (CN) of active sites. The CN is an important descriptor that often determines adsorption energies, and indeed linear scaling relations between CN and binding energies were identified,16 and CN-based descriptors have been suggested for predicting adsorption energies on transition metals,17–19 graphene-based single atom catalysts20 and C–H activation at the O atom in metal oxides.21,22 Specifically, our initial analysis of Latimer et al.12 for methane activation catalysts indicated that the CNs of active cations in cation-exchange zeolites or coordinatively unsaturated sites (CUS) in metal oxides located in the high-reactivity scaling line were generally lower than those of catalysts in the low-reactivity line.12 Thus, we conjectured that decreasing the CN may lead to the shifting of the linear scaling relationship towards more reactive methane activation regions.
In this study, we investigated the effect of active site CN on the scaling relationships between Ef and EH for methane activation reactions. To systematically study the effect of coordination environments, we considered single metal atoms anchored at the N-doped graphene with various coordination numbers (denoted as M@NxCy), which also mimics the active sites of pMMO. Recently, Cui et al. experimentally showed that graphene-confined single Fe sites could oxidize methane into C1 oxygenates at room temperature.23 By combinatorially combining various transition metals and anchoring sites with different N contents, we have considered 182 M@NxCy catalysts in total in the present study. We note that, in a previous study,12 94 catalysts including a wide range of structural motifs (e.g. zeolites, graphene, MOFs, metal oxides, nanoparticles and metal surfaces) were considered, but due to various structural motifs a systematic understanding of the effect of CN on the scaling relation was difficult to obtain. With M@NxCy as model systems, we herein demonstrate the concept of shifting the linear scaling lines towards more reactive regions by controlling (decreasing) the CN of active metal species. This finding agrees with previous experiments that the superior catalysts reported so far mainly consist of low CN sites. Therefore, we suggest that tuning the CN as well as Ef (or EH) plays a key role in increasing the reactivity for methane activation, and as a result, several promising catalysts such as Cu@C3, Zn@C3, Zn@N2C and Zn@N3 are identified here that can be tested experimentally.
2. Computational details
Structure relaxation and total electronic energy calculations were performed with spin-polarized density-functional theory (DFT) methods implemented in the Vienna Ab initio Simulation Package (VASP) with the projector-augmented wave pseudopotential (PAW).24–26 The Perdew–Burke–Ernzerhof (PBE)27 functional combined with Grimme's D3-dispersion correction28 with the Becke–Johnson (BJ) damping29 was employed. The cutoff energy was set to 400 eV and k-points were sampled using the (2 × 2 × 1) and (1 × 2 × 1) Monkhorst–Pack mesh30 for the basal plane and edge site of graphene, respectively. Geometry optimizations were performed until energy differences and forces on each atom are converged to 10−5 eV and −0.05 eV Å−1, respectively. The climbing-image nudged elastic band (CI-NEB)31 calculations were performed to calculate activation energy with eight intermediate images. Atomic charge analysis was performed by using the Bader partitioning scheme.32 Due to the limitations in description of triplet O2 by plane wave DFT calculations, we corrected the electronic energy of O2(g) by ensuring the experimental standard enthalpy of reaction 33
33
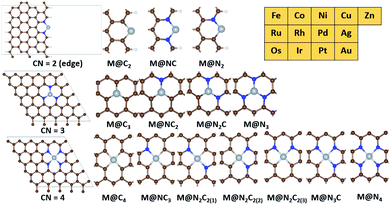
A graphene basal plane is modelled by using the (5 × 5) supercell of hexagonal graphene while a graphene edge site is modelled by using the (5 × 5) supercell of zigzag edge graphene (Fig. 2). All slab models contain at least 15 Å of vacuum in the c-axis. 15 Å of vacuum is added in the a-axis in the edge site of graphene. The calculation details for zeolites and IrO2(110) are given in the ESI (Fig. S1 and S2†).34,35
3. Results and discussion
3.1. Structures of single-atom catalysts
Based on the active sites of MMO, we construct the transition metal (M)–N coordination moiety denoted as M@Nx which is embedded on graphene (Fig. 2). M@Nx catalysts having CN = 2,36,37 3 (ref. 38–40) and 4 (ref. 41) have been experimentally identified and utilized for various catalytic reactions. To investigate more systematically the effect of CN on various SACs for methane activation, we additionally consider M@NxCy and M@Cx moieties, which incorporate the M–C coordination environments. Since the M@NxCy catalysts have a common structural motif (graphene) but different CNs, we expect that the M@NxCy moieties are suitable for investigating the isolated effects of CN. For SACs with CN = 2, we consider metal atoms anchored by two atoms in the graphene edge, while we consider the basal plane of graphene for constructing SACs with CN = 3 and CN = 4. The metal atoms are located at the vacancy site of graphene and anchored by N or C atoms, as in experiments.23,36–43 Most of the M@NxCy catalysts have been synthesized for late transition metals such as Fe,23,38,43 Co,36,41 Ni,40 Cu,39 Zn44 and Ru.45,46 Thus, we focus on 13 late transition metals for M@NxCy catalysts, and hence, a total of 182 catalysts are considered in this study as summarized in Fig. 2.3.2. Several scaling lines of reactivity by Gf and GH
The reaction mechanism of oxidative methane activation via a radical-like TS is divided into two parts (Fig. 1): active site (*O) formation and C–H bond dissociation, which are estimated by the formation energy of *O (Ef) and hydrogen affinity at *O (EH), respectively, following Nørskov and coworkers.12 The Ef and EH determine the coverage of *O atoms and ability for C–H bond dissociation at an *O atom, respectively, and hence, these two descriptors are suitable for estimating the reactivity for methane activation via the radical-like TS.12 The Ef and EH are defined as follows.A 2D-volcano plot is obtained for the rate of methane activation at 150 °C as a function of two descriptors (Gf and GH) (details are given in the ESI†). In this 2D-volcano plot, the reactivity increases with more negative Gf and GH, which facilitate *O formation and C–H bond dissociation simultaneously. However, an inverse scaling relationship between Gf and GH, which originates from the trade-off between the stability and reactivity of *O, hinders the simultaneous decrease of both Gf and GH.13 A more stabilized *O (more negative Gf) leads to the less reactive *O (more positive GH). A destabilized *O would activate methane with a lower activation energy, while it would result in a decreased population of active *O atoms. Consequently, the optimal reactivity for methane activation is observed at a balanced combination of Gf and GH.
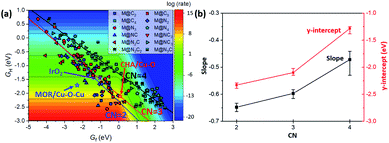
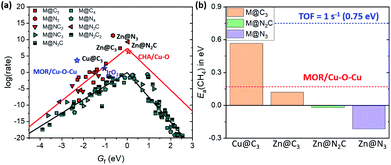
In the 2D-volcano plot of M@NxCy catalysts, we verify that an inverse scaling relationship between Gf and GH still holds for the M@NxCy model catalysts considered here (Fig. 3a). However, different linear scaling lines are observed rather than one universal line, consistent with a previous report.12 We find that the most distinctive feature in different linear scaling lines is the coordination number of the active sties of M@NxCy catalysts. Interestingly, M@NxCy catalysts with lower CNs (CN = 2 and CN = 3) are located at more reactive regions (lower left-side of the 2D volcano plot), than those with CN = 4. Notably, most of the M@NxCy catalysts near the optimal region (red zone in the volcano plot) are catalysts with CN = 2.
Since the catalytic performance for alkane activation changes with the oxidant,47 we compared the 2D-volcano plot for methane activation using O2 with that using N2O (Fig. S3†). We found that *O formation becomes more facilitated when using N2O than when using O2, and thus, Gf obtained by using N2O is more negative than Gf using O2. Consequently, the overall rate for methane activation increases with the help of facilitated *O formation and weakly oxygen binding SACs move towards the top of the volcano. However, the results are not significantly changed and the trend in the shift of the scaling relationship towards a more reactive region with decreasing CN is unchanged by the oxidant.
3.3. Origin of shifted scaling relationships
To understand the origin of different scaling lines, we first briefly comment on the effect of charge delocalization since the ability of the substrate to delocalize changes in charge following *O formation was suggested as a possible origin of different scaling lines.12 Materials that exhibit higher conductivity (graphene, metal and perovskites) tended to yield a lower-reactivity scaling line, while insulating substrates (zeolites and insulating oxides) tended to yield a higher-reactivity scaling line. However, unlike the latter speculation, we obtained different linear scaling lines for M@NxCy catalysts even though the substrates of M@NxCy catalysts considered in this study are all from the same graphene moiety. This difference is due to the fact that in the prior work only M@N4 moiety embedded graphene was considered and other M@NxCy moieties with different CNs were not studied.12 To examine the charge delocalization effect further, we calculated the fractional degree of charge delocalization (χox) following Rosen et al. (Fig. S4†).13 A wide range of χox values are obtained at each moiety; however, no relationship between χox and different scaling lines was observed. Thus, the ability for charge delocalization would not be a main origin for different scaling lines, consistent with the earlier conclusion based on MOFs.13 We note in passing that most MOFs considered in the latter previous work13 mainly consisted of open metal sites with CN = 5 or 6 and accordingly the effect of CN has not been exhibited, but with additional consideration of MOFs with low CN, higher-reactivity scaling lines might be found.The CN as well as ligand atoms affect the scaling relations, which we systematically investigate below. To quantify the change in the linear scaling line, we compare the slopes and y-intercepts of each linear scaling line. We first examine the effect of ligand atoms by comparing the slopes and y-intercepts of the scaling lines of M@NxCy catalysts with the same CN (Fig. S5†). We find that the slopes and y-intercepts differ by only ∼0.05 and ∼0.1 eV, respectively, when the ligand atoms change (–N vs. –C). However, when CN changes (Fig. S6†), slopes and y-intercepts change noticeably by ∼0.2 and ∼1 eV, respectively. The average y-intercept of the linear scaling line increases in the order of −2.31 (CN = 2) < −2.07 (CN = 3) < −1.29 (CN = 4) (Fig. 3b). This result clearly indicates that decreasing CN indeed shifts the linear scaling line towards a more reactive region for methane activation (lower left-side of the 2D volcano).
We further consider Cu-based zeolites (CHA/Cu–O and MOR/Cu–O–Cu), which have been previously reported as superior catalysts in experiments.7–9 All of the latter catalysts are indeed located near the top of the theoretical volcano-plot for methane activation12 in which the reaction proceeds via a radical-like TS. We note in passing that IrO2(110), in which the C–H activation occurs via the surface-stabilized CH3, is also one of the more active methane activation catalysts operating at relatively low temperatures,48–50 and is thus included here. However, we assume the radical-like TS for IrO2(110) for consistency following ref. 12 since IrO2(110) still lies near the top of the volcano with the radical-like TS.12 These experimentally verified catalysts have low CN (Fig. S1 and S2†). For example, CNs of Cu before *O formation are 2 and 3 in CHA/Cu–O and MOR/Cu–O–Cu, respectively. Interestingly, these catalysts do lie on the linear scaling line of low CN (CN = 2 and CN = 3), suggesting a generality of the trend that the decreased CN results in a shifted linear scaling line towards a desired region.
3.4. Effect of CN on BEP relationship
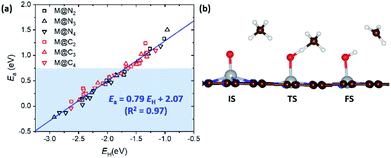
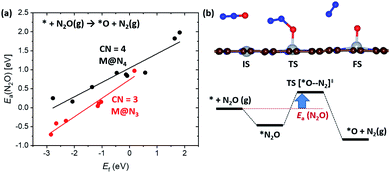
In the previous section, we demonstrated the shifted thermodynamic scaling relationships determined by CN. Here, we investigate the effect of CN on the scaling relationship in activation energy (the BEP relationship). First, we focus on the effect of CN on activation energy for C–H bond dissociation (Ea(CH4)) by comparing EH and Ea(CH4). Ea(CH4) represents the transition state (TS) energy of methane activation referenced to *O + CH4(g). A universal BEP relation is obtained between EH and Ea(CH4) as Ea(CH4) = 0.79EH + 2.07 (eV) with R2 = 0.97 (Fig. 4 and Table S1†), which is similar to that reported in the literature (Ea(CH4) = 0.75EH + 1.96 (eV)).12,13 The slope and y-intercept of linear scaling lines are almost unchanged by the CN (Fig. S7†), indicating that the effect of CN on the BEP relationship in EHvs. Ea(CH4) is minor.Next, we focus on the BEP relation in the active site formation by considering, for example, N2O as an oxidant. We compare Ef and Ea(N2O), which represents TS energy in the reaction of * + N2O → *O + N2 referenced to the * + N2O(g) (Fig. 5). In contrast to the universal BEP relation in C–H bond dissociation, the linear BEP relation line of Ea(N2O) changes with the CN. The linear BEP line shifts downwards (more negative Ea(N2O)) with decreasing CN. Thus, if the Ef is the same for two different catalysts, *O formation is kinetically more favorable for catalysts with a lower CN compared to that with a higher CN.
These results indicate that the Ea(CH4) is mainly determined by the EH (or chemical properties of *O), while the kinetics for *O formation is determined by Ef as well as CN (structural motif). Thus, the shift of the linear scaling relationship originates mainly from the effect of CN on the *O formation.
To understand the physical origin of the shifted scaling relationship with CN in *O formation, we focused on the changes of electronic structures of the metal atom. The charge, d-band center and spin of the metal atom are considered (Fig. S8 and S9†). Among them, we found a correlation between metal charge and CN. The net charge of the metal atom becomes more positive with increasing CN for almost all SACs. Thus, we conclude that the shifted net charge of the metal atom with increasing CN leads to the shifted linear scaling relationship.
3.5. Thermodynamic stability of potential catalysts
In the previous section, we found several promising catalysts which may be superior to Cu-based zeolites (Fig. 3a), which are some of the best methane activation catalysts via the radical-like TS in the literature.7–9 Also, various catalysts show Ea(CH4) < 0.75 eV, corresponding to TOF = 1 s−1 at room temperature (Fig. 4a).51 Before suggesting potentially promising materials for practical applications, the synthetic possibility is important to consider.52 Since the synthesizability is a result of many factors, including precursors, reaction conditions, thermodynamics, kinetics, etc., here we only consider the thermodynamic stability of the SACs due to their simplicity. The stability of a SAC is estimated by comparing the binding energy of the single metal atom at a defective site relative to the bulk states as follows.| Eb = E(M@NxCy) − E(@NxCy) − E(M(bulk)) |
For SACs satisfying this stability condition (Eb < 0.1 eV), we plotted the 1D-volcano for methane activation by using Gf (Fig. 6a). Although SACs having CN = 2 show superior catalytic activity than SACs having CN = 3, these catalysts often show Eb > 0.1 eV. Thus, among the stable SACs, several SACs such as Cu@C3, Zn@C3, Zn@N2C and Zn@N3 are expected to show promising catalytic activity compared to IrO2(110) and Cu-based zeolites. The calculated Ea(CH4) values on these catalysts are comparable or somewhat lower than those of IrO2(110) and MOR/Cu–O–Cu (Fig. 6b, S10 and S11†). Thus, Cu and Zn-based M@NxCy catalysts with CN = 3 are identified as promising candidates for low temperature methane activation.
To further consider the thermodynamic stability of the proposed Cu@C3, Zn@C3, Zn@N2C and Zn@N3, we calculated their formation energies (Eform). Unlike Eb, Eform includes the energy for forming the @NxCy defective site (details are given in the ESI†). We compared the Eform of Cu@C3, Zn@C3, Zn@N2C and Zn@N3 with that of experimentally reported M@NxCy catalysts (e.g. Ag@N4, Ru@N4, Co@N4 and Cu@N4).53–60 Among the proposed candidates, we found that Eform of Zn@N2C and Zn@N3 is comparable to or more negative (i.e. more stable) than that of Ag@N4 and Ru@N4 (Table S4†).
Since the methane activation generally proceeds under harsh conditions, the stability of M@NxCy moieties (in particular Zn@N2C and Zn@N3 that are identified here as promising) under experimental conditions should be considered. For example, partial oxidation of methane into methanol with Cu-based zeolites has been experimentally reported at temperatures of 100–200 °C.7,8,61 Recently, room temperature methane conversion into various C1 oxygenates was experimentally achieved at Fe@N4 sites.23 Based on our current finding that Zn@N2C and Zn@N3 are more reactive (lower activation barriers) for the methane activation than Cu-zeolites and Fe@N4, we expect that these M@NxCy catalysts will facilitate methane activation under milder conditions (e.g. T < 100 °C). Various M@NxCy catalysts have also been reported to be stable during the catalytic reaction at ∼100 °C. The alcohol oxidation at Co@Nx and Cu@Nx sites has been reported at 70–130 °C.53–56 The Ru@N4 (ref. 57) and Co@Nx (ref. 58 and 59) sites catalyzed selective hydrogenation at 100–110 °C. Thus, we expect that the suggested catalysts such as Zn@N2C and Zn@N3 will be durable under the experimental conditions.
3.6. Applying a new design strategy
Since our calculations verified that the slopes and intercepts of the linear scaling lines (i.e., activity) are determined by the CN of active sites, it is desirable to consider tuning the CN as well as Ef (or EH). Based on the scaling relationship between Ef and EH, the 2D-volcano plot can be reduced to a 1D-volcano plot by using one descriptor (Gf) (Fig. 6a). In the 1D-volcano plot, the scaling line of CN = 3 is in a higher reactivity region than that of CN = 4. For example, the log(rate) of the volcano top in the scaling line with CN = 3 is higher than that of CN = 4 by approximately 10. This result clearly indicates that lowering the CN which determines the kind of volcano is the primary factor before tuning the Gf. Such a suggestion correlates with the observation that all active sites identified in this study as well as prior work12 in the higher-reactivity line have low CN. After choosing the suitable active site CN, the Ef of active sites can be tuned. For both scaling lines, the top of the 1D-volcano plot is then observed at Gf = 0 eV which is the optimal energetics. In the 1D-volcano plot using N2O as an oxidant, we also found the same trend (Fig. S12†), indicating that the design strategy is applied oxidant-independently. Consequently, active sites with low CN and Gf = 0 eV are suggested to be optimal catalysts for methane activation.In terms of the expansion of the porphyrin system having a dianionic N4 ligand motif, the synthesis and application of subphthalocyanine, subporphyrin, and triphyrin with planar triangular mono-anionic N3 ligands have recently been published.62–64 Due to the fact that these N3 motifs are located in the delocalized π phyrin system, all of them can be expected to capably synthesize homogeneous M@N3 counterpart catalysts, which can exhibit the same effects as the graphene-doped M@N3 presented in this work. However, due to the formation of compounds with low CN, it possibly generates complexes with high CN as a result of dimerization or oligomerization. In addition, the generated M–O species can also react with C–H bond(s) present in a homogeneous catalyst rather than C–H bonds of methane. To overcome such limitations, one can consider heterogenization through grafting the homogeneous M@N3 to the carriers or supports.
4. Conclusions
In this study, we suggest a rational design strategy of single atomic sites for methane activation based on the effect of coordination number (CN) on the scaling relationships. We considered 182 M@NxCy catalysts for C–H bond cleavage reactions of methane based on the *O formation energy (Ef) and its hydrogen binding affinity (EH). The linear scaling relationship between Ef and EH is not broken; however, we found that the linear scaling lines can be shifted by the CN so that the volcano plot can be moved up towards more reactive regions. Specifically, decreasing the CN moves the linear scaling lines towards a desired region for methane activation. The active sites of some superior catalysts found in this study and those previously reported in the experimental literature (e.g. Cu-zeolites) indeed have low coordination numbers. The BEP relationship between EH and Ea(CH4) is not significantly changed by the CN, while the BEP relationship between Ef and Ea(N2O) is shifted by the CN. With the help of moved scaling lines, catalysts with lower CN could facilitate both *O formation and C–H dissociation. Based on this design guideline, several relatively stable catalysts are found promising for experimental verification. We expect that the shifted scaling relationships in undercoordinated active sites for higher reactivity could prove useful for further designing improved catalysts for methane activation.Conflicts of interest
There are no conflicts to declare.Acknowledgements
We acknowledge generous support from the Korean Government through the National Research Foundation of Korea (NRF-2019M3D3A1A01069099) and supercomputing time from Korea Institute of Science and Technology Information (KISTI).Notes and references
-
B. P. Center, Annual Energy Outlook, 2020 Search PubMed
.
- B. Wang, S. Albarracín-Suazo, Y. Pagán-Torres and E. Nikolla, Catal. Today, 2017, 285, 147–158 CrossRef CAS
.
- X. Meng, X. Cui, N. P. Rajan, L. Yu, D. Deng and X. Bao, Chem, 2019, 5, 2296–2325 CAS
.
- R. Balasubramanian, S. M. Smith, S. Rawat, L. A. Yatsunyk, T. L. Stemmler and A. C. Rosenzweig, Nature, 2010, 465, 115–119 CrossRef CAS
.
- S. M. Smith, S. Rawat, J. Telser, B. M. Hoffman, T. L. Stemmler and A. C. Rosenzweig, Biochemistry, 2011, 50, 10231–10240 CrossRef CAS
.
- J. C. Da Silva, R. C. Pennifold, J. N. Harvey and W. R. Rocha, Dalton Trans., 2016, 45, 2492–2504 RSC
.
- M. H. Groothaert, P. J. Smeets, B. F. Sels, P. A. Jacobs and R. A. Schoonheydt, J. Am. Chem. Soc., 2005, 127, 1394–1395 CrossRef CAS
.
- V. L. Sushkevich, D. Palagin, M. Ranocchiari and J. A. van Bokhoven, Science, 2017, 356, 523–527 CrossRef CAS
.
- J. S. Woertink, P. J. Smeets, M. H. Groothaert, M. A. Vance, B. F. Sels, R. A. Schoonheydt and E. I. Solomon, Proc. Natl. Acad. Sci. U. S. A., 2009, 106, 18908–18913 CrossRef CAS
.
- P. Verma, K. D. Vogiatzis, N. Planas, J. Borycz, D. J. Xiao, J. R. Long, L. Gagliardi and D. G. Truhlar, J. Am. Chem. Soc., 2015, 137, 5770–5781 CrossRef CAS
.
- D. J. Xiao, E. D. Bloch, J. A. Mason, W. L. Queen, M. R. Hudson, N. Planas, J. Borycz, A. L. Dzubak, P. Verma and K. Lee, Nat. Chem., 2014, 6, 590–595 CrossRef CAS
.
- A. A. Latimer, A. R. Kulkarni, H. Aljama, J. H. Montoya, J. S. Yoo, C. Tsai, F. Abild-Pedersen, F. Studt and J. K. Nørskov, Nat. Mater., 2017, 16, 225–229 CrossRef CAS
.
- A. S. Rosen, J. M. Notestein and R. Q. Snurr, ACS Catal., 2019, 9, 3576–3587 CrossRef CAS
.
- T. Z. Gani and H. J. Kulik, ACS Catal., 2018, 8, 975–986 CrossRef CAS
.
- G. Kumar, S. L. J. Lau, M. D. Krcha and M. J. Janik, ACS Catal., 2016, 6, 1812–1821 CrossRef CAS
.
- F. Calle-Vallejo, D. Loffreda, M. T. Koper and P. Sautet, Nat. Chem., 2015, 7, 403–410 CrossRef CAS
.
- X. Ma and H. Xin, Phys. Rev. Lett., 2017, 118, 036101 CrossRef
.
- F. Calle-Vallejo, J. Tymoczko, V. Colic, Q. H. Vu, M. D. Pohl, K. Morgenstern, D. Loffreda, P. Sautet, W. Schuhmann and A. S. Bandarenka, Science, 2015, 350, 185–189 CrossRef CAS
.
- F. Calle-Vallejo, J. I. Martínez, J. M. García-Lastra, P. Sautet and D. Loffreda, Angew. Chem., Int. Ed., 2014, 53, 8316–8319 CrossRef CAS
.
- H. Xu, D. Cheng, D. Cao and X. C. Zeng, Nat. Catal., 2018, 1, 339–348 CrossRef CAS
.
- C. Zhou, B. Zhang, P. Hu and H. Wang, Phys. Chem. Chem. Phys., 2020, 22, 1721–1726 RSC
.
- V. Fung, F. F. Tao and D.-e. Jiang, J. Phys. Chem. Lett., 2017, 8, 2206–2211 CrossRef CAS
.
- X. Cui, H. Li, Y. Wang, Y. Hu, L. Hua, H. Li, X. Han, Q. Liu, F. Yang and L. He, Chem, 2018, 4, 1902–1910 CAS
.
- P. E. Blöchl, Physical Review B: Condensed Matter and Materials Physics, 1994, 50, 17953–17979 CrossRef
.
- G. Kresse and J. Furthmüller, Comput. Mater. Sci., 1996, 6, 15–50 CrossRef CAS
.
- G. Kresse and D. Joubert, Physical Review B: Condensed Matter and Materials Physics, 1999, 59, 1758–1775 CrossRef CAS
.
- J. P. Perdew, K. Burke and M. Ernzerhof, Phys. Rev. Lett., 1996, 77, 3865–3868 CrossRef CAS
.
- S. Grimme, J. Antony, S. Ehrlich and H. Krieg, J. Chem. Phys., 2010, 132, 154104–154119 CrossRef
.
- S. Grimme, S. Ehrlich and L. Goerigk, J. Comput. Chem., 2011, 32, 1456–1465 CrossRef CAS
.
- H. J. Monkhorst and J. D. Pack, Phys. Rev. B: Solid State, 1976, 13, 5188–5192 CrossRef
.
- G. Henkelman, B. P. Uberuaga and H. Jónsson, J. Chem. Phys., 2000, 113, 9901–9904 CrossRef CAS
.
- W. Tang, E. Sanville and G. Henkelman, J. Phys.: Condens. Matter, 2009, 21, 084204 CrossRef CAS
.
- M. W. Chase Jr, J. Phys. Chem. Ref. Data, Monogr., 1998, 9, 1–1951 Search PubMed
.
- A. R. Kulkarni, Z.-J. Zhao, S. Siahrostami, J. K. Nørskov and F. Studt, ACS Catal., 2016, 6, 6531–6536 CrossRef CAS
.
- M. H. Mahyuddin, T. Tanaka, Y. Shiota, A. Staykov and K. Yoshizawa, ACS Catal., 2018, 8, 1500–1509 CrossRef CAS
.
- W. Zheng, J. Yang, H. Chen, Y. Hou, Q. Wang, M. Gu, F. He, Y. Xia, Z. Xia and Z. Li, Adv. Funct. Mater., 2020, 30, 1907658 CrossRef CAS
.
- F. Li, G.-F. Han, H.-J. Noh, S.-J. Kim, Y. Lu, H. Y. Jeong, Z. Fu and J.-B. Baek, Energy Environ. Sci., 2018, 11, 2263–2269 RSC
.
- Y. Wang, X. Cui, J. Zhao, G. Jia, L. Gu, Q. Zhang, L. Meng, Z. Shi, L. Zheng and C. Wang, ACS Catal., 2018, 9, 336–344 CrossRef
.
- Z. Yang, B. Chen, W. Chen, Y. Qu, F. Zhou, C. Zhao, Q. Xu, Q. Zhang, X. Duan and Y. Wu, Nat. Commun., 2019, 10, 1–7 CrossRef
.
- Q. Fan, P. Hou, C. Choi, T. S. Wu, S. Hong, F. Li, Y. L. Soo, P. Kang, Y. Jung and Z. Sun, Adv. Energy Mater., 2020, 10, 1903068 CrossRef CAS
.
- E. Jung, H. Shin, B.-H. Lee, V. Efremov, S. Lee, H. S. Lee, J. Kim, W. H. Antink, S. Park and K.-S. Lee, Nat. Mater., 2020, 19, 436–442 CrossRef CAS
.
- J. Zhao, Q. Deng, S. M. Avdoshenko, L. Fu, J. Eckert and M. H. Rümmeli, Proc. Natl. Acad. Sci. U. S. A., 2014, 111, 15641–15646 CrossRef CAS
.
- D. H. Lee, W. J. Lee, W. J. Lee, S. O. Kim and Y.-H. Kim, Phys. Rev. Lett., 2011, 106, 175502 CrossRef
.
- L. Han, S. Song, M. Liu, S. Yao, Z. Liang, H. Cheng, Z. Ren, W. Liu, R. Lin and G. Qi, J. Am. Chem. Soc., 2020, 142, 12563–12567 CrossRef CAS
.
- C. Zhang, J. Sha, H. Fei, M. Liu, S. Yazdi, J. Zhang, Q. Zhong, X. Zou, N. Zhao and H. Yu, ACS Nano, 2017, 11, 6930–6941 CrossRef CAS
.
- H. Tao, C. Choi, L.-X. Ding, Z. Jiang, Z. Han, M. Jia, Q. Fan, Y. Gao, H. Wang and A. W. Robertson, Chem, 2019, 5, 204–214 CAS
.
- X. Rozanska, E. V. Kondratenko and J. Sauer, J. Catal., 2008, 256, 84–94 CrossRef CAS
.
- Z. Liang, T. Li, M. Kim, A. Asthagiri and J. F. Weaver, Science, 2017, 356, 299–303 CrossRef CAS
.
- C.-C. Wang, S. S. Siao and J.-C. Jiang, J. Phys. Chem. C, 2012, 116, 6367–6370 CrossRef CAS
.
- M. Kim, A. Franklin, R. Martin, F. Feng, T. Li, Z. Liang, A. Asthagiri and J. F. Weaver, J. Phys. Chem. C, 2019, 123, 27603–27614 CrossRef CAS
.
-
J. K. Nørskov, F. Studt, F. Abild-Pedersen and T. Bligaard, Fundamental concepts in heterogeneous catalysis, John Wiley & Sons, 2014 Search PubMed
.
- J. Jang, G. H. Gu, J. Noh, J. Kim and Y. Jung, J. Am. Chem. Soc., 2020, 142, 18836–18843 CrossRef CAS
.
- M. Li, S. Wu, X. Yang, J. Hu, L. Peng, L. Bai, Q. Huo and J. Guan, Appl. Catal., A, 2017, 543, 61–66 CrossRef CAS
.
- X. Zhao, Y. Zhou, A.-L. Jin, K. Huang, F. Liu and D.-J. Tao, New J. Chem., 2018, 42, 15871–15878 RSC
.
- J. Xie, K. Yin, A. Serov, K. Artyushkova, H. N. Pham, X. Sang, R. R. Unocic, P. Atanassov, A. K. Datye and R. J. Davis, ChemSusChem, 2016, 10, 359–362 CrossRef
.
- L. Zhang, A. Wang, W. Wang, Y. Huang, X. Liu, S. Miao, J. Liu and T. Zhang, ACS Catal., 2015, 5, 6563–6572 CrossRef CAS
.
- X. Wang, W. Chen, L. Zhang, T. Yao, W. Liu, Y. Lin, H. Ju, J. Dong, L. Zheng and W. Yan, J. Am. Chem. Soc., 2017, 139, 9419–9422 CrossRef CAS
.
- P. Zhou, L. Jiang, F. Wang, K. Deng, K. Lv and Z. Zhang, Sci. Adv., 2017, 3, e1601945 CrossRef
.
- X. Sun, A. I. Olivos-Suarez, D. Osadchii, M. J. V. Romero, F. Kapteijn and J. Gascon, J. Catal., 2018, 357, 20–28 CrossRef
.
- Y. Chen, R. Guo, X. Peng, X. Wang, X. Liu, J. Ren, J. He, L. Zhuo, J. Sun, Y. Liu, Y. Wu and J. Luo, ACS Nano, 2020, 14, 6938–6946 CrossRef CAS
.
- S. Grundner, M. A. Markovits, G. Li, M. Tromp, E. A. Pidko, E. J. Hensen, A. Jentys, M. Sanchez-Sanchez and J. A. Lercher, Nat. Commun., 2015, 6, 1–9 Search PubMed
.
- A. Meller and A. Ossko, Monatsh. Chem., 1972, 103, 150–155 CrossRef CAS
.
- Y. Inokuma, J. H. Kwon, T. K. Ahn, M. C. Yoo, D. Kim and A. Osuka, Angew. Chem., Int. Ed., 2006, 45, 961–964 CrossRef CAS
.
- S. Shimizu, Chem. Rev., 2017, 117, 2730–2784 CrossRef CAS
.
Footnote |
| † Electronic supplementary information (ESI) available. See DOI: 10.1039/d0sc05632d |
| This journal is © The Royal Society of Chemistry 2021 |

