
 Open Access Article
 This Open Access Article is licensed under a Creative Commons Attribution-Non Commercial 3.0 Unported Licence
Quantitative measures of myo-IP6 in soil using solution 31P NMR spectroscopy and spectral deconvolution fitting including a broad signal†
Jolanda E.
Reusser
 *a,
René
Verel
b,
Emmanuel
Frossard
a and
Timothy I.
McLaren
a
*a,
René
Verel
b,
Emmanuel
Frossard
a and
Timothy I.
McLaren
a
aDepartment of Environmental Systems Science, Group of Plant Nutrition, ETH Zurich, Eschikon 33, CH-8315 Lindau, Switzerland. E-mail: jolanda.reusser@usys.ethz.ch
bDepartment of Chemistry and Applied Biosciences, Laboratory of Inorganic Chemistry, ETH Zurich, Vladimir-Prelog-Weg 1-5/10, CH-8093 Zurich, Switzerland
First published on 5th March 2020
Abstract
Inositol phosphates, particularly myo-inositol hexakisphosphate (myo-IP6), are an important pool of soil organic phosphorus (P) in terrestrial ecosystems. To measure concentrations of myo-IP6 in alkaline soil extracts, solution 31P nuclear magnetic resonance (NMR) spectroscopy is commonly used. However, overlap of the NMR peaks of myo-IP6 with several other peaks in the phosphomonoester region requires spectral deconvolution fitting (SDF) to partition the signals and quantify myo-IP6. At present, two main SDF approaches are in use; the first fits a Lorentzian/Gaussian lineshape to the myo-IP6 peaks directly to the baseline without an underlying broad signal, and the second fits a Lorentzian/Gaussian lineshape to the myo-IP6 peaks simultaneously with an underlying broad peak. The aim of this study was to compare the recovery of added myo-IP6 to soil extracts using both SDF procedures for six soil samples of diverse origin and differing concentrations of organic P (112 to 1505 mg P per kgsoil). The average recovery of total added myo-IP6 was 95% (SD 5) and 122% (SD 32) using SDF with and without an underlying broad signal, respectively. The recovery of individual peaks of myo-IP6 differed, most notably, the C5 phosphate peak of myo-IP6 was overestimated by up to 213% when a broad peak was not included in SDF. Based on the SDF procedure that includes a broad peak, concentrations of myo-IP6 ranged from 0.6 to 90.4 mg P per kgsoil, which comprised 1–23% of total phosphomonoesters. Our results demonstrate that the SDF procedure with an underlying broad signal is essential for the accurate quantification of myo-IP6 in soil extracts.
Environmental significanceIn terrestrial ecosystems, myo-inositol hexakisphosphate (myo-IP6) is considered to be a major pool of organic phosphorus (P) in soil. However, there is disagreement in the literature on how to accurately measure myo-IP6 in soil using solution 31P nuclear magnetic resonance (NMR) spectroscopy. We provide new insights on the use of solution 31P NMR spectroscopy followed by spectral deconvolution fitting for the quantitative measurement of myo-IP6 in soil extracts. Accurate quantification of myo-IP6 is essential for understanding its transformation in soil and hence availability for living organisms as well as its potential contribution to P movement into aquatic ecosystems. |
1. Introduction
Phosphorus (P) is an essential macronutrient for all living organisms, which is primarily sourced from the soil environment. It is estimated that between 20 and 80% of the total P (Ptot) in soil exists in an organic form.1,2 A major pool of identifiable organic P (Porg) in soil is that of inositol phosphates (IP), of which the myo stereoisomer of inositol hexakisphosphate (myo-IP6) is the most abundant.3,4 Studies have reported that pools of myo-IP6 comprise on average one third of the total Porg in soil.5 The mechanism for its accumulation in soil is thought to be due to its high binding affinity to aluminum and iron (hydro-)oxides.6Solution 31P nuclear magnetic resonance (NMR) spectroscopy has been used since 1980 to identify the chemical nature of Porg in soil extracts.7,8 The majority of P (∼80%) in NaOH soil extracts is detected in the phosphomonoester region (organic moiety-O-PO3) of the NMR spectrum.5 However, due to many overlapping signals in this region, spectral deconvolution fitting (SDF) procedures are required to partition the NMR signal.9 The two main SDF approaches applied to soil extracts are that of Turner et al., (2003)10 or modifications thereof,11 and Bünemann et al., (2008)12 or modifications thereof.13
Turner et al., (2003)10 were the first to propose a SDF procedure that could partition the NMR signal within the phosphomonoester region and quantify myo-IP6 in soil extracts. The SDF procedure was carried out using the Bruker WinNMR program, and involved fitting a series of sharp signals from the peak maxima of myo-IP6 to the baseline of the spectra. The procedure was applied to 29 soils under grassland in the United Kingdom and the authors tested the efficacy of the procedure by calculating the recovery of added myo-IP6 in a 1 M NaOH solution containing a mixture of Porg compounds. The authors reported that the recovery of added myo-IP6 was on average 102%. However, a limitation of this study was that recoveries of added myo-IP6 were determined in non-soil extracts.
In contrast, Bünemann et al., (2008)12 later proposed a SDF for the quantification of Porg compounds (e.g. myo-IP6) that involved fitting a broad feature in the phosphomonoester region, which was then subtracted from the original NMR spectrum and then the overlaying sharp signals were fitted. The authors hypothesized that the broad signal was caused by phosphomonoesters in large and complex molecules, which was later confirmed by McLaren et al., (2015)14 and McLaren et al., (2019).13 Bünemann et al., (2008)12 did not describe the SDF procedure in detail or test its efficacy at the time. However, Doolette et al., (2010)15 compared the two SDF procedures (with and without a broad signal) to quantitatively recover myo-IP6, which was added to a soil extract. The authors reported that the concentration of myo-IP6 was overestimated by 54% when a broad signal was not included. Doolette et al., (2011)16 later explained the SDF procedure in more detail. A limitation of this study was that the recovery of added myo-IP6 was only tested on one soil extract. In addition, both SDF methods were not able to identify the recovery of the four individual peaks of myo-IP6 due to poor spectral resolution.
A plethora of studies have been carried out since 2003 to identify the chemical nature of soil Porg using solution 31P NMR spectroscopy and SDF procedures.8 Despite this, there has been no detailed assessment on the efficacy of the two main SDF procedures, which has major consequences for how we understand the composition of soil Porg. The implicit assumption of the SDF procedure without a broad signal is that the phosphomonoester region is comprised of an array of sharp peaks (e.g. myo-IP6) with very similar linewidths, which are presumably from small organic molecules.17,18 In contrast, the implication of the SDF procedure with a broad signal is that it interprets the phosphomonoester region as comprised of a broad signal, which is considered to be Porg in the form of large molecular structures and associated with the soil organic matter (SOM),13,14 and in addition an array of sharp peaks from small organic molecules containing P. It is also important to reconcile these views with previous studies using non-NMR techniques, which often reported large concentrations of Porg in large molecular weight fractions.14,19
The aim of this study was to assess the efficacy of the two SDF procedures to quantitatively determine myo-IP6 in soil extracts. myo-Inositol hexakisphosphate was chosen because it can be easily detected in 31P NMR spectra on soil extracts as four distinct peaks in a 1![[thin space (1/6-em)]](https://www.rsc.org/images/entities/char_2009.gif) :2:2:1 ratio. This ratio is caused by the chemical structure of myo-IP6 (see Fig. SI-1 in the ESI†), with the two phosphate groups bound to the C1 and C3 carbon nuclei of the inositol ring being chemically equivalent, and therefore exhibiting the same chemical shift. This is similarly the case for the phosphate groups bound to the C4 and C6 carbon nuclei. The phosphate groups bound to C5 and C2 have distinct chemical environments caused by the conformation of the molecule. The combined four peaks associated with the phosphate groups of myo-IP6 can be used to probe a relatively wide chemical shift range in the phosphomonoester region of the 31P NMR spectrum using a single compound.
:2:2:1 ratio. This ratio is caused by the chemical structure of myo-IP6 (see Fig. SI-1 in the ESI†), with the two phosphate groups bound to the C1 and C3 carbon nuclei of the inositol ring being chemically equivalent, and therefore exhibiting the same chemical shift. This is similarly the case for the phosphate groups bound to the C4 and C6 carbon nuclei. The phosphate groups bound to C5 and C2 have distinct chemical environments caused by the conformation of the molecule. The combined four peaks associated with the phosphate groups of myo-IP6 can be used to probe a relatively wide chemical shift range in the phosphomonoester region of the 31P NMR spectrum using a single compound.
2. Materials and methods
2.1. Soil collection and preparation
Six soil samples were collected from the upper horizon of soil profiles including different soil types and land use systems across four countries. We included soils that covered a wide diversity of organic P contents and soil properties: two Cambisols (S3 and S6) and a Gleysol (S5) from Switzerland, a Ferralsol (S1) from Colombia, a Cambisol (S4) from Germany, and a Vertisol (S2) from Australia.20 Soil S1 was collected in 1997 from the 0–20 cm soil layer of the improved grassland treatment of the long-term Culticore field experiment at the Carimagua Research Station in Colombia.21 Soil S2 was collected in 2017 from the 0–15 cm soil layer of a field under cropping from southern Queensland, Australia. The site has been under cultivation for the past 25 years and prior to this was shrubland containing sparse Eucalyptus camaldulensis L. and native grasses. Soil S3 was collected in 2017 from the 0–20 cm soil layer of a cultivated field, but was under grassland for more than 6 years prior. Soil S4 was collected in 2014 from the 0–7 cm topsoil layer of a beech forest in Bad Brückenau, Germany, as described in Bünemann et al., (2016).22 Soil S5 was collected in 2017 from the 0–10 cm soil layer of a drained marshland, which has been under grassland for more than 20 years, near Lucerne, Switzerland. Sample S6 was collected in 2013 from the 0–20 cm soil layer from an unfertilized border strip of a cultivated field in Rümlang, Switzerland.23Background information on the studied sites, and some chemical and physical properties of the soils, are reported in Table 1. Soils S3, S4 and S5 were passed through a 5 mm sieve and dried at 60 °C for 5 days. Soils S1 and S6 were received dried and sieved at <2 mm, whereas S2 was received dried (at 40 °C for 2 days) and ground at <2 mm. In order to include soils with a diversity of organic P contents and soil properties, soils were sourced from the field in Switzerland and from previous studies.21–23 Consequently, there were small differences in soil preparation among soils used in this study, which may slightly affect soil P extraction. Nevertheless, these differences will not affect the application of SDF procedures to the resultant NMR spectra for the quantification of added myo-IP6 in soil extracts. Concentrations of total carbon (Ctot) and nitrogen (Ntot) in soil were measured using combustion of 50 mg ground soil weighed into tin foil capsules (vario PYRO cube®, Elementar Analysesysteme GmbH). Concentrations of 0.5 M H2SO4 extractable Ptot and Porg in soil were measured using the ignition-H2SO4 method of Saunders and Williams (1955)24 as described in Kuo (1996).25 Total concentrations of soil P were determined by X-ray fluorescence spectroscopy (SPECTRO XEPOS ED-XRF, AMETEK®) using 4.0 g of ground soil sample mixed with 0.9 g of wax (CEREOX Licowax, FLUXANA®). The XRF instrument was calibrated using commercially available reference soils. Soil pH was measured in H2O at a soil to solution ratio of 1:2.5 (w/w) with a glass electrode.
| Parameter | Unit | S1 | S2 | S3 | S4 | S5 | S6 |
|---|---|---|---|---|---|---|---|
| a Meyer et al., (2017).23 | |||||||
| Soil type | — | Ferralsol | Vertisol | Cambisol | Dystric skeletic Cambisol | Gleysol | Calcaric Cambisol |
| Country | — | Colombia | Australia | Switzerland | Germany | Switzerland | Switzerland |
| Coordinates of sampling | — | 4°30′ N/71°19′ W | 27°52′ S/151°37′ E | 46°55′ N/7°36′ E | 50°21′ N/9°55′ E | 47°05′ N/8°06′ E | 47°26′ N/8°31′ E |
| Elevation | m ASL | 150 | 402 | 748 | 800 | 612 | 443 |
| Sampling depth | cm | 0–20 | 0–15 | 0–20 | 0–7 | 0–10 | 0–20 |
| Land use | — | Pasture | Arable | Pasture | Forest | Pasture | Arable |
| Ctot | g C per kgsoil | 26.7 | 23.9 | 21.0 | 90.3 | 148.3 | 27.6 |
| Ntot | g N per kgsoil | 1.7 | 1.9 | 2.3 | 6.6 | 10.9 | 2.5 |
| pH in H2O | — | 3.6 | 6.1 | 5.1 | 3.6 | 5.0 | 7.7a |
2.2. Extraction of soil organic P
Concentrations of Porg were determined based on the method of Cade-Menun et al., (2002).26 Briefly, 3.0 g of soil was extracted with 30 mL of 0.25 M NaOH + 0.05 M Na2EDTA. Soil extracts were shaken for 16 h on a horizontal shaker at 150 rpm at 24 °C, centrifuged for 10 min at 4643g, and then the supernatant passed through a Whatman no. 42 filter paper. A 20 mL aliquot of the filtrate was frozen at −80 °C and then lyophilized prior to NMR analysis. This resulted in 420 to 782 mg of lyophilized material across all soils. Concentrations of Ptot in the remaining filtrates were measured using inductively coupled plasma-optical emission spectrometry (ICP-OES). Concentrations of molybdate reactive P (MRP) were measured using the malachite green method of Ohno and Zibilske (1991).27 The difference between Ptot and MRP in NaOH-EDTA filtrates is molybdate unreactive P (MUP), which is largely considered to be Porg,28 but may also include a small proportion of condensed phosphates (e.g. pyrophosphate).292.3. Preparation of lyophilized material for solution 31P NMR spectroscopy
Preparation of lyophilized material for solution 31P NMR spectroscopy was based on a modification of the methods as reported in Vincent et al., (2013)30 and Spain et al., (2018).31 Briefly, 120 mg of lyophilized material was weighed into 1.5 mL microcentrifuge tubes and then a 600 μL aliquot of 0.25 M NaOH + 0.05 M Na2EDTA solution was added. The solution was briefly vortexed and then allowed to rest overnight in order for complete hydrolysis of RNA and phospholipids.32–35 This is because the hydrolysis products of RNA (RNA mononucleotides34) and phospholipids (α- and β-glycerophosphate32) generate peaks in the phosphomonoester region.32,35 The microcentrifuge tubes were then centrifuged at 10621g for 15 min, and a 500 μL aliquot of the supernatant was transferred to another 1.5 mL microcentrifuge tube, which then received a 25 μL aliquot of a 0.03 M methylenediphosphonic acid (MDP) standard in D2O (Sigma-Aldrich, product no. M9508) and a 25 μL aliquot of sodium deuteroxide (NaOD) at 40% (w/w) in D2O (Sigma-Aldrich, product no. 372072). The solution was briefly vortexed and then transferred to 5 mm NMR tubes for analysis.
Subsequent NMR analyses of samples S4 and S5 revealed considerable line-broadening of all peaks in the NMR spectra, which might have been caused by high sample viscosity. Therefore, the preparation of lyophilized material was repeated for these samples but at a wider ratio, as recommended by Cade-Menun and Liu (2014).8 For these samples, 80 mg of lyophilized material was dissolved in 600 μL of 0.25 M NaOH + 0.05 M Na2EDTA solution, and then prepared as previously described. This overcame the issue and resulted in high resolution NMR spectra.
2.4. Solution 31P NMR spectroscopy
All NMR analyses were carried out with a Bruker Avance IIIHD 500 MHz NMR spectrometer equipped with a 5 mm liquid-state Prodigy™ CryoProbe (Bruker Corporation; Billerica, MA) at the NMR facility of the Laboratory of Inorganic Chemistry (Hönggerberg, ETH Zürich). Solution 31P NMR spectra were acquired using a 31P frequency of 202.5 MHz, with gated broadband proton decoupling and 90° pulses (duration of 12 μs) for excitation. Careful shimming of the samples resulted in a spectral resolution of <0.1 Hz. The recycle delay of each sample was set based on an inversion recovery experiment.36 Briefly, the spin–lattice relaxation times (T1) were calculated from 10 separate experiments with increasing τ values, the time period between the applied pulses in the inversion recovery sequence. Each spectrum was obtained with the collection of 24 scans and a recycle delay of 5 s. Total duration of the inversion recovery experiment for each sample was 56 min. The recycle delay for each sample was calculated by multiplying the longest T1 value from the inversion recovery experiment by five. This resulted in recycle delays ranging from 6.7 to 31.0 s across all soils. The number of scans was set to 1024 or 4096, depending on the signal to noise ratio of the obtained spectrum.2.5. Processing of NMR spectra
Spectral processing involved Fourier transformation, phase correction and baseline adjustment using the TopSpin® software of Bruker (Version 3.5 pl 7, Bruker Corporation; Billerica, MA). All NMR spectra were processed with an exponential line-broadening of 0.6 Hz. Since the concentration of added MDP is known, its integral (net peak area) is directly proportional to that of all other NMR signals.16 Therefore, quantification of P species in NMR spectra was carried out based on spectral integration.37 In general, integral regions included: (1) phosphonates, in particular the added MDP (δ 16.9 to 16.3 ppm), which includes its two carbon satellite peaks (at δ 16.96 and 16.36 ppm), 2-aminoethylphosphonic acid (δ 19.8 to 19.6 ppm), unknown phosphonate 1 (δ 19.3 to 19.2 ppm), unknown phosphonate 2 (δ 18.3 to 18.1 ppm) and unknown phosphonate 3 (δ 16.5 to 16.4 ppm); (2) the combined orthophosphate and phosphomonoester region (δ 6.0 to 3.0 ppm); (3) phosphodiesters, in particular unknown phosphodiester 1 (δ 2.5 to 2.2 ppm), unknown phosphodiester 2 (δ 0.6 to 0.5 ppm), DNA (δ −0.7 to −1.4 ppm) and unknown phosphodiester 3 (δ −2.3 to −2.4 ppm); and (4) pyrophosphate (δ −4.8 to −5.4 ppm). These integral regions are highlighted in Fig. SI-3 in the ESI.† Due to overlapping signals in the orthophosphate and phosphomonoester region, SDF was needed to partition the NMR signals within this region.2.6. Deconvolution fitting procedures
Two spectral deconvolution fitting approaches were applied to the orthophosphate and phosphomonoester region. The first approach involved fitting all identifiable sharp peaks (i.e. distinguishable from the noise of the spectrum) to the baseline of the spectra, which is based on the method of Turner et al., (2003).38 The second approach involved fitting all identifiable sharp signals and simultaneously an underlying broad signal in the phosphomonoester region, which has been described in McLaren et al., (2019),13 and is based on the method of Bünemann et al., (2008).17 We used MATLAB® R2017a (The MathWorks, Inc.) scripts containing a non-linear optimization algorithm for the SDF of the NMR spectra. Fig. 1 shows a graphical representation of the two deconvolution fitting procedures used in this study (peak assignment according to16). For both SDF procedures, a Lorentzian or Gaussian lineshape model was selected for each peak based on a visual assessment of the most optimized fit and calculated residuals. In general, a Lorentzian lineshape was used to fit the broad signal, signals of myo-IP6 and orthophosphate, whereas a Gaussian lineshape was used to fit the remaining sharp signals, which were generally of lower signal intensity. Each of the identifiable sharp peaks were fitted between an upper and lower bound on both their linewidths at half height and their peak positions at highest intensity. The same was true for the peak position of the underlying broad signal and its linewidth at half height. The upper and lower bound for both parameters of the broad signal being set to δ 3.8 ppm and δ 4.5 ppm, and from 19 Hz to 293 Hz, respectively. Within these visually assessed boundaries, all signals (including the underlying broad signal) were fitted by the non-linear optimization algorithm. The residues of all fitted spectra are plotted in Fig. SI-4 and SI-5 in the ESI.† The goodness of fit parameters of the SDF including the Root-mean-square fitting error and R2 (coefficient of determination) are listed in Table SI-1 (ESI†). Table SI-1† also includes the results of a reduced Chi2-test in MATLAB® with the fitted peaks and the according residuals (chemical shift range δ 5.2 to 3.0 ppm). We carried out the Chi2-test in order to determine if an overfitting of the spectra occurred (Chi2 < 1). Briefly, the results (Chi2 > 1) show that there was no overfitting of the spectra using both SDF approaches, and that the Chi2 values of the SDF approach with a broad signal were closer to 1 than without a broad signal, which suggests the former approach is a better fit of the spectra. Furthermore, we carried out the Bootstrap sampling function of MATLAB® (n = 100) for all peaks within the given boundaries of the peak positions, the area and linewidths at half height. The resulting means of the peak position and linewidths at half height including the standard deviations for the broad signal are listed in Table SI-2 in the ESI.† The calculated standard deviations were very low for all three parameters, indicating a good fit of the broad peak within the given boundaries.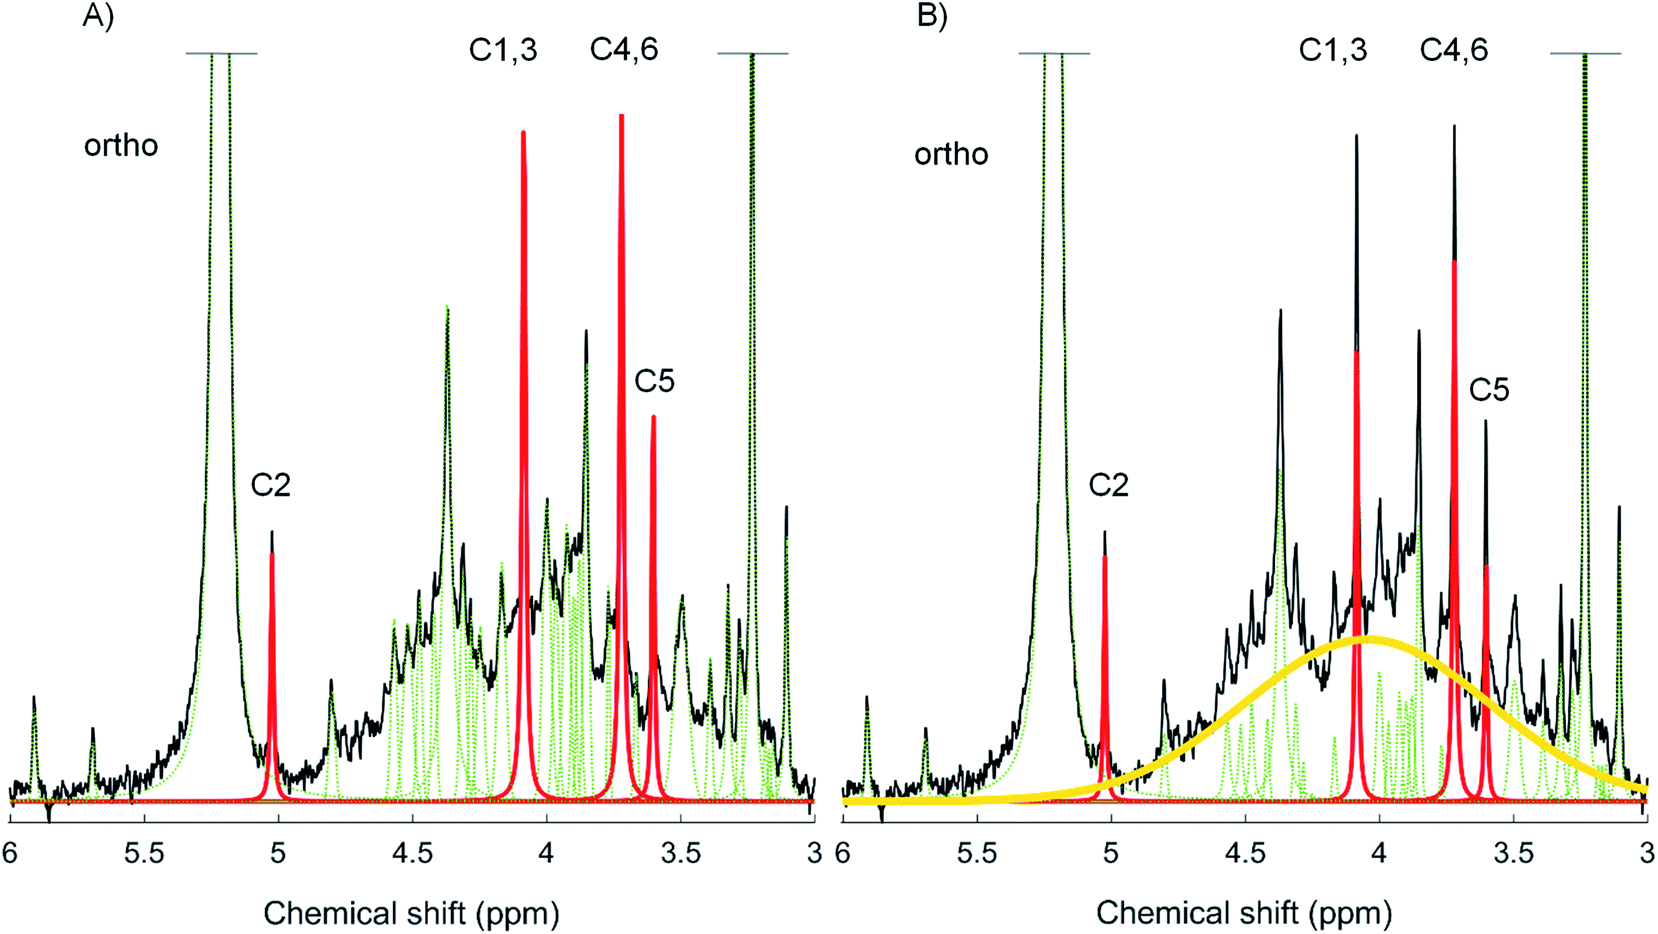 | ||
| Fig. 1 Solution 31P NMR spectrum of 0.25 M NaOH + 0.05 M EDTA soil extract S6 (black). Graphical representation of the two spectral deconvolution fitting approaches without (A) and with an underlying broad signal (B). All fitted peaks are illustrated; the broad peak (yellow) and the four myo-IP6 peaks (red) have been highlighted. In addition, the phosphate groups bound to carbons C1–6 of myo-IP6 and also that of the orthophosphate (ortho) peak, have been identified. | ||
2.7. Spiking experiment
The two deconvolution fitting procedures were assessed by determining the recovery of a known amount of added myo-IP6 to soil extracts. After NMR analysis of the unspiked soil extract, a 10 μL aliquot of a 5.5 mM myo-IP6 standard in D2O was added to all soil extracts except for soil S5 (Sigma-Aldrich, product no. P5681). For sample S5, a 10 μL aliquot of a 11 mM myo-IP6 standard in D2O was added. The aim was to add myo-IP6 at a concentration that would result in an increase of peak intensity of approximately 3-times the peak intensity in unspiked extracts.32 The NMR tube was then sealed with parafilm, inverted several times, and then allowed to rest prior to NMR analysis. The NMR analysis parameters on the spiked soil extract were the same as that carried out on unspiked extracts. Similarly, spectral processing and quantification were carried out as previously described. The recovery of added myo-IP6 was calculated using eqn (1). | (1) |
2.8. Statistical analyses and graphics
All graphics were created using MATLAB® R2017a (The MathWorks, Inc.). All statistical analyses were carried out using Microsoft® Excel 2016. This included calculating the mean values and standard deviations (SD) of the added myo-IP6 recovery across the six soil samples. The NMR observability was calculated by comparing the concentration of Ptot as detected by NMR with that measured by ICP-OES,16,39 which ranged from 52 to 89% (on average of 68%) across all soils.3. Results
3.1. Pools of soil P
Concentrations of Ptot in soil using XRF ranged from 320 to 3841 mg P per kgsoil (Table 2). Concentrations of Ptot in NaOH-EDTA extracts comprised 28 to 51% of the Ptot in soil as measured by XRF. Concentrations of Porg using the ignition-H2SO4 extraction technique ranged from 143 to 1377 mg P per kgsoil. The concentration of Porg in NaOH-EDTA extracts ranged from 93 to 1326 mg P per kgsoil, which comprised 8 to 35% (an average value of 24%) of the total soil P using XRF.| Soil | XRF | Ignition-H2SO4 extraction | NaOH-EDTA extraction | ||
|---|---|---|---|---|---|
| Ptot, mg P per kgsoil | Porg, mg P per kgsoil (%) | Ptot, mg P per kgsoil (%) | MRPa, mg P per kgsoil (%) | MUPb, mg P per kgsoil (%) | |
| a Molybdate reactive P (MRP) based on the malachite green method of Ohno and Zibilske (1991).27 b The difference between Ptot and MRP is molybdate unreactive P (MUP), which is considered to be Porg. | |||||
| S1 | 320 | 109 (34) | 160 (50) | 67 (21) | 93 (29) |
| S2 | 1726 | 143 (8) | 484 (28) | 351 (20) | 133 (8) |
| S3 | 2553 | 729 (29) | 863 (34) | 323 (13) | 540 (21) |
| S4 | 3841 | 1377 (36) | 1850 (48) | 525 (14) | 1326 (35) |
| S5 | 2913 | 939 (32) | 1490 (51) | 610 (21) | 880 (30) |
| S6 | 1724 | 430 (25) | 510 (30) | 128 (7) | 382 (22) |
3.2. Solution 31P NMR spectra of soil extracts
The majority of NMR signals occurred in the orthophosphate and phosphomonoester region (δ 6.0 to 3.0 ppm), which comprised on average 96% of total NMR signal (Table 3). In general, the peak of greatest intensity across all soils was that of orthophosphate (apart from the added MDP). The largest pool of Porg as determined by the integral over the various regions of peaks was that of phosphomonoesters, which accounts on average for 94% of the total NMR signal arising from organic forms. Concentrations of phosphomonoesters range from 36.3 to 501.1 mg P per kgsoil. The remaining NMR signal is distributed between phosphodiesters, pyrophosphates and phosphonates.| Soil | Phosphonatesa (δ 19.8 to 16.5 ppm) | Orthophosphate (δ 5.5 to 5.0 ppm) | P-monoester (δ 6.0 to 3.0 ppm) | P-diesters (δ 2.5 to −2.4 ppm) | Pyrophosphates (δ −4.8 to −5.3 ppm) |
|---|---|---|---|---|---|
| a The added methylenediphosphonic acid (MDP) standard is not included. | |||||
| S1 | 1.0 | 55.0 | 37.0 | 5.1 | 1.9 |
| S2 | 1.0 | 85.0 | 13.3 | 0.0 | 0.7 |
| S3 | 0.2 | 50.4 | 47.8 | 0.4 | 1.2 |
| S4 | 1.5 | 46.7 | 47.7 | 2.9 | 1.3 |
| S5 | 0.0 | 48.5 | 45.3 | 3.3 | 2.9 |
| S6 | 0.2 | 51.1 | 46.9 | 0.0 | 1.8 |
The phosphomonoester region comprised of two main spectral features based on a visual assessment; the presence of (i) 18 to 47 sharp signals, and (ii) an underlying broad signal. The four peaks of myo-IP6 were observed in the NMR spectra of all soils except in soil S2, in which only the C1,3 and C4,6 peaks could be clearly identified due to the low initial concentration of myo-IP6. In all soils, the C2 peak of myo-IP6 at δ 5.04 ppm in the NMR spectra exhibited little overlap with the broad signal compared to the other peaks of myo-IP6. Some slight overlap between the C2 peak of myo-IP6 and the base of the orthophosphate peak was observed in soils S4 and S5.
3.3. Spike recoveries of total myo-IP6
Spiking the soil extracts with myo-IP6 resulted in a clear increase in its peak intensities at δ 5.04 ppm, 4.10 ppm, 3.72 ppm and 3.61 ppm across all soils (Fig. 2). On average, the increase in peak intensity of myo-IP6 was 3-fold relative to the unspiked samples in terms of absolute intensity from the peak maximum to the baseline of the spectrum. The exception was sample S2, where the increase of the C1,3 and the C4,6 peak was 7-fold relative to the unspiked sample. The increase in peak intensity due to spiking varied for the four individual peaks of myo-IP6. The C2 peak showed the greatest increase of intensity (3.2-fold) whereas the C5 peak showed the least (2.6-fold). The addition of the phytate standard to the soil extract also resulted in an increase in the intensity of other peaks to that of myo-IP6, particularly peaks at δ 3.98, 4.14, 4.17 and 4.57 ppm.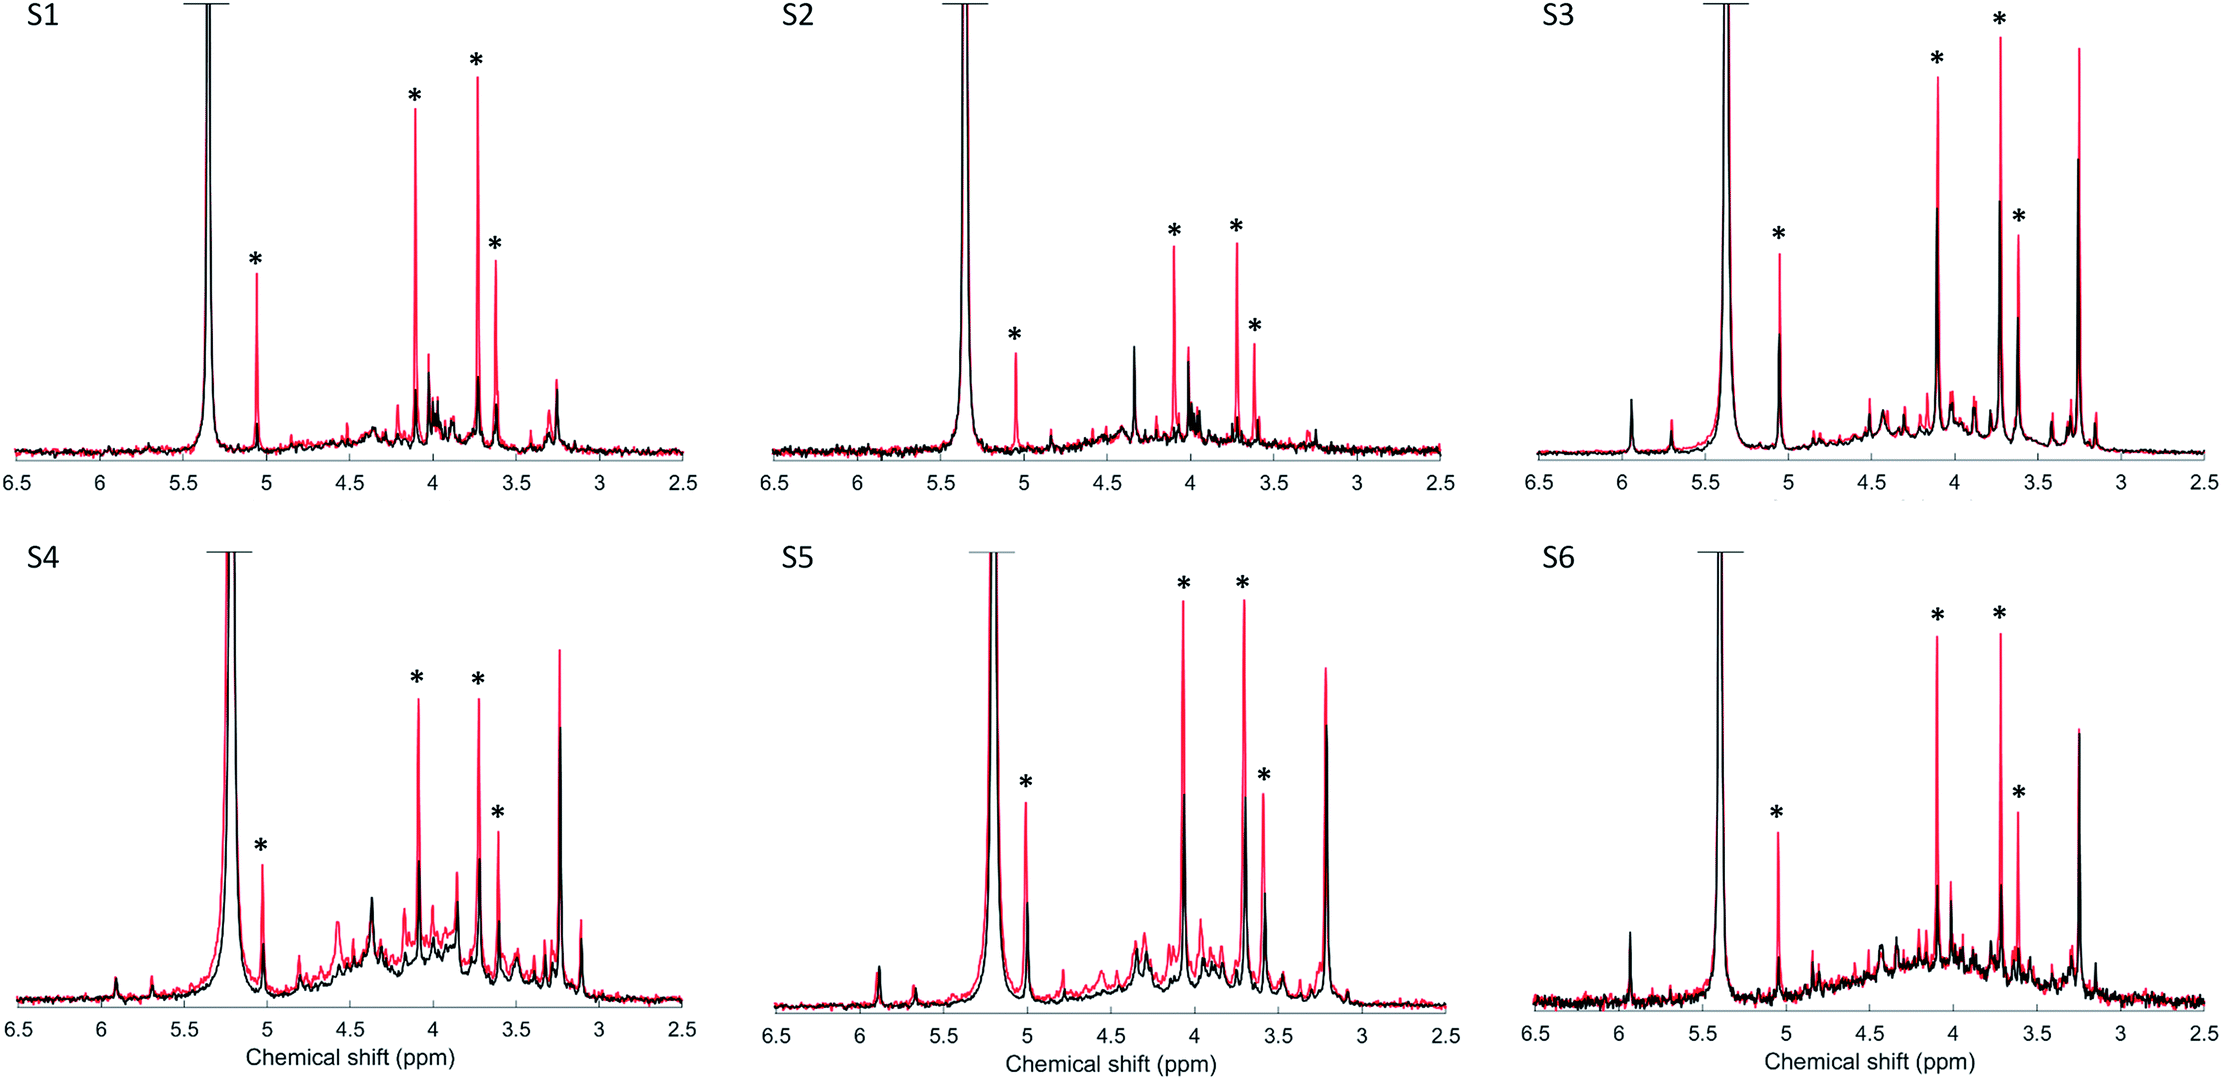 | ||
| Fig. 2 Solution 31P nuclear magnetic resonance (NMR) spectra of the orthophosphate and phosphomonoester region on unspiked (black) and spiked (red) 0.25 M NaOH + 0.05 M EDTA soil extracts. Samples were spiked with a 10 μL aliquot of 5.5 mm myo-IP6 (Sigma-Aldrich, product no. P5681) except for soil sample S5, which was spiked with a 11 mm myo-IP6-standard solution. Signal intensities were normalized to the MDP peak intensity for direct comparison of unspiked and spiked extracts. However, in order to highlight spectral features, the vertical axes of the spectra have been increased by a factor of 1.7 for soils S3, S4 and S5, and by a factor of 10 for soils S1, S2 and S6. The four peaks generated by myo-IP6 are marked with an asterisk. | ||
The recovery of total myo-IP6 in the six soil extracts using the SDF procedure with a broad signal was on average 95%, whereas this was on average 122% using the SDF procedure without a broad signal (Table 4). In addition, the variation in recovery of myo-IP6 across the six samples was least using the former approach (SD of 5) compared to the latter approach (SD of 32).
| SDF procedure | myo-IP6 | S1 (%) | S2 (%) | S3 (%) | S4 (%) | S5 (%) | S6 (%) | Average (%) | SD |
|---|---|---|---|---|---|---|---|---|---|
| With broad signal | Total myo-IP6 | 96 | 90 | 99 | 92 | 91 | 105 | 95 | 5 |
| C2-myo-IP6 | 103 | 101 | 73 | 106 | 95 | 104 | 97 | 12 | |
| C1,C3-myo-IP6 | 97 | 91 | 108 | 74 | 81 | 106 | 93 | 14 | |
| C4,C6-myo-IP6 | 103 | 91 | 103 | 96 | 97 | 116 | 101 | 9 | |
| C5-myo-IP6 | 73 | 77 | 96 | 106 | 95 | 81 | 88 | 13 | |
| Without broad signal | Total myo-IP6 | 146 | 120 | 73 | 151 | 94 | 147 | 122 | 32 |
| C2-myo-IP6 | 146 | 113 | 76 | 111 | 101 | 119 | 111 | 23 | |
| C1,C3-myo-IP6 | 148 | 109 | 77 | 130 | 83 | 175 | 120 | 38 | |
| C4,C6-myo-IP6 | 150 | 127 | 67 | 158 | 91 | 124 | 120 | 35 | |
| C5-myo-IP6 | 135 | 133 | 76 | 213 | 117 | 167 | 140 | 46 |
3.4. Spike recoveries of individual peaks of myo-IP6
Spike recoveries for each of the four peaks of myo-IP6 differed between the SDF approaches across all soils (Table 4). Overestimation of spike recoveries using the SDF procedure without a broad peak was greatest (up to 213%) for the C5 peak of myo-IP6 compared to all other peaks. Furthermore, spike recoveries of the C1,3 and C4,6 peaks of myo-IP6 were overestimated on average 8% more than that of the C2 peak. The peak ratios of myo-IP6 in the unspiked soils were on average 1.0:2.2:1.8:0.9 with a broad signal and 1.0:2.1:1.9:0.7 without a broad signal, when the C2 peak was set to 1 (soil S2 was not included due to unreliable measures of the C2 and C5 peaks of myo-IP6).
3.5. Quantification of myo-IP6 (and the broad signal) in soil extracts
Concentrations of total myo-IP6 in soil extracts obtained with SDF with a broad peak ranged from 0.6 to 90.4 mg P per kgsoil, which comprised between 1% and 23% of total phosphomonoesters (Table 5). On average, the broad signal accounted for 64% of total phosphomonoesters across all soils (Table 5). When concentrations of myo-IP6 as determined by SDF with a broad peak were subtracted from the myo-IP6 values obtained by SDF without a broad peak, the amount of Porg that would have been previously attributed to myo-IP6 ranged from 1.3 to 56.1 mg P per kgsoil.| Parameter | Unit | S1 | S2 | S3 | S4 | S5 | S6 |
|---|---|---|---|---|---|---|---|
| myo-IP6 | mg P per kgsoil | 4.4 | 0.6 | 80.7 | 46.2 | 90.4 | 6.3 |
| Proportion of myo-IP6 to total phosphomonoesters | % | 12.0 | 1.0 | 23.0 | 9.0 | 23.0 | 4.0 |
| Broad peak | mg P per kgsoil | 21.6 | 30.9 | 186.0 | 305.8 | 216.7 | 110.3 |
| Proportion of broad peak to total phosphomonoesters | % | 59.0 | 79.0 | 53.0 | 61.0 | 54.0 | 78.0 |
4. Discussion
4.1. Extractability of soil organic P and solution 31P NMR spectra
Concentrations of Porg in NaOH-EDTA extracts were similar to reported values in previous studies.19,37 The difference between total soil P as measured by XRF and NaOH-EDTA extractable P is likely due to Pinorg held within mineral silicates and other insoluble mineral phases containing P.40 Organic P extracted with the NaOH-EDTA technique is strongly correlated to pools of soil Porg.40 The extraction method allows for detailed characterization of Porg forms using 31P NMR spectroscopy.8 Solution 31P NMR spectra were highly resolved and exhibited a high signal-to-noise ratio across all samples. The broad classes of P detected by NMR across all soils were phosphonates, orthophosphate, phosphomonoesters, phosphodiesters and pyrophosphate, except for the absence of phosphonates in S5 and phosphodiesters in S2. Their distribution within the total NMR signal is consistent with previous studies, which typically show the majority of NMR signal occurs in the orthophosphate and phosphomonoester region.14,19,41 The peaks of myo-IP6 were also clearly observed within this region, and therefore allowed for their quantification using SDF.94.2. Recovery of myo-IP6 in soil extracts
Concentrations of added myo-IP6 were overestimated when the SDF procedure did not include a broad signal. The reason for this is likely twofold: (1) the intensities of the myo-IP6 peaks are higher when a broad signal is not included; and (2) the linewidths of these peaks when fitted to the baseline are greater if a broad signal is not included in the SDF compared to that when a broad signal is included. Therefore, the peak area belonging to compounds other than myo-IP6 is being attributed to myo-IP6, which may result in an overestimation of its concentration in soil. This supports the finding of Doolette et al., (2010)15 who reported an overestimation of a phytate spike by 54% when a broad signal was not fitted. Whilst the finding of Doolette et al., (2010)15 was higher than that found in the current study, it is likely due to a greater overlap among sharp peaks in the phosphomonoester region. The authors observed and fitted up to six sharp peaks in the orthophosphate and phosphomonoester region, but the C2 peak of myo-IP6 was not visible because it overlapped with orthophosphate. This was not the case in the current study where all four peaks of myo-IP6 were visible and the C2 peak of myo-IP6 was clearly separated from orthophosphate.Whilst the recovery of added myo-IP6 was generally overestimated using SDF without a broad signal across all soils, this was not the case for soil S3. The reason for this is unclear but might be due to the high proportion of myo-IP6 to total phosphomonoesters in this soil. It might also be due to an underestimation of the side regions at the base of the peak, as the fitting of neighbouring sharp peaks can influence the partitioning of signals within a particular region. In comparison to SDF with a broad signal of this soil, the fitting of side peak areas of myo-IP6 appeared to improve based on a visual assessment, i.e. the peak height was reduced but the linewidth at half height increased. This highlights the sensitivity of peak fitting to small changes in peak shape for the quantification of P species in some soils.
The variability between the two SDF approaches differed in their recovery of added myo-IP6 across all soils, which was least for the SDF approach with a broad signal than that without. The reason for this appears to be the relative proportion of the underlying broad signal to the myo-IP6 peaks among different soils. This is consistent with other compounds that are present within this region, which overlay the broad signal. Doolette et al., (2010)15 reported that concentrations of glycerophosphate were doubled when SDF was carried out without an underlying broad signal. Of course, since myo-IP6 exhibits 4 peaks in a NMR spectrum, this would vary between the individual peaks of myo-IP6, based on differing proportions of an underlying broad signal.
Individual recoveries of the four peaks of myo-IP6 differed. The greatest difference in the recovery of peaks from myo-IP6 occurred when SDF was carried out without a broad signal, which supports that the baseline of the spectra varies within these chemical shifts.9 The C1,3 and C4,6 peaks of myo-IP6 have chemical shifts within the phosphomonoester region where the intensity of the broad peak is high relative to that for the C2 and C5 peaks. However, the recovery of the C5 peak of myo-IP6 at δ 3.61 ppm was generally overestimated more than that of the other myo-IP6 peaks. The C5 peak of myo-IP6 is present on the shoulder of the broad signal, which has a maximum intensity at about δ 4.06 ppm. Doolette and Smernik (2015)9 hypothesized that fitting peaks from the peak maxima to the baseline would result in substantially more signal from an underlying broad peak to the C5 peak of myo-IP6 compared to the C2 peak of myo-IP6. Moreover, the C5 peak appears to be most sensitive to changes in the fitting procedures, as it shows the highest variation for both deconvolution approaches. Another source of variation in the quantification of the C5 peak is that it overlaps with the base of the upfield C4,6 peak of myo-IP6, and possibly peaks from uridine-2′-monophosphate, adenosine-2′-diphosphate, and some unidentified compounds.33 There is also evidence that the broad peak itself is comprised of more than one component,9,13 which may result in an imperfect Lorentzian/Gaussian distribution within the phosphomonoester region. Nevertheless, our study shows that the quantification of myo-IP6 using SDF with a broad signal generally results in measures of myo-IP6 that are more accurate and consistent across a diversity of soils compared to that of SDF without a broad signal.
The comparison of the peak ratios to the theoretical value of 1:2:2:1 was used in previous studies to evaluate the accuracy of the applied SDF procedure.42 In our study, the peak ratios of myo-IP6 were similar between the two SDF approaches and close to the theoretical ratio of 1:2:2:1.43 Therefore, the ratio of peaks from myo-IP6 cannot be used to assess the efficacy of the SDF for accurate quantification of organic P compounds. Since the peak ratios of myo-IP6 were not a useful assessment of the SDF approaches, it is likely that other organic P compounds exhibiting sharp signals may provide some insight on the validity of the SDF approach. In particular, an overestimation would be likely for the C2,5 peak of neo-IP6 in the 4-eq/2-ax conformation,3 since its chemical shift is present in the region of the broad peak. Whereas the C1,3,4,6 peak of neo-IP6 is located upfield of the orthophosphate peak and therefore does not overlap with the broad signal. We identified both of these peaks (δ 5.92 and 3.78 ppm) through spiking in soils S3, S4, S5 and S6 (data not shown), calculated their ratios, and compared to the theoretical ratio of 4:2.3 Calculated ratios were on average 4.0:6.2 when carrying out SDF without a broad signal and 4.0:1.5 with an underlying broad signal. These results provide supporting evidence that a broad signal should be included when carrying out SDF.
In the current study, there was a large number of sharp peaks detected in the phosphomonoester region, which was likely due to optimized extraction techniques and high resolution NMR.8 Interestingly, the intensity of several unidentified sharp peaks increased when the myo-IP6 standard was added (Fig. 2). The myo-IP6 standard contained many phosphomonoester impurities (see Fig. SI-2 in the ESI†), which are likely those of lower order myo-IPs.44 Doolette and Smernik (2018)44 investigated the chemical composition of a variety of purchased or synthesized phytate standards using solution 31P NMR spectroscopy. The authors found that the majority of phytate standards were impure and contained a mixture of lower- (and higher-) order IP, and orthophosphate. The authors suggested that thermal degradation during storage was the primary mechanisms in the degradation of higher-order IP to lower-order IP. This suggests the presence of lower order IP in soil extracts that could be detected using solution 31P NMR spectroscopy.
4.3. Concentrations of myo-IP6 (and the broad signal) in soil
Our results demonstrate that a quantitative determination of myo-IP6 in soil extracts using solution 31P NMR spectroscopy requires SDF procedures that include an underlying broad signal. In the current study, concentrations of myo-IP6 and their proportion to the total pool of Porg in soil were generally in range or lower than that more broadly reported in the literature. This most likely reflects the majority of published studies that primarily carry out SDF without a broad signal. Clearly, pools of myo-IP6 in soil are an important portion of the soil Porg, which are found in the majority of soils across the world.45 However, they do not account for the majority of Porg in soil and sometimes found at negligible concentrations in some soils.46–48The largest pool of soil Porg was that of the broad signal across all soils. This is consistent with previous studies, where it generally comprises 40–70% of the total Porg in soil.14,16,19 The exact chemical nature of this pool remains unclear but can be described as phosphomonoesters in the form of large molecular structures,14 which contain pools of Porg resistant to enzymatic hydrolysis,19 associated with humic fractions,49 and are structurally complex.13 The presence of a broad peak is consistent with previous studies using non-NMR techniques that report a large proportion of the Porg in soil is unresolved and can occur in large molecular weight fractions.2,28,48,50
5. Conclusion
myo-Inositol hexakisphosphate is an important pool of soil organic P. However, its accurate quantification using solution 31P NMR spectroscopy followed by SDF is uncertain. Our aim was to compare the recovery of added myo-IP6 using two SDF procedures in NMR spectra on soil extracts. The average recovery of total added myo-IP6 by SDF with a broad signal was close to 100% and exhibited less variation than that by SDF without a broad signal. The recovery of individual peaks of myo-IP6 differed between its four peaks, which was overestimated for the C5 phosphate peak by up to 140% when a broad peak was not fitted. We recommend that the accurate quantification of myo-IP6 using solution 31P NMR spectroscopy on soil extracts includes a broad signal when carrying out SDF. This is also relevant for other sharp signals in the phosphomonoester region, which overlay the broad signal. Furthermore, our results show that previous studies reporting concentrations of myo-IP6 using SDF without an underlying broad signal may be unreliable. It is essential that pools of myo-IP6 (and the broad signal) are accurately determined for an improved understanding of the abundance and cycling of organic P in soil.Conflicts of interest
There are no conflicts of interest to declare.Acknowledgements
The authors kindly thank Dr Laurie Paule Mauclaire Schönholzer, Dr Federica Tamburini, Mr Björn Studer, Ms Monika Macsai, and Dr Charles Brearley for their technical support. Furthermore, the authors are grateful to Dr Astrid Oberson, Dr David Lester, Dr Chiara Pistocchi and Dr Gregor Meyer for providing soil samples. The authors are very thankful for the use of the D-chiro- and neo-IP6 standards originating from the Dr Dennis Cosgrove collection and the Dr Max Tate collection, respectively. Funding from the Swiss National Science Foundation [grant number 200021_169256] is gratefully acknowledged.References
- G. Anderson, in The role of phosphorus in agriculture, ed. F. E. Khasawneh, E. C. Sample and E. J. Kamprath, American Society of Agronomy, Crop Science Society of America, Soil Science Society of America, Madison, WI, 1980, pp. 411–431, DOI:10.2134/1980.roleofphosphorus.c16.
- H. F. Harrison, Soil organic phosphorus a review of world literature, CAB International, Wallingford, 1987 Search PubMed.
- B. L. Turner, A. W. Cheesman, H. Y. Godage, A. M. Riley and B. V. Potter, Determination of neo- and D-chiro-inositol hexakisphosphate in soils by solution 31P NMR spectroscopy, Environ. Sci. Technol., 2012, 46, 4994–5002 CrossRef CAS PubMed.
- G. C. J. Irving and D. J. Cosgrove, The use of gas-liquid chromatography to determine the proportions of inositol isomers present as pentakis- and hexakisphosphates in alkaline extracts of soils, Commun. Soil Sci. Plant Anal., 1982, 13, 957–967 CrossRef CAS.
- T. I. McLaren, R. J. Smernik, M. J. McLaughlin, A. L. Doolette, A. E. Richardson and E. Frossard, in Advances in Agronomy, ed. D. L. Sparks, Academic Press, 2020, vol. 160, pp. 51–124 Search PubMed.
- M. Ognalaga, E. Frossard and F. Thomas, Glucose-1-phosphate and myo-inositol hexaphosphate adsorption mechanisms on goethite, Soil Sci. Soc. Am. J., 1994, 58, 332–337 CrossRef CAS.
- R. H. Newman and K. R. Tate, Soil phosphorus characterisation by 31P nuclear magnetic resonance, Commun. Soil Sci. Plant Anal., 1980, 11, 835–842 CrossRef CAS.
- B. Cade-Menun and C. W. Liu, Solution phosphorus-31 nuclear magnetic resonance spectroscopy of soils from 2005 to 2013: a review of sample preparation and experimental parameters, Soil Sci. Soc. Am. J., 2014, 78, 19–37 CrossRef.
- A. L. Doolette and R. J. Smernik, Quantitative analysis of 31P NMR spectra of soil extracts – dealing with overlap of broad and sharp signals, Magn. Reson. Chem., 2015, 53, 679–685 CrossRef CAS PubMed.
- B. L. Turner, N. Mahieu and L. M. Condron, Quantification of myo-inositol hexakisphosphate in alkaline soil extracts by solution 31P spectroscopy and spectral deconvolution, Soil Sci., 2003, 168, 469–478 CAS.
- J. E. Hill and B. J. Cade-Menun, Phosphorus-31 nuclear magnetic resonance spectroscopy transect study of poultry operations on the Delmarva Peninsula, J. Environ. Qual., 2009, 38, 130–138 CrossRef CAS PubMed.
- E. K. Bünemann, R. J. Smernik, P. Marschner and A. M. McNeill, Microbial synthesis of organic and condensed forms of phosphorus in acid and calcareous soils, Soil Biol. Biochem., 2008, 40, 932–946 CrossRef.
- T. I. McLaren, R. Verel and E. Frossard, The structural composition of soil phosphomonoesters as determined by solution 31P NMR spectroscopy and transverse relaxation (T2) experiments, Geoderma, 2019, 345, 31–37 CrossRef CAS.
- T. I. McLaren, R. J. Smernik, M. J. McLaughlin, T. M. McBeath, J. K. Kirby, R. J. Simpson, C. N. Guppy, A. L. Doolette and A. E. Richardson, Complex forms of soil organic phosphorus – a major component of soil phosphorus, Environ. Sci. Technol., 2015, 49, 13238–13245 CrossRef CAS PubMed.
- A. L. Doolette, R. J. Smernik and W. J. Dougherty, Rapid decomposition of phytate applied to a calcareous soil demonstrated by a solution 31P NMR study, Eur. J. Soil Sci., 2010, 61, 563–575 CrossRef CAS.
- A. L. Doolette, R. J. Smernik and W. J. Dougherty, Overestimation of the importance of phytate in NaOH-EDTA soil extracts as assessed by 31P NMR analyses, Org. Geochem., 2011, 42, 955–964 CrossRef CAS.
- E. K. Bünemann, R. J. Smernik, A. L. Doolette, P. Marschner, R. Stonor, S. A. Wakelin and A. M. McNeill, Forms of phosphorus in bacteria and fungi isolated from two Australian soils, Soil Biol. Biochem., 2008, 40, 1908–1915 CrossRef.
- S. R. Noack, M. J. McLaughlin, R. J. Smernik, T. M. McBeath and R. D. Armstrong, Crop residue phosphorus: speciation and potential bio-availability, Plant Soil, 2012, 359, 375–385 CrossRef CAS.
- K. A. Jarosch, A. L. Doolette, R. J. Smernik, F. Tamburini, E. Frossard and E. K. Bünemann, Characterisation of soil organic phosphorus in NaOH-EDTA extracts: a comparison of 31P NMR spectroscopy and enzyme addition assays, Soil Biol. Biochem., 2015, 91, 298–309 CrossRef CAS.
- FAO and I. W. Group, World reference base for soil resources 2014, Food and Agriculture Organization of the United Nations FAO, Rome, 2014 Search PubMed.
- S. Bühler, A. Oberson, S. Sinaj, D. K. Friesen and E. Frossard, Isotope methods for assessing plant available phosphorus in acid tropical soils, Eur. J. Soil Sci., 2003, 54, 605–616 CrossRef.
- E. K. Bünemann, S. Augstburger and E. Frossard, Dominance of either physicochemical or biological phosphorus cycling processes in temperate forest soils of contrasting phosphate availability, Soil Biol. Biochem., 2016, 101, 85–95 CrossRef.
- G. Meyer, E. K. Bünemann, E. Frossard, M. Maurhofer, P. Mäder and A. Oberson, Gross phosphorus fluxes in a calcareous soil inoculated with Pseudomonas protegens CHA0 revealed by 33P isotopic dilution, Soil Biol. Biochem., 2017, 104, 81–94 CrossRef CAS.
- W. M. H. Saunders and E. G. Williams, Observation on the determination of total organic phosphorus in soils, J. Soil Sci., 1955, 6, 254–267 CrossRef CAS.
- S. Kuo, in Methods of soil analysis part 3—Chemical methods, ed. D. L. Sparks, A. L. Page, P. A. Helmke and R. H. Loeppert, Soil Science Society of America, American Society of Agronomy, Madison, WI, 1996, pp. 869–919, DOI:10.2136/sssabookser5.3.c32.
- B. J. Cade-Menun, C. W. Liu, R. Nunlist and J. G. McColl, Soil and litter phosphorus-31 nuclear magnetic resonance spectroscopy, J. Environ. Qual., 2002, 31, 457–465 CAS.
- T. Ohno and L. M. Zibilske, Determination of low concentrations of phosphorus in soil extracts using malachite green, Soil Sci. Soc. Am. J., 1991, 55, 892–895 CrossRef CAS.
- R. A. Bowman and J. O. Moir, Basic EDTA as an extractant for soil organic phosphorus, Soil Sci. Soc. Am. J., 1993, 57, 1516–1518 CrossRef CAS.
- M. D. R. Vaz, A. C. Edwards, C. A. Shand and M. Cresser, Determination of dissolved organic phosphorus in soil solutions by an improved automated photo-oxidation procedure, Talanta, 1992, 39, 1479–1487 CrossRef CAS PubMed.
- A. G. Vincent, J. Vestergren, G. Gröbner, P. Persson, J. Schleucher and R. Giesler, Soil organic phosphorus transformations in a boreal forest chronosequence, Plant Soil, 2013, 367, 149–162 CrossRef CAS.
- A. V. Spain, M. Tibbett, M. Ridd and T. I. McLaren, Phosphorus dynamics in a tropical forest soil restored after strip mining, Plant Soil, 2018, 427, 105–123 CrossRef CAS.
- A. L. Doolette, R. J. Smernik and W. J. Dougherty, Spiking improved solution phosphorus-31 nuclear magnetic resonance identification of soil phosphorus compounds, Soil Sci. Soc. Am. J., 2009, 73, 919–927 CrossRef CAS.
- J. Vestergren, A. G. Vincent, M. Jansson, P. Persson, U. Ilstedt, G. Gröbner, R. Giesler and J. Schleucher, High-resolution characterization of organic phosphorus in soil extracts using 2D 1H–31P NMR correlation spectroscopy, Environ. Sci. Technol., 2012, 46, 3950–3956 CrossRef CAS PubMed.
- M. I. Makarov, L. Haumaier and W. Zech, Nature of soil organic phosphorus: an assessment of peak assignments in the diester region of 31P NMR spectra, Soil Biol. Biochem., 2002, 34, 1467–1477 CrossRef CAS.
- B. L. Turner, N. Mahieu and L. M. Condron, Phosphorus-31 nuclear magnetic resonance spectral assignments of phosphorus compounds in soil NaOH-EDTA extracts, Soil Sci. Soc. Am. J., 2003, 67, 497–510 CrossRef CAS.
- R. L. Vold, J. S. Waugh, M. P. Klein and D. E. Phelps, Measurement of spin relaxation in complex systems, J. Chem. Phys., 1968, 48, 3831–3832 CrossRef CAS.
- B. L. Turner, Soil organic phosphorus in tropical forests: an assessment of the NaOH-EDTA extraction procedure for quantitative analysis by solution 31P NMR spectroscopy, Eur. J. Soil Sci., 2008, 59, 453–466 CrossRef CAS.
- B. L. Turner, N. Mahieu and L. M. Condron, The phosphorus composition of temperate pasture soils determined by NaOH-EDTA extraction and solution 31P NMR spectroscopy, Org. Geochem., 2003, 34, 1199–1210 CrossRef CAS.
- W. J. Dougherty, R. J. Smernik and D. J. Chittleborough, Application of spin counting to the solid-state 31P NMR analysis of pasture soils with varying phosphorus content, Soil Sci. Soc. Am. J., 2005, 69, 2058–2070 CrossRef CAS.
- T. I. McLaren, R. J. Simpson, M. J. McLaughlin, R. J. Smernik, T. M. McBeath, C. N. Guppy and A. E. Richardson, An assessment of various measures of soil phosphorus and the net accumulation of phosphorus in fertilized soils under pasture, J. Plant Nutr. Soil Sci., 2015, 178, 543–554 CrossRef CAS.
- A. L. Doolette, R. J. Smernik and W. J. Dougherty, A quantitative assessment of phosphorus forms in some Australian soils, Soil Res., 2011, 49, 152–165 CrossRef CAS.
- A. G. Vincent, J. Schleucher, G. Gröbner, J. Vestergren, P. Persson, M. Jansson and R. Giesler, Changes in organic phosphorus composition in boreal forest humus soils: the role of iron and aluminium, Biogeochemistry, 2012, 108, 485–499 CrossRef CAS.
- A. J. R. Costello, T. Glonek and T. C. Myers, 31P nuclear magnetic resonance-pH titrations of myo-inositol hexaphosphate, Carbohydr. Res., 1976, 46, 159–171 CrossRef CAS PubMed.
- A. L. Doolette and R. J. Smernik, Facile decomposition of phytate in the solid-state: kinetics and decomposition pathways, Phosphorus, Sulfur, Silicon Relat. Elem., 2018, 193, 192–199 CrossRef CAS.
- B. L. Turner, M. J. Papházy, P. M. Haygarth and I. D. McKelvie, Inositol phosphates in the environment, Philos. Trans. R. Soc. Lond. Ser. B Biol. Sci., 2002, 357, 449 CrossRef CAS PubMed.
- B. L. Turner, Organic phosphorus in Madagascan rice soils, Geoderma, 2006, 136, 279–288 CrossRef CAS.
- C. Williams and G. Anderson, Inositol phosphates in some Australian soils, Soil Res., 1968, 6, 121–130 CrossRef CAS.
- J. H. Steward and M. E. Tate, Gel chromatography of soil organic phosphorus, J. Chromatogr. A, 1971, 60, 75–82 CrossRef CAS.
- Z. He, D. C. Olk and B. J. Cade-Menun, Forms and lability of phosphorus in humic acid fractions of Hord silt loam soil, Soil Sci. Soc. Am. J., 2011, 75, 1712–1722 CrossRef CAS.
- R. C. Dalai, in Advances in Agronomy, ed. N. C. Brady, Academic Press, 1977, vol. 29, pp. 83–117 Search PubMed.
Footnote |
| † Electronic supplementary information (ESI) available. See DOI: 10.1039/c9em00485h |
| This journal is © The Royal Society of Chemistry 2020 |