 Open Access Article
Creative Commons Attribution 3.0 Unported Licence
Enhanced surface area and reduced pore collapse of methylated, imine-linked covalent organic frameworks†
Ellen
Dautzenberg
 a,
Milena
Lam
 a,
Guanna
Li
 ab and
Louis C. P. M.
de Smet
 *a
*a
aLaboratory of Organic Chemistry, Wageningen University, Stippeneng 4, 6708WE Wageningen, The Netherlands. E-mail: louis.desmet@wur.nl
bBiobased Chemistry and Technology, Wageningen University, Bornse Weilanden 9, 6708WG Wageningen, The Netherlands
First published on 9th November 2021
Abstract
Covalent Organic Frameworks (COFs) are thermally and chemically stable, nanoporous materials with high surface areas, making them interesting for a large variety of applications including energy storage, gas separation, catalysis and chemical sensing. However, pore blocking and pore collapse may limit their performance. Reducing the capillary forces by using solvents with low surface tension, like supercritical CO2, for activation, and the introduction of bulky isopropyl/methoxy groups were found to reduce pore collapse. Herein, we present an easy-to-use alternative that involves the combination of a new, methylated building block (2,4,6-trimethylbenzene-1,3,5-tricarbaldehyde, Me3TFB) with vacuum drying. Condensation of Me3TFB with 1,4-phenylenediamine (PA) or benzidine (BD) resulted in imine-linked 2D COFs (Me3TFB-PA and Me3TFB-BD) with higher degrees of crystallinity and higher BET surface areas compared to their non-methylated counterparts (TFB-PA and TFB-BD). This was rationalized by density functional theory computations. Additionally, the methylated COFs are less prone to pore collapse when subjected to vacuum drying and their BET surface area was found to remain stable for at least four weeks. Within the context of their applicability as sensors, we also studied the influence of hydrochloric acid vapour on the optical and structural properties of all COFs. Upon acid exposure their colour and absorbance spectra changed, making them indeed suitable for acid detection. Infrared spectroscopy revealed that the colour change is likely attributed to the cleavage of imine bonds, which are only partially restored after ammonia exposure. While this limits their application as reusable sensors, our work presents a facile method to increase the robustness of commonly known COFs.
Introduction
Covalent Organic Frameworks (COFs) are a class of nanoporous materials first discovered in 2005 by Yaghi and co-workers.1 Since then, COFs have gained increasingly more interest and a huge variety of different materials and applications have been reported.2,3 COFs consist of fully organic building blocks linked by dynamic covalent chemistry.4,5 Dynamic covalent chemistry refers to reversible reactions carried out under thermodynamic reaction conditions. This enables error correction, leading to crystalline frameworks with a long-range order. The symmetry of the building blocks is determining the crystal structure. In the case of 2D COFs, the third dimension is formed by π–π stacking. The layers usually stack in an eclipsed structure leading to channels in the framework, which results in high surface areas. These high surface areas are of interest for, amongst others, energy storage, gas separation, catalysis, and chemical sensing.3,6–8 The variability in organic building blocks in terms of functional groups or symmetry allow a high control over the COF properties and thus leads to tailor-made materials. However, the boronic esters used to make the first COFs were susceptible to hydrolysis. This has been improved by using imine-linked COFs or even more stable β-ketoenamine COFs. The latter first forms imine bonds, which then tautomerise irreversibly into the β-ketoenamine linkage. The irreversible tautomerisation results in a lower crystallinity and surface area compared to their imine counterparts.2 The chemical stability of COFs does not only depend on the type of linking chemistry, but can also be affected by the nature of the core of the organic building blocks. Ma et al.9 reported two highly porous 3D COFs of terephthalaldehyde or 4,4′-biphenyldicarboxaldehyde and a tetrahedral amine with isopropyl groups in ortho position. Isopropyl groups are hydrophobic and their steric demand protects the imine groups from hydrolysis. The COFs are reported to be stable in acidic and strong alkaline solutions without a decrease in surface area and crystallinity. Such stability was also achieved by methoxy substitution of the aldehyde node.10 In another study, Wang et al.11 reported enhanced BET surface areas for ortho methoxy-substituted aldehyde nodes and meta methyl-substituted amine linkers.COF stability is not only about the chemical stability of the functional groups involved, but also about the stability of the physical properties such as pore size, pore shape and surface area. It has been identified that the conditions for work-up and COF activation are crucial to get accessible pores and high surface areas. After synthesis, COFs are most commonly washed with several solvents to remove impurities and water from the pores prior to drying. Vacuum drying has often been used, but was identified to induce partial pore collapse due to capillary forces.12 Capillary forces increase with decreasing pore size and COFs with typical pore sizes around a few nanometres are therefore subjected to strong capillary forces. To overcome pore collapse, milder activation methods such as supercritical CO2 drying12 or washing with ultra-low surface tension solvents prior to drying13 were suggested to keep the framework intact upon activation. Feriante et al.12 and Zhu et al.13 both reported methoxy-functionalised, imine-based COFs, which were less prone to pore collapse compared to the non-methoxylated equivalent.
In the current paper, we introduce methyl groups in the synthesis of imine-based COFs as alternative to the bulky isopropyl and the smaller methoxy groups. Depending on the COF application, the use of this smaller – but still hydrophobic – group can be advantageous as it has less impact on the pore size.
Herein, we present 2,4,6-trimethylbenzene-1,3,5-tricarb-aldehyde (Me3TFB) as building block for two novel COFs, namely Me3TFB-PA and Me3TFB-BD, which are compared with two reference COFs TFB-PA6 and TFB-BD.14,15 The methylation significantly increases the BET surface area by a factor of 1.8 and 1.4, respectively. The physical stability of the framework towards pore collapse during vacuum activation also profits from the methylation. This work shows a facile approach in stabilizing COFs by methylating the aldehyde. The novel COFs maintain their high surface area on the bench for at least four weeks. Finally, the effect of acid vapour on the optical and structural properties of the COFs was studied.
Results and discussion
Synthetic procedures
1,3,5-Benzenetricarbaldehyde (TFB) and 2,4,6-trimethyl-benzene-1,3,5-tricarbaldehyde (Me3TFB) were condensed with two different amines, namely 1,4-phenylenediamine (PA) and benzidine (BD) (Scheme 1) to yield the novel 2D imine-linked COFs (Me3TFB-PA and Me3TFB-BD) and their non-methylated equivalents (TFB-PA and TFB-BD). Each COF has been synthesised and characterised thrice. We selected this set of COFs, because TFB-PA and TFB-BD have been widely studied in literature.6,14–16 The synthesis was carried out at 70 °C and atmospheric pressure with acetic acid as catalyst and water to enhance dynamic covalent chemistry in a mixture of mesitylene : 1,4-dioxane 1![[thin space (1/6-em)]](https://www.rsc.org/images/entities/char_2009.gif) :
:![[thin space (1/6-em)]](https://www.rsc.org/images/entities/char_2009.gif) 4 v/v for three days.17 A washing protocol from Vitaku et al. has been used for the work-up.18 Afterwards, half of the obtained powder was dried overnight in a vacuum-oven at 120 °C and the other half at 120 °C in a regular, air-ventilated oven before the COFs were characterised. The characterisation for the reference COFs can be found in the ESI (Fig. S1, S2, S5, S6, S9 and S10†).
4 v/v for three days.17 A washing protocol from Vitaku et al. has been used for the work-up.18 Afterwards, half of the obtained powder was dried overnight in a vacuum-oven at 120 °C and the other half at 120 °C in a regular, air-ventilated oven before the COFs were characterised. The characterisation for the reference COFs can be found in the ESI (Fig. S1, S2, S5, S6, S9 and S10†).
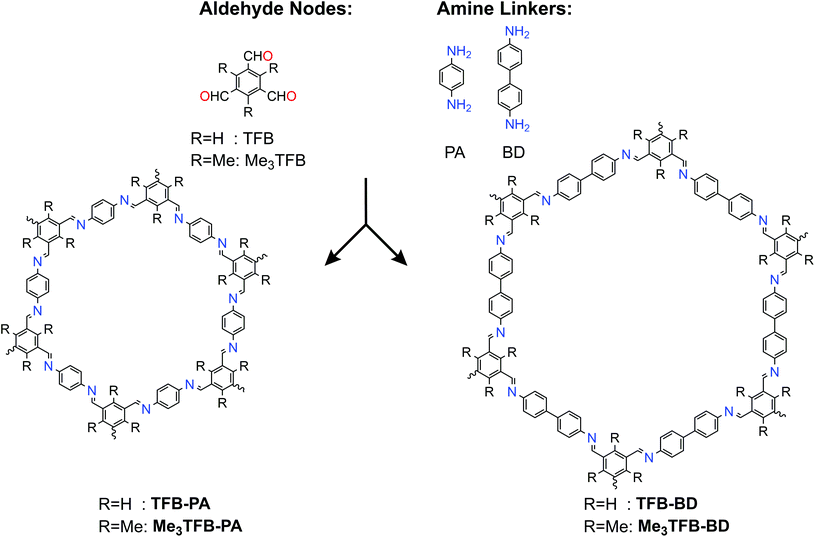 | ||
| Scheme 1 Different aldehyde and amine building blocks used for introducing methyl groups in COFs and their resulting structures. | ||
Characterisation
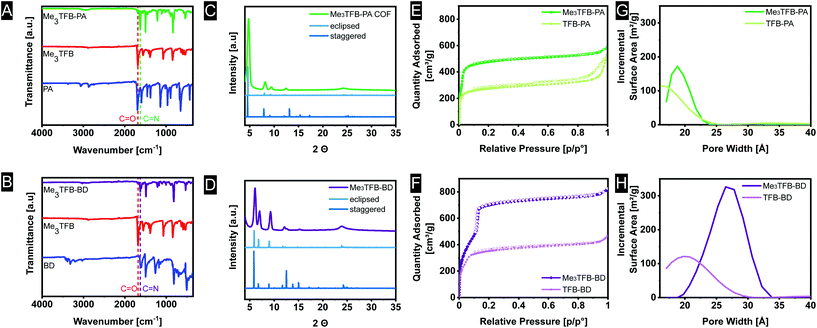
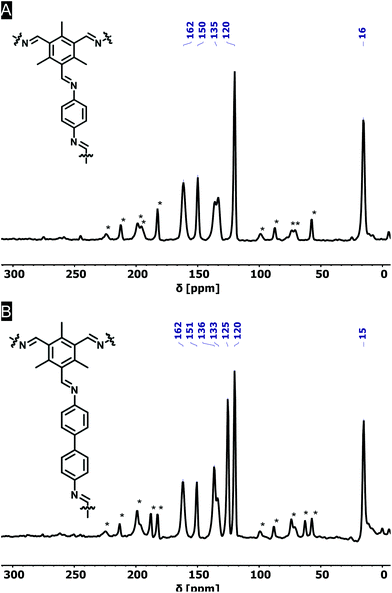
FT-IR spectroscopy on the novel COFs confirmed the formation of imine bonds (Fig. 1A). Me3TFB-PA shows a characteristic imine stretch at 1623 cm−1, demonstrating a successful reaction. A weak band at 1693 cm−1 indicates low fractions of aldehyde bonds. This IR characteristic has also been reported by others and may origin from unreacted side-groups at the outside of the 2D polymeric sheet.12,13,19The formation of imine bonds was also confirmed by 13C cross-polarization magic angle spinning solid-state NMR (13C CPMAS ssNMR) (Fig. 2A) as the signal at 162 ppm is typical for imine carbons. The signal at 194 ppm points to aldehyde carbons, but compared to the starting compound this is strongly attenuated and just the above noise level.
Comparable FT-IR results can be found for Me3TFB-BD COF with an imine band at 1627 cm−1 and a small carbonyl stretch at 1693 cm−1 (Fig. 1B). Again, an ssNMR signal at 162 ppm confirms the formation of an imine (Fig. 2B). All FT-IR spectra of the triplicates can be found in the ESI (Fig. S3 and S4†).
Thermogravimetric analysis revealed that Me3TFB-PA is thermally stable up to 355 °C and Me3TFB-BD up to 390 °C (ESI Fig. S15†), which is in line with several previously reported imine-linked COFs.6,14,20,21
Powder X-Ray Diffraction (PXRD) was performed on all samples to determine the crystallinity of the materials. The obtained spectra were compared to the simulated diffraction patterns of optimized crystal structures obtained from density-functional theory (DFT) calculations (coordinates in ESI†). Me3TFB-PA COF displays several diffraction peaks, which are clearly baseline separated from each other at 4.8°, 8.2°, 9.4°, 12.5° and a broader signal around 24° (Fig. 1C). Two different stacking structures have been computed for comparison: an eclipsed and a staggered structure. Comparing peak positions and relative intensities of the peaks, it can be concluded that Me3TFB-PA COF crystallises in an eclipsed stacking conformation. For all three samples, Scherrer analysis was performed and gave an estimated average domain size of 15.1 ± 1.5 nm. The PXRD spectrum of Me3TFB-BD COF also shows several narrow diffraction peaks, especially at low angles: 3.6°, 6.1° 7.0°, 9.3°, 12.1°, 12.6°, 15.3° (Fig. 1D). The peak at 3.6° was confirmed by a second low-angle PXRD measurement with different settings, which only scanned angles from 1.5–10° to be able to detect signals in this low-angle region without detecting the source. The spectrum can be found in the ESI (Fig. S8†) as well as the low-angle spectrum of Me3TFB-PA (ESI Fig. S7†). Scherrer analysis for this sample results in an approximate domain size of 20.5 ± 2.1 nm. Comparison with the computed PXRD diffraction patterns leads again to a preferred eclipsed stacking.
BET surface area
Nitrogen sorption measurements were carried out to determine the surface area of the COFs (ESI Fig. S11–S14†). For Me3TFB-PA, the adsorption–desorption isotherm can be classified as a type I isotherm (Fig. 1E).22 This is characteristic for microporous materials of which most of the surface area is internal surface area within the framework. The micropores lead to rapid pore filling at low pressures and a nearly horizontal plateau with increasing relative pressures. Also TFB-PA yields a type I isotherm, including an H4 hysteresis loop, which is absent for Me3TFB-PA. Hysteresis loops can be a result of capillary condensation and/or pore blocking.23 The pore volume was determined in the adsorption branch at p/p0 = 0.95, yielding a value of 0.88 ± 0.04 cm3 g−1. The BET surface area (SBET) was calculated using the Rouquerol criteria24 to apply the BET theory to microporous materials. For all samples of the same COF, the same pressure range was used for the linear regression. Afterwards, the obtained BET surface areas were averaged. For Me3TFB-PA SBET was found to be 1877 ± 20 m2 g−1. To determine the pore size distribution, HS-2D-NLDFT analysis was carried out using the isotherm data and a model with cylindrical micropores for carbon surfaces with N2. Me3TFB-PA COF shows a narrow pore size distribution with a clear maximum at 1.9 nm (Fig. 1G). The pore size is slightly larger compared to TFB-PA, which exhibits a broader pore size distribution with only one maximum at 1.7 nm.Me3TFB-BD COF on the other hand, has a type IVb isotherm (Fig. 1F). The microporosity is shown by a large adsorption of nitrogen in the low pressure range (p/p0 < 0.1). The step in the isotherm at p/p0 = 0.1 indicates capillary condensation. The lack of hysteresis is in line with the cylindrical shape of the pores.22 The pore volume at p/p0 = 0.95 and BET surface areas were measured to be 1.24 ± 0.03 cm3 g−1 and 2115 ± 50 m2 g−1, respectively, while the pore size distribution has a narrow maximum at 2.7 nm (Fig. 1H). With this analysis, where the Rouquerol criteria24 were prioritised, R2 values in the range of 0.996–0.997 were found for the benzidine COFs. The same HS-2D-NLDFT model has been used for the pore size distribution calculation again. Comparing the pore size distribution of Me3TFB-BD with the pore size distribution of the non-methylated TFB, which shows a pore size of 2.1 nm, results again in a larger pore size for the methylated COF.
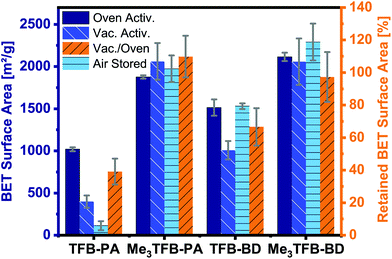
By comparing the BET surface area of the methylated COFs with their non-methylated equivalents after oven activation, it can be clearly seen that the methylated aldehyde building block significantly increases the BET surface area (Fig. 3). The methylated building block increases the BET surface area by a factor of 1.8 and 1.4 for TFB-PA and TFB-BD, respectively. We would have expected that two ortho methyl groups would sterically hinder the reaction, which would have resulted in lower BET surface areas. Therefore, we used theoretical modelling to further study this increase in BET surface area. The crystal structures of DFT optimization reveal the C3 symmetric incorporation of the aldehyde building block into the framework (ESI Fig. S16 and S17†). Additionally, TFB and Me3TFB were geometry optimized by DFT calculations and the rotational barriers for the rotation of the carbonyl groups were modelled (ESI Fig. S18 and S19†). It was found that the methyl groups hinder the full conjugation of the carbonyl groups with the π-system of the aromatic Me3TFB ring, leading to a non-planar structure with lower symmetry compared to TFB. For methylated and non-methylated aldehydes, the resulting rotational energy profiles show two minima with a difference in energy of 4.2 kJ mol−1, which means both conformations can be present in the system at 70 °C during the reaction. The rotational barrier, which has to be overcome to change conformation, is lower for Me3TFB compared to TFB. This is due to the enhanced conjugation and full symmetry in TFB while Me3TFB does not have such a strong conjugation and symmetry. The rotational barrier is hence smaller and the reaction rate for the conformational change is magnitudes higher. This implies that, during COF condensation, favoured C3 symmetric aldehyde conformations are re-formed faster from the CS symmetric conformation for Me3TFB, which is in line with the experimentally found larger domain sizes and higher BET surface areas. Furthermore, to evaluate the effect of methyl groups on the stability of the thus-formed Me3TFB-BD and Me3TFB-PA COF materials, the formation energies all for COFs were calculated according to the reaction formula shown in ESI Fig. S20†, based on the assumption that all aldehyde groups react with all amine groups to form the imine-linked COF. The results (Table S5†) indicate that formation of both Me3TFB-BD and Me3TFB-PA, i.e. the COFs featured with methyl groups on the aldehyde node, are thermodynamically more favourable than their non-methylated counterparts, indicating a higher stability of the methylated COFs compared to the non-methylated COFs.
To study whether the addition of methyl groups also results in a more stable framework, we studied the pore collapse by re-measuring the BET surface area of all COFs after vacuum activation (120 °C, vacuum-oven, overnight). To correct for the difference in BET surface area due to different pore sizes, the retained BET surface area has been calculated as the ratio of the vacuum-activated SBET over the oven-activated SBET, given in area in percentages. Both methylated COFs have a higher BET surface area compared to their non-methylated equivalents (Me3TFB-PA, SBET = 2061 ± 218 m2 g−1; Me3TFB-BD, SBET = 2057 ± 276 m2 g−1; TFB-PA, SBET = 398 ± 72 m2 g−1; TFB-BD, SBET = 1008 ± 109 m2 g−1) after vacuum activation (Fig. 3). The retained BET surface area for TFB-PA is only 39 ± 8%, which means the framework collapses when exposed to vacuum. A comparable trend, though less prominent, can be observed for TFB-BD with a retained SBET of 67 ± 12%. In the case of the methyl-containing COFs, the vacuum activation is qualified as the better method for Me3TFB-PA COF (retained SBET 110 ± 13%), while both activation processes are equally good for Me3TFB-BD (retained SBET 97 ± 15%). In other words, the BET surface areas increase by a factor of 2.8 and 1.4 for Me3TFB-PA and Me3TFB-BD, respectively. The methylated COFs are hence less prone to pore collapse.
In addition, we noticed that the BET surface area of TFB-PA decreases already drastically to 113 ± 53 m2 g−1 in the first four weeks, which means only 11% of the original BET surface area are accessible after one month. Therefore, we investigated the air stability of the other three COFs as well, by leaving the oven-activated samples for four weeks in an open vial on the bench, before determining the BET surface area again. These three COFs did not show such a large drop in the SBET values. Instead, on average a slight increase is observed (up to 8% for Me3TFB-BD), although the differences are within the standard deviation. In any case, as no decrease is observed, we conclude that TFB-BD, Me3TFB-PA, and Me3TFB-BD are stable for the reported conditions. Again, this shows that the introduction of methyl groups stabilizes the phenylenediamine COF.
Acid-vapour sensing
The optical properties of some COFs are reported to respond to changes in acidity and solvent, enabling them to be used as chemical sensors. In more detail, Ascherl et al. observed a solvatochromic effect, which has been visible in diffuse reflectance spectroscopy, before employing the pyrene-containing COF for the development of a humidity sensor.8 Several studies report on COF-based chemosensors for the detection of gaseous hydrochloric acid,25,26 and a series of aqueous Brønsted acids.26,27 Recently, Yang et al. have studied the effect of imine-protonation on the optical properties of three imine-linked COFs. It was found that all COFs showed a bathochromic shift after acid exposure due to the protonation of the imine bond.28 Based on both findings, we looked into the absorption spectra of Me3TFB-PA and Me3TFB-BD and their response towards hydrochloric acid vapour. To this end, samples of the new COFs were pressed as a thin film between two glass plates. Absorption spectra were collected before treatment with acid by measuring the samples in an integrating sphere and collecting diffuse reflectance and diffuse transmission to calculate the absorbance. Both absorbance spectra have an inverse S-curve shape, start absorbing between 400–450 nm, and have absorption edges around 378 nm for Me3TFB-PA and 385 nm for Me3TFB-BD (Fig. 4A and B). To facilitate the comparison between the different samples, the inflection point was used and the first derivative was calculated in Origin to determine the minimum (Fig. 4C and D), which were found to be similar for both COFs (414 nm for Me3TFB-PA and 419 nm for Me3TFB-BD COF).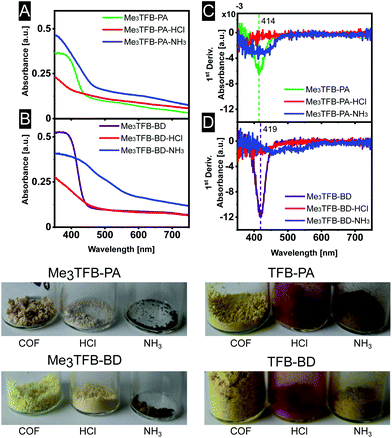 | ||
| Fig. 4 Absorbance spectra (A and B) and their first derivative (C and D) for a better comparison of Me3TFB-PA and Me3TFB-BD, as well as optical photographs of all stages in the sensing process. | ||
As the two-plate configuration does not allow vapour exposure experiments, a new sample was taken from the same synthetic COF batch, which was subjected to hydrochloric acid vapour for 30 minutes. Within minutes, a colour change (paler powder for methylated COFs, red for non-methylated equivalents) was observed by the naked eye (Fig. 4), which was confirmed by an absorbance measurement of the acid-exposed COF sample. The original inverted S-curve was blue shifted and additionally became more stretched for methylated COFs. In comparison, the non-methylated COFs were red shifted, but also stretched.
In order to study the applicability of this interesting property, we investigated whether the COF's response towards hydrochloric acid vapour is reversible by subjecting the acid-exposed material towards ammonia vapour for 30 minutes. Within minutes, another colour change could be observed (Fig. 4), back more towards the original yellow, but going even further to brown. This was the case for both methylated and non-methylated COFs. To study this in more detail, the absorbance was once more measured. The absorbance curve resembles more its original shape for Me3TFB-PA COF, although the first derivative indicates a wider range in which the absorbance changes and the absorption edge is red shifted with respect to the acid-exposed sample. For Me3TFB-BD COF, the spectrum also shifts back to higher wavelength, but even wider. The first derivative indicates two small minima with shifted positions that do not overlap with the original minimum, so the acid has an impact on the COF structure. The absorbance spectra for the non-methylated COFs can be found in the ESI (Fig. S21 and S22†). No change in absorbance could be found for just exposing the samples to ammonia vapour (ESI Fig. S23 and S24†).
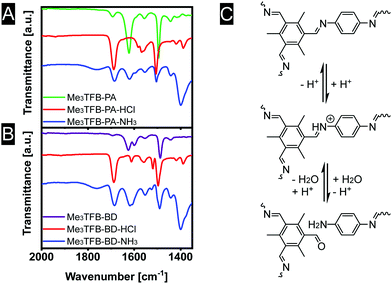
We speculate that the acid protonates the nitrogen atom (Fig. 5C). In a second step, this protonation could lead to a bond cleavage, affecting the COF structure, which is expected to limit the sensor performance. In an attempt to gain insight into the sensing mechanism, FT-IR spectra were recorded in all stages of the sensing process (Fig. 5A and B). Upon exposure to acid vapour the FT-IR spectra do not show any imine stretching vibration anymore. Instead, strongly increased bands at 1688 cm−1 are observed, leading to the conclusion that the exposure of acid breaks down the framework, explaining the observed colour changes of the materials. After exposure towards ammonia, equally strong bands near 1621 cm−1 (imine stretching vibration) and 1685 cm−1 (carbonyl stretching vibration) are visible, indicating a partial recovery of the imine bonds.
Conclusions
In conclusion, a new methyl-substituted aldehyde building block has been used for COF synthesis, resulting in two novel frameworks, namely Me3TFB-PA and Me3TFB-BD. They have been compared with non-methylated reference COFs regarding their BET surface area, pore collapse and their applicability as optical acid sensors. With a facile synthetic approach, which does not require any specialized equipment, we found that methylation of the aldehyde node results in enhanced BET surface areas up to ca. 2000 m2 g−1 and high degrees of crystallinity compared to their non-methylated equivalents. The obtained BET surface areas are comparable to the ones achieved by supercritical CO2 activation. The higher surface areas and crystallinity are in line with DFT-calculated reaction rates. With respect to TFB, Me3TFB loses symmetry and its full conjugation due to the ortho-substituted methyl groups. This leads to a smaller rotation barrier towards the favoured C3 conformation for crystallisation and therefore to higher reaction rates. Additionally, the novel methylated COFs are less prone to pore collapse during vacuum activation and the BET surface area remains stable within at least four weeks.The COFs can be used as an optical sensor to detect hydrochloric acid based on a change in colour. The sensing mechanism reveals that the colour change is likely attributed to the cleavage of the imine bond, which is partially restored after exposure to ammonia vapour. Even though this limits their applicability as a reusable sensor for hydrochloric acid, our approach enables the facile synthesis of high surface area COFs that are more robust compared to commonly known COFs. The effect of ortho-substituted methyl groups of the amine building block and systematically increasing the number of methyl groups on the resulting COF properties are currently under investigation.
Author contributions
L.C.P.M.d.S. and E.D. conceived the project. E.D. and M.L. designed and performed the experiments. G.L. performed the modelling. E.D., M.L. and L.C.P.M.d.S. analysed all data. L.C.P.M.d.S. guided the project. E.D. wrote the first draft, and all authors gave input.Conflicts of interest
There are no conflicts to declare.Acknowledgements
This work was supported by the Dutch Research Council (NWO START-UP Grant, 740.018.004, to LdS). The authors thank Barend van Lagen, Rob Koehorst and Cor Wolfs, Frank Claassen, Julian Engelhardt, and Alyssa van den Boom for technical assistance, and Han Zuilhof and Fedor Miloserdov for fruitful discussions. Harry Bitter is thanked for giving access to nitrogen sorption measurements.References
- A. P. Côté, A. I. Benin, N. W. Ockwig, M. O'Keeffe, A. J. Matzger and O. M. Yaghi, Science, 2005, 310, 1166–1170 CrossRef PubMed.
- S. Kandambeth, K. Dey and R. Banerjee, J. Am. Chem. Soc., 2019, 141, 1807–1822 CrossRef CAS PubMed.
- J. L. Segura, M. J. Mancheño and F. Zamora, Chem. Soc. Rev., 2016, 45, 5635–5671 RSC.
- S. J. Rowan, S. J. Cantrill, G. R. L. Cousins, J. K. M. Sanders and J. F. Stoddart, Angew. Chem., Int. Ed., 2002, 41, 898–952 CrossRef PubMed.
- J. Hu, S. K. Gupta, J. Ozdemir and M. H. Beyzavi, ACS Appl. Nano Mater., 2020, 3, 6239–6269 CrossRef CAS PubMed.
- S.-Y. Ding, J. Gao, Q. Wang, Y. Zhang, W.-G. Song, C.-Y. Su and W. Wang, J. Am. Chem. Soc., 2011, 133, 19816–19822 CrossRef CAS PubMed.
- H. Fan, M. Peng, I. Strauss, A. Mundstock, H. Meng and J. Caro, J. Am. Chem. Soc., 2020, 142, 6872–6877 CrossRef CAS PubMed.
- L. Ascherl, E. W. Evans, M. Hennemann, D. Di Nuzzo, A. G. Hufnagel, M. Beetz, R. H. Friend, T. Clark, T. Bein and F. Auras, Nat. Commun., 2018, 9, 3802 CrossRef PubMed.
- Y. Ma, Y. Wang, H. Li, X. Guan, B. Li, M. Xue, Y. Yan, V. Valtchev, S. Qiu and Q. Fang, Angew. Chem., Int. Ed., 2020, 59, 19633–19638 CrossRef CAS PubMed.
- A. Halder, S. Karak, M. Addicoat, S. Bera, A. Chakraborty, S. H. Kunjattu, P. Pachfule, T. Heine and R. Banerjee, Angew. Chem., Int. Ed., 2018, 57, 5797–5802 CrossRef CAS PubMed.
- Y. Wang, Y. Liu, H. Li, X. Guan, M. Xue, Y. Yan, V. Valtchev, S. Qiu and Q. Fang, J. Am. Chem. Soc., 2020, 142, 3736–3741 CrossRef CAS PubMed.
- C. H. Feriante, S. Jhulki, A. M. Evans, R. R. Dasari, K. Slicker, W. R. Dichtel and S. R. Marder, Adv. Mater., 2020, 32, 1905776 CrossRef CAS PubMed.
- D. Zhu and R. Verduzco, ACS Appl. Mater. Interfaces, 2020, 12, 33121–33127 CrossRef CAS PubMed.
- Y. Yang, D. Deng, S. Zhang, Q. Meng, Z. Li, Z. Wang, H. Sha, R. Faller, Z. Bian, X. Zou, G. Zhu and Y. Yuan, Adv. Mater., 2020, 32, 1908243 CrossRef CAS PubMed.
- L. Bai, S. Z. F. Phua, W. Q. Lim, A. Jana, Z. Luo, H. P. Tham, L. Zhao, Q. Gao and Y. Zhao, Chem. Commun., 2016, 52, 4128–4131 RSC.
- H. Fan, A. Mundstock, A. Feldhoff, A. Knebel, J. Gu, H. Meng and J. Caro, J. Am. Chem. Soc., 2018, 140, 10094–10098 CrossRef CAS PubMed.
- B. J. Smith, A. C. Overholts, N. Hwang and W. R. Dichtel, Chem. Commun., 2016, 52, 3690–3693 RSC.
- E. Vitaku and W. R. Dichtel, J. Am. Chem. Soc., 2017, 139, 12911–12914 CrossRef CAS PubMed.
- B. Zhang, H. Mao, R. Matheu, J. A. Reimer, S. A. Alshmimri, S. Alshihri and O. M. Yaghi, J. Am. Chem. Soc., 2019, 141, 11420–11424 CrossRef CAS PubMed.
- L. Garzón-Tovar, C. Avci-Camur, D. Rodríguez-San-Miguel, I. Imaz, F. Zamora and D. Maspoch, Chem. Commun., 2017, 53, 11372–11375 RSC.
- D. Zhu and R. Verduzco, ACS Appl. Mater. Interfaces, 2020, 12, 33121–33127 CrossRef CAS PubMed.
- M. Thommes, K. Kaneko, A. V. Neimark, J. P. Olivier, F. Rodriguez-Reinoso, J. Rouquerol and K. S. W. Sing, Pure Appl. Chem., 2015, 87, 1051–1069 CAS.
- A. M. Silvestre-Albero, J. M. Juárez-Galán, J. Silvestre-Albero and F. Rodríguez-Reinoso, J. Phys. Chem. C, 2012, 116, 16652–16655 CrossRef CAS.
- G. M. F. Rouquerol, J. Rouquerol, K. S. W. Sing and P. Llewllyn, Adsorption by Powders and Porous Solids, 2014 Search PubMed.
- F.-Z. Cui, J.-J. Xie, S.-Y. Jiang, S.-X. Gan, D.-L. Ma, R.-R. Liang, G.-F. Jiang and X. Zhao, Chem. Commun., 2019, 55, 4550–4553 RSC.
- R. Bu, L. Zhang, X.-Y. Liu, S.-L. Yang, G. Li and E.-Q. Gao, ACS Appl. Mater. Interfaces, 2021, 13, 26431–26440 CrossRef CAS PubMed.
- Z. Chen, K. Wang, X. Hu, P. Shi, Z. Guo and H. Zhan, ACS Appl. Mater. Interfaces, 2021, 13, 1145–1151 CrossRef CAS PubMed.
- J. Yang, A. Acharjya, M.-Y. Ye, J. Rabeah, S. Li, Z. Kochovski, S. Youk, J. Roeser, J. Grüneberg, M. Schwarze, T. Wang, Y. Lu, R. van de Krol, M. Oschatz, R. Schomäcker, P. Saalfrank, A. Thomas and C. Penschke, Angew. Chem., Int. Ed., 2021, 60, 19797–19803 CrossRef CAS PubMed.
Footnote |
| † Electronic supplementary information (ESI) available: Details on materials and instrumentation, synthetic procedures, FT-IR spectra, powder XRD analysis, 13C CPMAS NMR spectra, nitrogen sorption analysis, TGA, DFT modelling, vapor experiments, 1H and 13C spectra of building blocks and MS data. See DOI: 10.1039/d1nr05911d |
| This journal is © The Royal Society of Chemistry 2021 |

