Effect of single electrons on the excited state dynamics of rod-shaped Au25 nanoclusters†
Jie
Kong
 a,
Dayujia
Huo
b,
Jialong
Jie
b,
Yanzhen
Wu
a,
Yan
Wan
a,
Dayujia
Huo
b,
Jialong
Jie
b,
Yanzhen
Wu
a,
Yan
Wan
 b,
Yongbo
Song
 c and
Meng
Zhou
 *a
*a
aHefei National Laboratory for Physical Sciences at the Microscale, University of Science and Technology of China, Hefei, Anhui 230026, China. E-mail: mzhou88@ustc.edu.cn
bCollege of Chemistry, Beijing Normal University, Beijing 100875, China
cSchool of Biomedical Engineering, Research and Engineering Center of Biomedical Materials, Anhui Medical University, Hefei, Anhui 230032, China
First published on 23rd October 2021
Abstract
The excited state dynamics of small-sized metal nanoclusters are dependent on their crystal structures, while the effect of the charge state remains largely unknown. Here, we report the influence of single electrons on the excited-state dynamics of non-superatom Au clusters by comparing the transient absorption isotropy and anisotropy dynamics of two rod-shaped Au25 nanoclusters protected by organic ligands. Two decay lifetimes (0.9 ps and 2.3 μs) can be identified in the excited state relaxation of Au252+ rods, which are assigned to the internal conversion from a higher to lower excited state and the relaxation to the ground state, respectively. With the addition of one electron, an additional 660 ps decay is observed in Au25+, which should originate from the presence of a single electron occupied molecular orbital. Transient anisotropy measurements reveal a 500 ps rotational diffusion process in both the nanoclusters, while the initial dipole moment orientation is found to be highly dependent on the charge state. These results are of importance to understanding the effect of the charge state on the optical properties of metal nanoclusters.
Introduction
Metal nanoclusters (NCs) that bridge nanoparticles and small metal complexes in terms of their structures and electronic properties have attracted broad research interest.1–8 In plasmonic gold and silver nanoparticles, photo-excitation will induce the collective excitation of conduction band electrons, which gives rise to a single surface plasmon resonance peak in their electronic absorption spectra.9,10 Ultra-small gold and silver NCs, on the other hand, exhibit single-exciton transition after photoexcitation, showing multiple peaks in their absorption spectra.7,11 With the advent of atomically precise gold NCs with well-defined crystal structures, it is possible to correlate their optical properties with atomic packing modes.11–14 The excited state dynamics of gold and silver NCs has received intense research interest because it helps to unravel the excited state energy flow and conversion.15–22 Based on a previous study, small sized gold NCs (n < 50) are non-scalable and their optical properties including steady state and excited state behaviours are very sensitive to their structures, compositions, shapes and surface protecting ligands.23 For example, the optical absorption, photoluminescence and photodynamics of spherical-shaped [Au25(SR)18]q NCs are drastically different from those of rod shaped Au25 NCs.24,25 Therefore, it is possible to manipulate their electronic and optical properties via “molecular surgery” on these small-sized metal NCs.26,27According to previous studies, the charge state can also have a significant influence on the electronic properties of Au NCs. Zhu et al. reported that the crystal structure of [Au25(SR)18]− is similar to that of [Au25(SR)18]0 while their optical absorption spectra and magnetism are very different.28,29 Qian et al. demonstrated that the excited state lifetimes of two [Au25(SR)18]q (q = 0, −1) NCs were found to differ by a factor of 103.24 The effect of the valence number on excited state relaxation was also identified for [MAu24(SR)18]q (M stands for foreign atoms other than gold) NCs.30 Lee and co-workers investigated Jahn–Teller distortion on 6-electron [MAu24(SR)18]0 clusters, which gave rise to the splitting of 1P orbitals and narrowing of energy gaps.31 Knappenberger and co-workers illustrated that [Au25(SR)18]q NCs with different charge states show different spin relaxation dynamics.32 The structures and stability of a series of metal NCs can be predicted and explained by using a superatom model, and these NCs have a closed-electron-shell configuration. Superatom theory is used to describe the metal cluster that has a filled spherical electric shell and major energy gap to unoccupied states, wherein the properties of clusters, such as stability, ionization energy, reactivity, etc., should depend on the valence of superatom orbitals.33 The superatom model can well explain the stability of Au NCs with a spherical metal core such as [Au25(SR)18]q, while it is not applicable to those with a non-spherical metal core.34
Rod-shaped [Au25(PPh3)10(SR)5Cl2]2+ (Au25 rod in short) is a typical “non-superatom” nanocluster, which contains 16 valence electrons.35–37 The excited state dynamics of the Au25 rod and its derivatives have been intensively investigated. Solvent dependent dynamics has been reported on the Au25 rod and it exhibits strong near-infrared photoluminescence (PL) with a maximum at 990 nm and the excited state lifetime is as long as 2.3 μs.25,38,39 Silver alloy Au25−xAgx NCs (x > 13) were reported to show very intense PL at around 700 nm (quantum yield, QY, is 40%) and the excited state lifetime is 7.3 μs.40,41 Despite this progress in the understanding of photophysics of the Au25 rod, the effect of the charge state on its excited state dynamics remains largely unknown. Recently, selenolate-capped Au25 rod NCs with different charge states have been reported,42 which allows for a comparative study of the charge state effect on excited state properties.
In this work, we chose two rod-shaped [Au25(PPh3)10(SePh)5Cl2]q (q = +1 and +2) NCs (Au25 I and Au25 II in short, respectively) as model systems to probe the effect of the charge state on the photodynamics of “non-superatom” NCs. Although the Au25 I nanocluster has a smaller energy gap than the Au25 II nanocluster, their nanosecond transient absorption spectra show similar profiles and their lifetimes are comparable. Femtosecond transient absorption isotropy in two Au NCs shows different photodynamics. In Au25 II, the excited state dynamics can be fitted by two decay components (0.9 ps and >1 μs), which is explained by internal conversion from the LUMO+n to the LUMO and the relaxation to the ground state, respectively. In Au25 I, three decay components (0.8 ps, 660 ps, >1 μs) were identified and the 660 ps decay was assigned to an additional decay channel that occurs from the lowest excited state. Transient absorption anisotropy dynamics in both the NCs involves a 500 ps rotational diffusion process, which indicates that the transition moment is aligned along the axis of the rod-shaped nanoclusters. Different anisotropy dynamics can be observed in the initial few picoseconds of two NCs, which suggests that the transition dipole moment of two NCs is highly dependent on the charge state. These results are of great importance to understanding the effect of the charge state on the electronic properties of “non-superatom” gold NCs.
Results and discussion
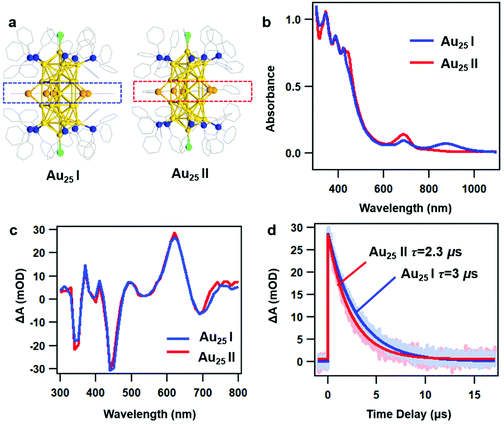
As reported in previous work, the crystal structures of two rod-shaped Au25 NCs are very similar, both consisting of two icosahedral Au13 building blocks by sharing one vertex.42 The major difference between two NCs is the alignment of the benzene rings on Ph–Se ligands (Fig. 1a): in Au25 I, those benzene rings are aligned in the same plane (blue dashed line); in Au25 II, those benzene rings are distorted (red dashed line). Despite very similar crystal structures, different optical absorption spectra were observed for the two NCs (Fig. 1b). Between 300 and 800 nm, the two rod-shaped Au25 NCs exhibit similar UV-vis absorption profiles, with a peak at around 450 nm slightly stronger in Au25 II. Between 800 and 1100 nm, an additional absorption peak at around 870 nm can be observed in Au25 I. Based on steady state absorption, the optical gaps of Au25 I and II are determined to be 1.2 eV and 1.6 eV, respectively (Fig. S1, ESI†). The difference in the optical bandgap can also be supported by recent PL measurements on two NCs, which are centered at around 990 nm (Au25 II) and 1100 nm (Au25 I), respectively.39 Based on previous theoretical calculations, the presence of additional peaks (870 nm) in Au25 I should originate from an additional single electron occupied molecular orbital (SMO) which lies between the normal HOMO and LUMO.42To understand the excited state dynamics, we first probe the nanosecond transient absorption (TA) of two NCs dissolved in dichloromethane (CH2Cl2) using flash photolysis. Under similar experimental conditions after 400 nm excitation, the TA spectra of two NCs at 30 ns are almost identical between 300 nm and 800 nm (Fig. 1c), showing ground state bleaching (GSB) at around 350 nm, 450 nm and 700 nm and excited state absorption (ESA) at around 620 nm. The ns-TA kinetics probed at 620 nm and the single exponential fitting convoluted with the instrument response function (IRF) are shown in Fig. 1d. The excited state lifetimes are determined to be 3 μs and 2.3 μs, respectively. The very long-lived TA lifetime of Au25 II is identical to that of thiolate caped [Au25(PPh3)10(SR)5Cl2]2+ (Au25 III in short, the TA lifetime is around 2.3 μs),25 which indicates that the replacement of capping ligands on the waist of the Au25 rod shows little influence on the excited deactivation kinetics. Surprisingly, Au25 I, which has a much smaller optical gap (1.2 eV) compared to Au25 II (1.6 eV), exhibits a slightly longer excited state lifetime.
In general, a smaller bandgap will shorten the excited state lifetime (faster nonradiative process) of Au NCs with a similar structure.43 Previous density functional theory (DFT) calculations on Au25 III indicated that the HOMO is aligned along the z-axis of the Au25 rod while the LUMO is mainly contributed by the 6s orbital on the central Au atom shared by two Au13 units.36 As a result, it is difficult for the excited state energy to dissipate into the environment. Based on previous calculation results, the LUMO of Au25 II and the SMO of Au25 I are also contributed by the 6s orbital on the central Au atom. Therefore, both the Au25 rods exhibit very long-lived excited state lifetimes and similar excited-state dynamics in the nanosecond to microsecond time range.
The slightly longer excited-state lifetime observed in Au25 I (3 μs) than that in Au25 II (2.3 μs) can be ascribed to the different intrinsic radiative decays in the two NCs. Compared to Au25 II, Au25 I exhibits stronger near-infrared (NIR) photoluminescence and a smaller absorption coefficient of the band-edge transition, which will lead to a slower radiative rate and longer excited state lifetime.24,44 Therefore, Au25 I with a smaller Eg value shows a slightly longer excited-state lifetime than Au25 II. In this regard, the photoluminescence mechanisms of the two Au25 rod NCs are needed to elucidate this point, which calls for further investigations in the future.
Despite similar nanosecond photodynamics, different relaxation dynamics were observed in the femtosecond to picosecond time ranges. We first look into the TA isotropy dynamics by setting the pump and probe pulses to the magic angle (54.7°) so that the rotational contribution can be ruled out and only the population dynamics is obtained. Fig. 2 shows the TA data map and spectra of the two NCs probed between 350 nm and 750 nm at different time delays with excitation at 400 nm (3.01 eV). In Au25 II, the major evolution of the TA spectra occurs between 0 and 5 ps: the ESA peak at around 500 nm decays to give rise to ESA at around 620 nm, which remains unchanged between 10 ps and 7 ns (Fig. 2a). Such an observation is very similar to that of Au25 III which also shows non-decaying ESA peak at around 610 nm. In Au25 I, similar evolution in the TA spectra was observed between 0 and 5 ps, while an additional decay can be found between 100 ps and 1000 ps. Between 1000 ps and 7000 ps, the TA spectra remain unchanged (Fig. 2b). It is worth noting that in the initial 10 ps, a strong overlap of ESA and GSB can be found in the TA spectra for both the NCs. After comparing the TA kinetics probed at 508 nm of the two NCs, one can observe an additional decay between 0 and 3000 ps in Au25 I (Fig. S2, ESI†).
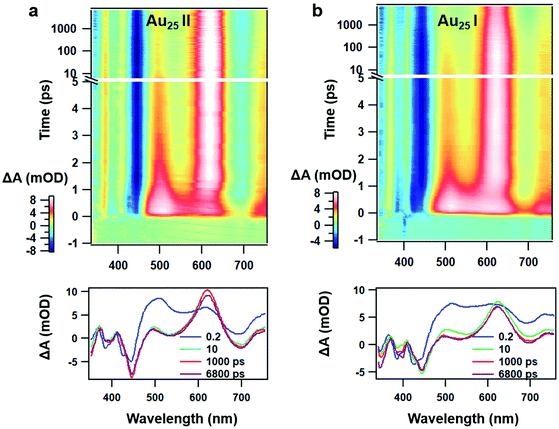 | ||
| Fig. 2 (a) TA data map with 400 nm excitation and TA spectra at the selected probe time of Au25 II NCs; (b) TA data map with 400 nm excitation and TA spectra at the selected probe time of Au25 I NCs. | ||
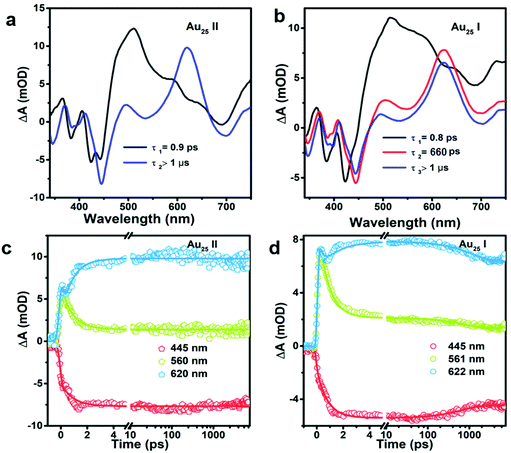
To obtain the decay time constants of the two NCs, we performed global fitting on the TA data and the fitting results are shown in Fig. 3 and Fig. S3.† The TA relaxation of Au25 II can be well fitted by two decay components (0.9 ps and >1 μs) (Fig. 3a). One can clearly observe that the ESA intensity in the first 2 ps experiences rapid decay and the ESA intensity at around 600 nm experiences an increase at the same time (Fig. 3c). With 400 nm (3.01 eV) excitation, the electrons of Au25 II will be excited to a higher excited state (LUMO+n), which should experience a rapid internal conversion (0.9 ps) to the LUMO and then a slow decay (2.3 μs obtained from ns-TA) to the ground state. Such a relaxation pathway in Au25 II is very similar to that in Au25 III reported previously,25 which suggests that replacing S–Ph with Se–Ph on the waist of the Au25 rod does not change the excited state dynamics significantly. In Au25 I, three decay components are required to fit the relaxation dynamics (0.8 ps, 660 ps and >1 μs) (Fig. 3b). The first sub-picosecond decay component is similar to those of Au25 II and III. After comparing the evolution associated spectra of the second (660 ps) and the third component (>1 μs), we found that they have almost similar profiles and only the amplitude changes slightly. Moreover, the ESA and GSB decay together between ∼3 ps and ∼2000 ps (Fig. 3d), indicating that no other intermediate excited state species was observed in the TA isotropy signal during this time. Therefore, the 660 ps decay can be identified as an additional relaxation channel of the excited state. Such an additional relaxation pathway should originate from the relaxation of the SMO lying between the LUMO and HOMO. The schematic diagram of the excited-state relaxation pathways for the two NCs is shown in Fig. 4.
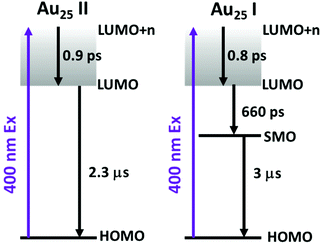 | ||
| Fig. 4 The schematic diagram of the excited-state relaxation pathways for Au25 II (left) and Au25 I (right). | ||
Since rod-shaped Au25 NCs are anisotropic in shape, we also performed transient absorption anisotropy (TAA) on the two NCs to obtain the dipole moment change during the excited state relaxation. The TAA signal r(t) is calculated by:45
 | (1) |
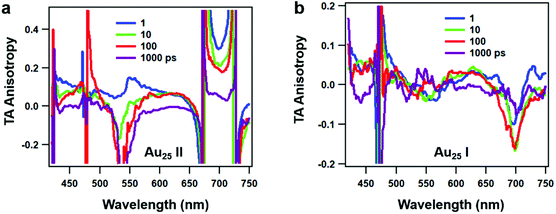 | ||
| Fig. 5 Transient absorption anisotropy (TAA) spectra of (a) Au25 II and (b) Au25 I NCs at selected time delays. | ||
The TAA decay dynamics can reflect the change in the excited state population, excited state energy transfer and spatial rotation of the clusters in solutions. We further plotted the TAA kinetics probed at GSB around 700 nm and 450 nm and ESA around 620 nm for two NCs in Fig. 6. The TAA values at 10 ps for two NCs are summarized in Table 1. In Au25 II, the TAA decays at 700 nm and 450 nm consist of a fast decay followed by a slow decay. If we ignore the dynamics before 1 ps, the TAA dynamics probed at 700 nm and 450 nm can be fitted by a two-exponential decay (1 ps, 500 ps). The 1 ps decay should be assigned to the internal conversion process, which will lower the TAA value probed at 450 nm and 700 nm. The second 500 ps decay should be explained as the rotational diffusion of the cluster. In a previous study, the rotational diffusion time of Au25 III dissolved in ethanol was found to be 1.3 ns.25 The rotational correlation time can be estimated from the hydrodynamic relation:46
 | (2) |
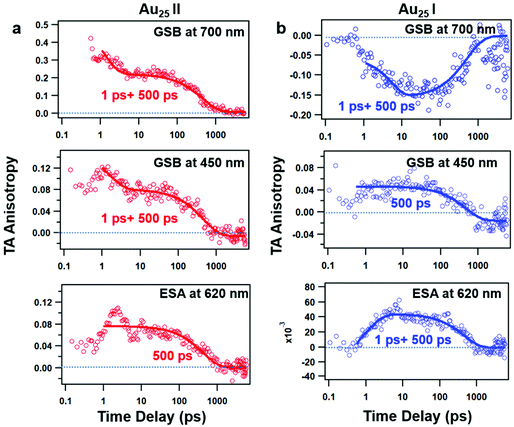 | ||
| Fig. 6 TAA kinetics at different probed wavelengths and the corresponding fits of Au25 II (a) and Au25 I (b) NCs. | ||
| GSB at 700 nm | GSB at 450 nm | ESA at 620 nm | |
|---|---|---|---|
| Au25 I | 0.21 | 0.07 | 0.07 |
| Au25 II | −0.15 | 0.04 | 0.04 |
In Au25 I, on the other hand, the TAA kinetics probed at 700 nm and 620 nm experience a fast increase followed by a very slow decay (Fig. 6b). The TAA kinetic traces probed at 700 nm and 620 nm can be fitted by a two-exponential function (1 ps rise and 500 ps decay), and the slow decay should be assigned to rotational diffusion similar to that in Au25 II. In Au25 I, the GSB around 700 nm is strongly overlapped with ESA, which may complicate the analysis of the TAA dynamics. One can observe the anisotropy value around 700 nm which increases from 0 to −0.15 with a time constant of 1 ps (Fig. 6b), which agrees with the 0.9 ps internal conversion in TA isotropy dynamics (Fig. 3c). This suggests that the probed transition (700 nm GSB) is almost vertical to the transition excited (400 pump) at 10 ps in Au25 I.
Typically, the TAA signal only experiences decay, which can reflect the relaxation of the excited states, energy transfer and the rotation of the molecule. However, the transient absorption spectrum is a combination of positive ESA, negative GSB and stimulated emission; a change in the amplitude of one component could change the anisotropy value of another component at the same probe wavelengths.45 Therefore, the overlap in the TA spectrum complicated the analysis of TA anisotropy. Here, at 620 nm, there is less overlap and the ESA dominates the TA spectra of both the NCs. We then chose the ESA around 620 nm to compare the TAA dynamics of two Au25 NCs. In Au25 I, an increase (1 ps) in the TAA dynamics around 620 nm can be observed, and is absent in Au25 II. The increase in TAA indicates that an additional ultrafast energy redistribution process (1 ps) should occur in Au25 I. The ultrafast energy redistribution of Au25 I could arise from the (1) relaxation from the LUMO to the SMO; (2) generation of a new transition dipole induced by photoexcitation as a result of its paramagnetic response. The detailed assignment of the increase in TAA in Au25 I calls for further theoretical work in the future.
Conclusions
In summary, we have revealed the effect of singe electrons on the excited state dynamics of “non-superatom” rod-shaped Au25 NCs by a comparative study of transient absorption isotropy and anisotropy spectroscopy. The relaxation dynamics of [Au25(PPh3)10(SePh)5Cl2]2+ is almost identical to that of [Au25(PPh3)10(SPh)5Cl2]2+, indicating little effect of the SePh on the waist of the Au25 rod. With the addition of one electron, an additional decay of 660 ps can be observed in the population dynamics while the long-lived microsecond decay remains almost unchanged. TAA measurements reveal a 500 ps rotational diffusion process in both the NCs, while the initial TAA dynamic process is found to be highly dependent on the charge state. These results provide new insight into the charge state effect on the photophysics of “non-superatom” metal nanoclusters.Conflicts of interest
There are no conflicts to declare.Acknowledgements
M. Z. acknowledges the startup funding from the University of Science and Technology of China and the Chinese Academy of Sciences (KY2340000137). Y. W. acknowledges financial support from the NSFC (No. 21873013). Y. S. acknowledges financial support from the NSFC (Grant 21801001) and the Grant for Scientific Research of BSKY (No: XJ2020026).References
- R. Jin, C. Zeng, M. Zhou and Y. Chen, Chem. Rev., 2016, 116, 10346–10413 CrossRef CAS PubMed.
- I. Chakraborty and T. Pradeep, Chem. Rev., 2017, 117, 8208–8271 CrossRef CAS PubMed.
- Y. Li, M. Zhou, Y. Song, T. Higaki, H. Wang and R. Jin, Nature, 2021, 594, 380–384 CrossRef CAS PubMed.
- C. Zeng, Y. Chen, K. Kirschbaum, K. J. Lambright and R. Jin, Science, 2016, 354, 1580–1584 CrossRef CAS.
- Z. Lei, X.-K. Wan, S.-F. Yuan, Z.-J. Guan and Q.-M. Wang, Acc. Chem. Res., 2018, 51, 2465–2474 CrossRef CAS.
- J. Yan, B. K. Teo and N. Zheng, Acc. Chem. Res., 2018, 51, 3084–3093 CrossRef CAS.
- H. Yang, Y. Wang, H. Huang, L. Gell, L. Lehtovaara, S. Malola, H. Häkkinen and N. Zheng, Nat. Commun., 2013, 4, 2422 CrossRef PubMed.
- R.-W. Huang, Y.-S. Wei, X.-Y. Dong, X.-H. Wu, C.-X. Du, S.-Q. Zang and T. C. W. Mak, Nat. Chem., 2017, 9, 689–697 CrossRef CAS.
- G. V. Hartland, Chem. Rev., 2011, 111, 3858–3887 CrossRef CAS PubMed.
- M. Zhou, C. Zeng, Y. Chen, S. Zhao, M. Y. Sfeir, M. Zhu and R. Jin, Nat. Commun., 2016, 7, 13240 CrossRef CAS PubMed.
- M. Zhu, C. M. Aikens, F. J. Hollander, G. C. Schatz and R. Jin, J. Am. Chem. Soc., 2008, 130, 5883–5885 CrossRef CAS PubMed.
- C. M. Aikens, Acc. Chem. Res., 2018, 51, 3065–3073 CrossRef CAS PubMed.
- M. Zhou, T. Higaki, G. Hu, M. Y. Sfeir, Y. Chen, D.-E. Jiang and R. Jin, Science, 2019, 364, 279–282 CrossRef CAS PubMed.
- M. Kato, Y. Shichibu, K. Ogura, M. Iwasaki, M. Sugiuchi, K. Konishi and I. Yagi, J. Phys. Chem. Lett., 2020, 11, 7996–8001 CrossRef CAS PubMed.
- M. Zhou and R. Jin, Annu. Rev. Phys. Chem., 2021, 72, 121–142 CrossRef CAS PubMed.
- T. Stoll, E. Sgrò, J. W. Jarrett, J. Réhault, A. Oriana, L. Sala, F. Branchi, G. Cerullo and K. L. Knappenberger, J. Am. Chem. Soc., 2016, 138, 1788–1791 CrossRef CAS PubMed.
- T. D. Green and K. L. Knappenberger, Nanoscale, 2012, 4, 4111–4118 RSC.
- M. S. Devadas, V. D. Thanthirige, S. Bairu, E. Sinn and G. Ramakrishna, J. Phys. Chem. C, 2013, 117, 23155–23161 CrossRef CAS.
- V. D. Thanthirige, M. Kim, W. Choi, K. Kwak, D. Lee and G. Ramakrishna, J. Phys. Chem. C, 2016, 120, 23180–23188 CrossRef CAS.
- M. Zhou, H. Qian, M. Y. Sfeir, K. Nobusada and R. Jin, Nanoscale, 2016, 8, 7163–7171 RSC.
- S. Maity, D. Bain and A. Patra, Nanoscale, 2019, 11, 22685–22723 RSC.
- A. K. Das, S. Maity, T. Sengupta, D. Bista, A. C. Reber, A. Patra, S. N. Khanna and S. Mandal, J. Phys. Chem. Lett., 2021, 12, 2154–2159 CrossRef CAS PubMed.
- M. Zhou, T. Higaki, Y. Li, C. Zeng, Q. Li, M. Y. Sfeir and R. Jin, J. Am. Chem. Soc., 2019, 141, 19754–19764 CrossRef CAS PubMed.
- H. Qian, M. Y. Sfeir and R. Jin, J. Phys. Chem. C, 2010, 114, 19935–19940 CrossRef CAS.
- M. Y. Sfeir, H. Qian, K. Nobusada and R. Jin, J. Phys. Chem. C, 2011, 115, 6200–6207 CrossRef CAS.
- Q. Li, T.-Y. Luo, M. G. Taylor, S. Wang, X. Zhu, Y. Song, G. Mpourmpakis, N. L. Rosi and R. Jin, Sci. Adv., 2017, 3, e1603193 CrossRef PubMed.
- Q. Li, M. Zhou, W. Y. So, J. Huang, M. Li, D. R. Kauffman, M. Cotlet, T. Higaki, L. A. Peteanu, Z. Shao and R. Jin, J. Am. Chem. Soc., 2019, 141, 5314–5325 CrossRef CAS PubMed.
- M. Zhu, W. T. Eckenhoff, T. Pintauer and R. Jin, J. Phys. Chem. C, 2008, 112, 14221–14224 CrossRef CAS.
- M. Zhu, C. M. Aikens, M. P. Hendrich, R. Gupta, H. Qian, G. C. Schatz and R. Jin, J. Am. Chem. Soc., 2009, 131, 2490–2492 CrossRef CAS PubMed.
- M. Zhou, C. Yao, M. Y. Sfeir, T. Higaki, Z. Wu and R. Jin, J. Phys. Chem. C, 2018, 122, 13435–13442 CrossRef CAS.
- K. Kwak, Q. Tang, M. Kim, D.-E. Jiang and D. Lee, J. Am. Chem. Soc., 2015, 137, 10833–10840 CrossRef CAS PubMed.
- L. J. Williams, P. J. Herbert, M. A. Tofanelli, C. J. Ackerson and K. L. Knappenberger, J. Chem. Phys., 2019, 150, 101102 CrossRef PubMed.
- M. Walter, J. Akola, O. Lopez-Acevedo, P. D. Jadzinsky, G. Calero, C. J. Ackerson, R. L. Whetten, H. Grönbeck and H. Häkkinen, Proc. Natl. Acad. Sci. U. S. A., 2008, 105, 9157 CrossRef CAS PubMed.
- H. Qian, W. T. Eckenhoff, Y. Zhu, T. Pintauer and R. Jin, J. Am. Chem. Soc., 2010, 132, 8280–8281 CrossRef CAS PubMed.
- K. Nobusada and T. Iwasa, J. Phys. Chem. C, 2007, 111, 14279–14282 CrossRef CAS.
- Y. Shichibu, Y. Negishi, T. Watanabe, N. K. Chaki, H. Kawaguchi and T. Tsukuda, J. Phys. Chem. C, 2007, 111, 7845–7847 CrossRef CAS.
- S. Park and D. Lee, Langmuir, 2012, 28, 7049–7054 CrossRef CAS PubMed.
- V. D. Thanthirige, E. Sinn, G. P. Wiederrecht and G. Ramakrishna, J. Phys. Chem. C, 2017, 121, 3530–3539 CrossRef CAS.
- Q. Li, C. J. Zeman IV, Z. Ma, G. C. Schatz and X. W. Gu, Small, 2021, 17, 2007992 CrossRef CAS PubMed.
- S. Wang, X. Meng, A. Das, T. Li, Y. Song, T. Cao, X. Zhu, M. Zhu and R. Jin, Angew. Chem., Int. Ed., 2014, 53, 2376–2380 CrossRef CAS PubMed.
- M. Zhou, J. Zhong, S. Wang, Q. Guo, M. Zhu, Y. Pei and A. Xia, J. Phys. Chem. C, 2015, 119, 18790–18797 CrossRef CAS.
- Y. Song, S. Jin, X. Kang, J. Xiang, H. Deng, H. Yu and M. Zhu, Chem. Mater., 2016, 28, 2609–2617 CrossRef CAS.
- M. Zhou and Y. Song, J. Phys. Chem. Lett., 2021, 12, 1514–1519 CrossRef CAS PubMed.
- Q. Li, C. J. Zeman, G. C. Schatz and X. W. Gu, ACS Nano, 2021, 15, 16095–16105 CrossRef CAS PubMed.
- S. Wallin, J. Davidsson, J. Modin and L. Hammarström, J. Phys. Chem. A, 2005, 109, 4697–4704 CrossRef CAS PubMed.
- L. Reynolds, J. A. Gardecki, S. J. V. Frankland, M. L. Horng and M. Maroncelli, J. Phys. Chem., 1996, 100, 10337–10354 CrossRef CAS.
- I. Smallwood, Handbook of Organic Solvent Properties, Butterworth-Heinemann, 2012 Search PubMed.
Footnote |
| † Electronic supplementary information (ESI) available: Experimental section, absorbance on an energy scale and the details of transient absorption data. See DOI: 10.1039/d1nr06208e |
| This journal is © The Royal Society of Chemistry 2021 |


