
 Open Access Article
 This Open Access Article is licensed under a
 Creative Commons Attribution 3.0 Unported Licence
Insights into Pyrocumulus aerosol composition: black carbon content and organic vapor condensation†
Kyle
Gorkowski
 *a,
Eunmo
Koo
b,
Spencer
Jordan
ac,
Jon
Reisner
b,
Katherine B.
Benedict
a and
Manvendra
Dubey
a
*a,
Eunmo
Koo
b,
Spencer
Jordan
ac,
Jon
Reisner
b,
Katherine B.
Benedict
a and
Manvendra
Dubey
a
aEarth and Environmental Sciences Division, Los Alamos National Laboratory, NM 87545, USA. E-mail: gorkowski@lanl.gov
bX Computational Physics Division, Los Alamos National Laboratory, NM 87545, USA
cUniversity of California, Davis, CA 95616, USA
First published on 29th November 2023
Abstract
Megafires are increasingly generating Pyrocumulus clouds (PyroCus) through the interplay of atmospheric conditions such as stability and humidity, hot updrafts, and emitted aerosols from burning vegetation. As megafires become more frequent, the annual radiative influence of PyroCus on the climate is intensifying. In this study, we aim to quantify the aerosol mass and black carbon content that PyroCus injects into the stratosphere, which can persist for 3 to 15 months. Utilizing aircraft-sampled smoke plumes from both the Northern and Southern Hemispheres, our findings indicate that the mass fraction of black carbon within PyroCus remains consistent, ranging between 0.5 and 3%. This serves as a crucial constraint for incorporating source terms in climate models. Additionally, we provide evidence of the volatile vapor 1-nonene condensing in the updrafts, which is one of likely many organic vapors contributing to increased aerosol mass concentrations. To corroborate these findings, we conducted independent Large Eddy Simulations (LES) that demonstrate organic vapor condensation can double the aerosol mass in updrafts. These resolved LES serve as a valuable guide, directing future aircraft measurement locations and further development of PyroCus mechanisms in models.
Environmental significanceOur study focuses on quantifying the aerosol mass and black carbon content that Pyrocumulus clouds inject into the stratosphere, a phenomenon exacerbated by the rise in megafires. These aerosols can persist in the stratosphere for 3 to 15 months, influencing the global climate. We find that the black carbon mass fraction within these clouds remains consistent, a critical constraint for climate models. The increasing frequency of megafires has intensified the climatic influence of Pyrocumulus clouds, making our work crucial for accurately predicting their environmental impact. |
1 Introduction
Pyrocumulus (PyroCu) clouds, formed during wildfires, signify a complex interplay between heat release, vapors, aerosol particles, and atmospheric conditions.1–3 Rapidly rising plumes trigger cloud droplet formation, with the potential to further develop into Pyrocumulonimbus (PyroCb) clouds through lightning or precipitation. As the buoyant airmass ascends and cools, condensation of organic vapors and cloud droplet activation may occur.1,2,4 These phenomena lead to latent heat release, prompting further ascent.3,5,6 Yet until recently, limited aircraft measurements have probed the vapor and aerosol processing in PyroCbs.Wildfire emissions primarily consist of organic aerosols (OA) and black carbon (BC). However, the radiative impact of BC aerosol remains an active area of research due to atmospheric processing or aging that can happen throughout the lifetime of the plume. These include changes in its mixing state, OA coating thickness, and structure, which influence BC's radiative properties and atmospheric lifetime.7–12 Moreover, solar heating by BC absorption increases self-lofting of aerosol and consequently the higher peak altitude and longer lifetime of PyroCu smoke plumes.13
Megafires with climatic impact (exceeding 40 km2) have occurred worldwide, injecting stratospheric aerosols that scatter sunlight, cooling the Earth's surface.6,14–24 These plumes can induce both immediate surface cooling (−3 °C) and prolonged global cooling.13,22,25 Given their slow removal timescale (3–15 months from the lower stratosphere), PyroCu plumes produce lasting radiative impacts, unlike their tropospheric counterparts.12,13,15,17,20–22,24–26 These effects make PyroCus vital for modeling analogous scenarios like nuclear winter or volcanic eruptions.
Climate assessments often begin by initializing smoke plumes into the free troposphere and tropopause (or lower stratosphere), requiring assumptions about BC mass fraction.13,27–32 For megafires, modeling studies6,13,17 and observations2,12 have suggested a BC mass fraction of 2% BC. However, in estimating worst case scenarios and maximizing impacts of nuclear explosion fires, the BC mass fraction used can be up-to 100% BC.33,34 In this work, we provide supporting evidence through aircraft observations and Large Eddy Simulations (LES) for more accurate plume initiations of wildfires.3,13 Future improvements to bottom-up LES simulations will also constrain nuclear explosion fire scenarios.
Typically, LES models have not incorporated organic gas-to-particle partitioning, instead focusing on fluid dynamics and cloud droplet formation.35,36 While minor for inorganic aerosol systems, significant OA partitioning occurs in organic vapor rich environments.2,5,6 This organic vapor partitioning alters the BC fraction, impacting top-of-the-atmosphere cooling.6,17,22
Our study emphasizes temperature-driven organic vapor condensation rather than chemical aging, though the latter can also result in additional OA formation.37 Using a two-product model, we added OA partitioning to LES, motivated by the British Columbia 2017 wildfire's mass closure analysis for Reisner et al.3 The satellite-estimated aerosol mass emission of the BC 2017 wildfire was 0.2–0.3 Tg compared to the initial bottom-up emissions (without OA condensation) of 0.08–0.12 Tg, and with OA condensation the total mass was 0.22–0.35 Tg. OA formation resolves the disparity between satellite-estimated aerosol mass4,14 and bottom-up emissions simulations.3
2 Methods
2.1 Aircraft flights
To investigate the dynamics of OA formation and BC mass fraction in wildfire plumes, we carried out an analysis of aircraft observations. This analysis aimed to detect OA formation by observing changes in particle diameter and organic vapor gas-to-particle partitioning. Then we analyzed the vertical profile of BC mass fraction to support climate studies and to validate our wildfire LES.The aircraft studies were divided into two categories: those focusing on smoke sampling (containing a single PyroCb sampling), and non-smoke related campaigns. Table 1 lists the campaigns and provides summary of the sampling domains. Campaigns for smoke sampling include the Fire Influence on Regional to Global Environments and Air Quality experiment – FIREX-AQ NOAA/NASA38–, Biomass Burning Observation Period – BBOP DOE-ARM39–, and the Western Wildfire Experiment for Cloud Chemistry Aerosol Absorption and Nitrogen Study – WECAN NSF.40,41 The smoke sampling data was separated into three categories: general wildfires (North America Northwest Region), PyroCb (FIREX-AQ had the only intercept), and agricultural burns (central and southern USA). To exclusively analyze in-smoke measurements, we utilized the in-smoke data flags for FIREX-AQ and WECAN campaigns, and for BBOP, a threshold of over 100 ppbv carbon monoxide was employed, consistent with the former's in-smoke flag criteria. To contrast these smoke plume measurements, we performed identical analyses for urban flight studies using the DOE-ARM aircraft42 the Carbonaceous Aerosol and Radiative Effects Study – CARES43–, Two Column Aerosol Project – TCAP44 – and a South America background site the Cloud, Aerosol, and Complex Terrain Interactions – CACTI45–, which also sampled some diluted smoke transport.
We assessed aerosol size distributions utilizing either the Laser Aerosol Spectrometer (LAS; TSI) or the Ultra-High Sensitivity Aerosol Spectrometer (UHAS; Droplet Measurement Technologies),46,47 depending on the campaign. The volume mean diameter was calculated from the size distribution data, and the total aerosol mass (PM1) was estimated assuming a density of 1.25 g cm−3.48–50 The BC mass was measured using the Single-Particle Soot Photometer (SP2, Droplet Measurement Technologies),51 enabling us to analyze the altitude dependence of the BC mass fraction (BC/PM1).
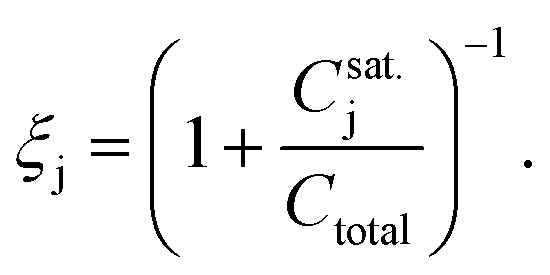
The gas-to-particle partitioning analysis for organic vapors in this study was conducted using canister data collected during the FIREX-AQ campaign to investigate OA condensation processes.52 As the temperature decreases from ground level to the tropopause (from 320 to 220 K or >12 km), the volatility  of the organic compounds can decrease by four orders of magnitude.53 This thermodynamic change effectively transforms an intermediate volatile organic compound into a semi-volatile one.54,55 Specifically, a vapor saturation concentration that starts at 106 μg m−3 at ground level can decrease to 102 μg m−3 at the tropopause due to this temperature decrease, although the exact change varies depending on the organic molecule in question. Note, our analysis is focused on thermodynamic driven OA condensation and not chemical aging of organic vapors. For each of the 125 compounds measured in the gas phase, we calculated the aerosol partitioning coefficient as
 | (1) |
Since the organic aerosol chemical composition in the condensed phase was unknown, we approximated the saturation concentration Csat.j from the compound's pure vapor pressure,53 recognizing that this would likely result in underestimation. The total aerosol mass Ctotal was calculated from integrating the aerosol size distribution. Among all speciated gases, 1-nonene exhibited significant response in partitioning coefficients and was selected for subsequent altitude-dependent analysis. For organic vapor measurements, we expected a decrease in semi-volatile vapors corresponding to temperature decrease with increasing altitude, resulting in condensation. Our altitude-based analysis revealed evidence for OA condensation, substantiating the inclusion of this process in the LES of PyroCus.
2.2 Large eddy simulation
The LES utilizes the High-Gradient applications model (HIGRAD), a fluid dynamics model created by Los Alamos National Laboratory (LANL). It can solve either the Euler or Navier–Stokes equations, depending on the application. In our study, we implemented a conservative Euler equation set,56 with a cloud physics package57 to simulate the transport and fate of water vapor, cloud droplets, OA, BC, and organic vapors. The inclusion of these constituents better captures the variability from entrainment or processing.58In conjunction with LANL's fire behavior model (FIRETEC), HIGRAD was used to simulate coupled atmosphere-fire behavior on a landscape scale, encompassing predictions for atmosphere-fuel interactions,59 combustion,60 convective and radiative heat transfer,61 particulate emissions (including BC and OA),62 and organic vapor emissions.
2.3 Organic aerosol parameterization
The OA partitioning mechanism was integrated into the LES model using a two-product approach. This parameterization was separate from our previous aircraft volatile organic vapor (VOC) analysis and does not parameterize those observation. The LES approach employed a temperature and humidity-dependent condensation fraction curve. Given a total organic concentration (particles + gases) we scaled the integrated mass concentration of the volatility distribution from Theodoritsi and Pandis,63 enabling us to calculate different amounts of organic vapor partitioning.To reduce the volatility distribution to a two-product model (consisting of primary OA and organic vapor), we conducted random sampling (10![[thin space (1/6-em)]](https://www.rsc.org/images/entities/char_2009.gif) 000 uniform-random samples) of the primary OA mass concentration, organic vapors (via CO concentration64), relative humidity (RH), and temperature within defined bounds (see ESI†). We employed the Clausius–Clapeyron approximation to account for the temperature dependence in the biomass burning volatility distribution.55
000 uniform-random samples) of the primary OA mass concentration, organic vapors (via CO concentration64), relative humidity (RH), and temperature within defined bounds (see ESI†). We employed the Clausius–Clapeyron approximation to account for the temperature dependence in the biomass burning volatility distribution.55
From these random sampling results, we derived the fraction of total organic vapors that condensed (i.e., the partitioning coefficient) and fitted it to a polynomial with temperature and RH. Although the fit introduced a median error of 10%, this approach enhanced computational efficiency by avoiding the need to solve a partitioning equilibrium problem in each grid cell. Furthermore, our model emphasizes the temperature dependence in organic vapor partitioning, an aspect more critical in PyroCus than the mass concentration dependence on partitioning. The coefficients for this polynomial fit are provided in the ESI.†
3 Results
3.1 OA condensation profile
The partitioning coefficient profiles derived from the observations of 1-nonene reveal an altitude dependence in both the fire and PyroCb plumes, but not in the regional air (see Fig. 1a). This altitude dependence allows us to conclude that 1-nonene condenses to the particle phase within these dense smoke plumes. In the diluted regional air, the organic mass concentration is insufficient to cause any measureable partitioning effect. Among a variety of organic vapors measured from FireX-AQ, only 1-nonene has a low enough vapor pressure to condense with temperature decreases in the updrafts. Other gases with similar or lower vapor pressures would likely also exhibit this temperature-dependent behavior, leading to similar altitude dependence.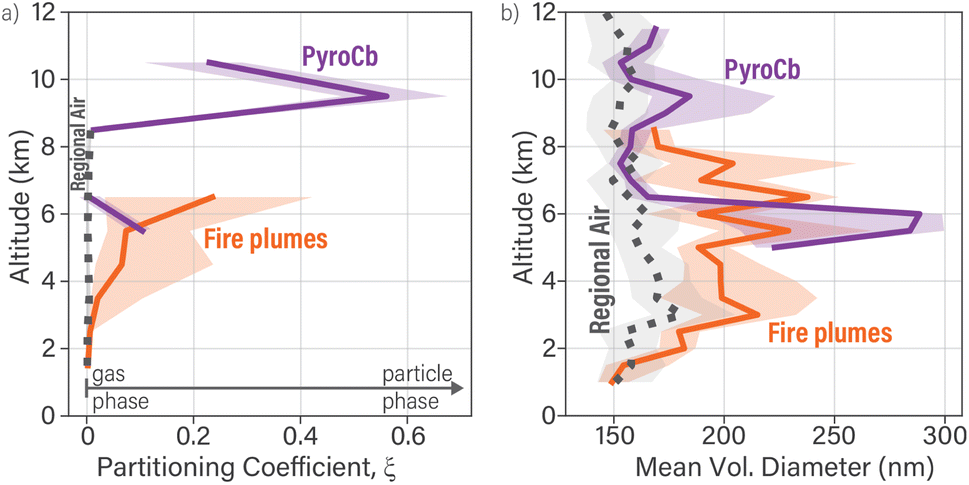 | ||
| Fig. 1 Altitude profiles from FIREX-AQ flights with identified fire plumes (solid orange), sampled PyroCb plume (purple), and regional air (gray dashed). Medians are shown with 25% and 75% percentiles shaded. (a) 1-Nonene partitioning coefficient; regional air contains diluted smoke but not enough for significant gas-to-particle partitioning. (b) Mean volume diameter of aerosol particles; diameter increase over regional air corresponds to condensational growth. | ||
A notable consequence of the organic vapor partitioning observation is an increase in aerosol sizes due to OA condensational growth. As shown in Fig. 1b, the altitude dependence of the mean volume diameter displays little change in the regional air (diameters between 150 and 200 nm), consistent with a well-mixed atmosphere. In contrast, fire plumes and PyroCu demonstrate an increase in mean particle diameter over the regional air, starting at approximately 3 km. This is consistent with OA condensational growth, with diameters observed up to 280 nm. The decrease in particle diameter above 8 km could either be attributed to plume dilution and organic vapor evaporation or simply reflect the limited observational data at the higher altitudes. If there was no condensation, coagulation, or entertainment the altitude profile of the mean volume diameter would remain constant.
3.2 Black carbon fraction
The characterization of the BC mass fraction emission ratio is a critical aspect when initializing climate models to study the impacts of PyroCus on climate. Understanding this mass fraction profile (Fig. 2) is vital to accurately simulating radiative effects and aerosol lifetimes in the stratosphere.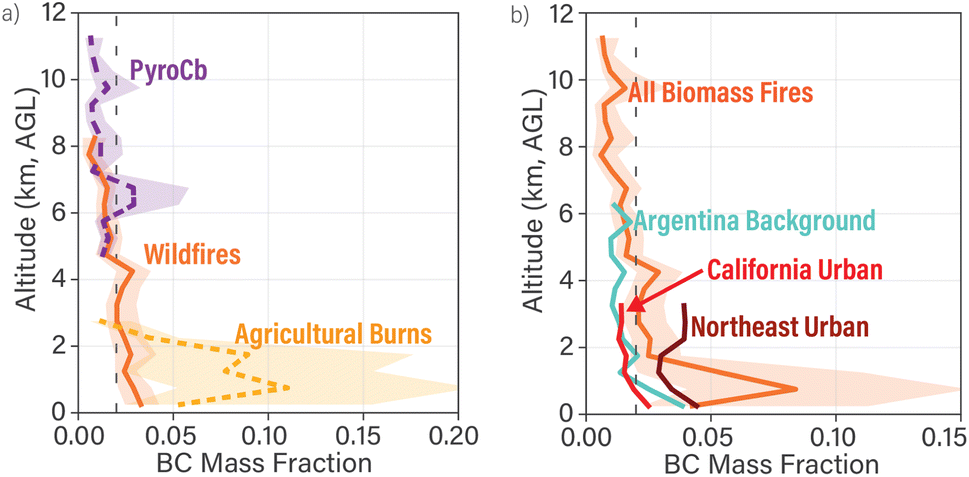 | ||
| Fig. 2 (a) Altitude profiles of BC mass fraction (BC/PM1) for wildfire flights, identified fire plumes (orange), the single PyroCb plume (purple dashed), and agricultural fires (yellow). Medians with 25% and 75% percentiles shaded (see ESI† for number of data points per altitude interval). BC mass fraction ranges 0.5–3% above planetary boundary layer (>3 km); thin gray dashed line at 2% is for visual reference. (b) Summary of altitude profiles of BC mass fraction from multiple campaigns including combined fire plumes (orange) and urban campaigns; Argentina summer background from CACTI. | ||
Above the planetary boundary layer (∼3 km), combined smoke observations reveal that all plume types fall within a 0.5–3% BC mass fraction range (Fig. 2a). Global aircraft observations in the stratosphere report slightly lower BC mass fractions for smoke and mixed plumes (0.4–0.5%).65 Recent analysis from the NASA Atmospheric Tomography (ATom) campaign has shown results consistent with the BC mass fraction range, measuring 1.2 ± 1.9% for wildfires and 1.6 ± 0.8% specifically for the same 2017 British Columbia PyroCb.12 The PyroCb plume, which had larger updraft velocities, exhibits the same BC mass fraction as non-PyroCb fire plumes. This observation implies OA in the PyroCb plume maintain thermodynamic equilibrium (i.e., temperature driven condensation) similar to the non-PyroCb wildfire plumes.
A notable trend in our analysis was the reduction of the BC fraction from the boundary layer to the free troposphere (Fig. 2a). This trend may result from multiple factors, including variations in transport pathways such as advection or entrainment, impacting aerosol concentration and composition, and variations in size that could affect susceptibility to dry deposition. These aspects could lead to a sharper change in aerosol composition between the free troposphere and planetary boundary layer.
The uniformity in BC mass fractions across different plume types might be attributed to the observed plumes predominantly originating from wildfires in the northwestern United States, leading to similar emission ratios of BC to organics. Further investigation into potential source dependence, such as wildfire emissions versus urban areas, is depicted in Fig. 2b, illustrating the BC mass fraction from additional aircraft field campaigns. Urban measurements reveal less variability between the boundary layer (urban measurements) and free troposphere (Argentina measurements) but remain within a similar BC mass fraction range.
3.3 Simulation
We employed the HIGRAD simulation to explore the evolution of OA formation and BC mass fraction within an idealized fire source. This investigation offers insights into the complex dynamics of plume dilution and emphasizes the temperature effects that govern the condensation of organic vapors.In the simulations (Fig. 3a), the fire plume exhibits a chimney effect, wherein the smoke forms an intact column that extends to the tropopause (12 km). This chimney effect concentrates the aerosol mass within the column, inhibiting widespread dilution in the free troposphere and maintaining a higher internal temperature in the plume. Upon reaching the tropopause (12 km), aerosol particles spread horizontally, and organic vapors condense, thereby accumulating additional aerosol mass via the thermodynamic processes captured in our OA parameterization implemented in HIGRAD.
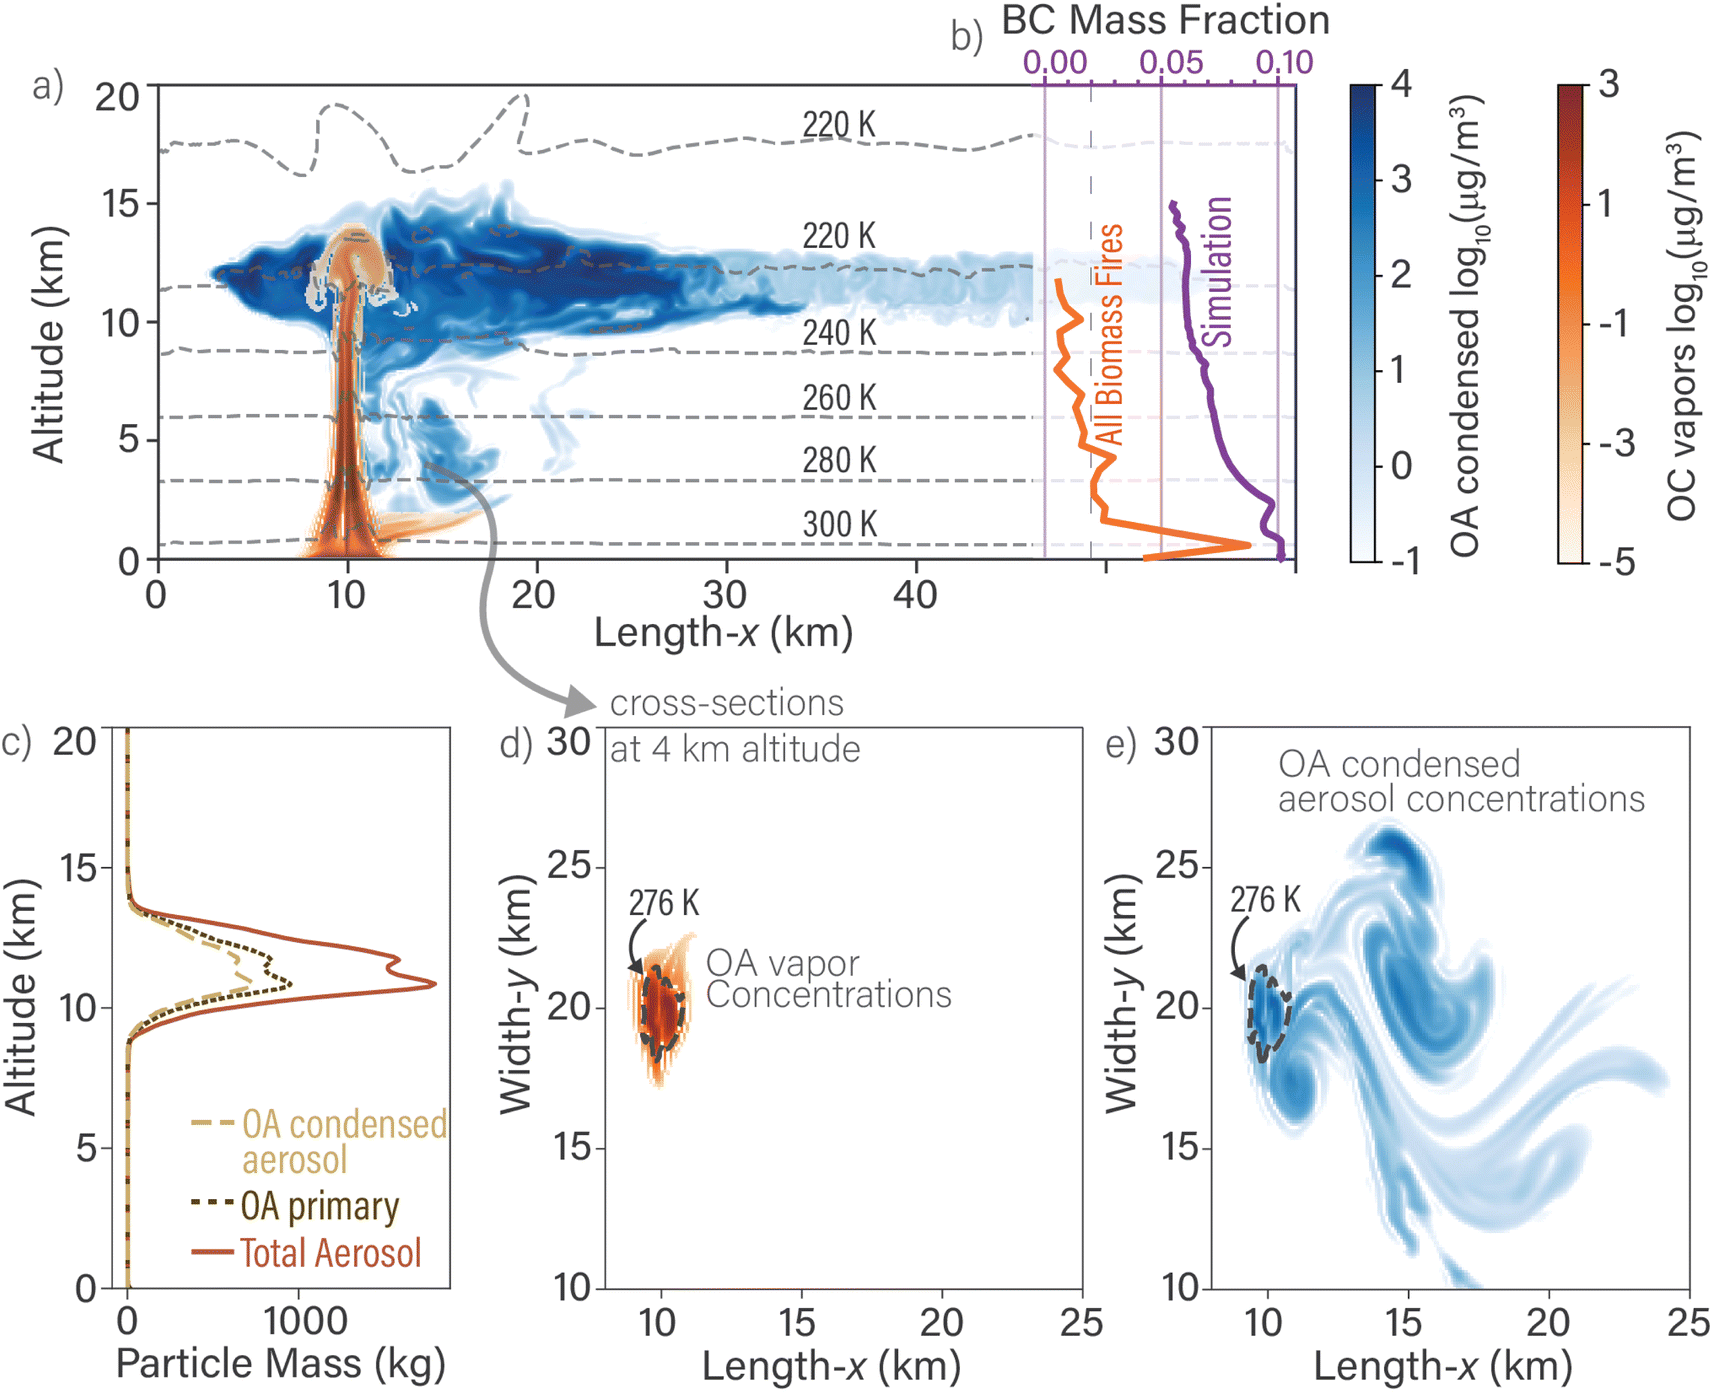 | ||
| Fig. 3 Analysis of the LES simulation at 12.5 hours with 3 m s−1 horizontal wind: condensed OA (blue) and organic vapors (orange). (a) Vertical cross-section with organic vapor gradients overlapped onto of OA; temperature contours are dashed. (b) BC mass fraction profile in LES simulation (purple) compared to biomass burning observations (orange). (c) Plume profile after 12.5 hours, OA condensed aerosol from vapors (dashed gold), OA primary emissions non-volatile (dotted brown), and total aerosol mass. (d) Horizontal cross-section of organic vapor concentration with 276 K temperature contour. (e) Horizontal cross-section of OA condensed aerosol concentration from vapors, with 276 K contour. | ||
The aerosol mass profile (Fig. 3c) may seem uneventful within the plume, but this profile hides the underlying OA formation that occurs over a larger spatial area than the plume core. By examining horizontal cross-sections (Fig. 3d and e), we can discern the extent of OA formation. In Fig. 3c, the organic vapors persist in the core chimney of the plume. As the air mass cools and mixes outside the chimney, OA forms (Fig. 3e). This chimney effect prevails until the tropopause, channeling smoke vertically with minimal alteration in OA formation, primarily due to restricted cooling. Eventually, the buoyant smoke ascent halts, and reduced buoyancy enables the mixing of the smoke plume with the air mass at the tropopause. This interaction cools the organic vapors, leading to OA formation, as depicted in blue in Fig. 3a. For additional OA and BC altitude profiles see the ESI Section 6 Additional simulations.†
The simulation had a consistent offset of +5% in the BC mass fraction relative to observations – across all altitudes–, as illustrated in Fig. 3b. However, this simulation did not account for potential lofting of ash and dust resulting from surface winds. The consideration of these particle sources in Reisner et al.3 led to a reduction in the BC fraction to the 3% range, aligning more closely with the upper limit of the observed BC mass fraction. Additionally, as wildfire plumes evolve, coagulation scavenging near the source can also lead to the removal of BC prior to the condensation of organic vapors. This type of near-field scavenging would improve the agreement between our simulated BC mass fraction and observations.
4 Discussion
The contrasting profiles from urban observations underscore differences in BC mass fractions, contingent on source type. However, the similarities in BC mass fractions observed for wildfires and agricultural burns in North America contradict the diversity anticipated from individual emission factors. Emissions from specific tree and forest species can vary widely, with figures ranging from 0.1% for Lodgepole pine to 42% for Pocosin.66 At the forest or field level, according to Akagi et al.,67 the BC mass fraction for non-tropical forest emissions is 3.3%, while agricultural burns exhibit an 11% BC mass fraction. Near-field measurements of wildfires reveal up to 35% BC mass fraction,10 yet lingering smoke consistently shows a 2–3% BC mass fraction days later. Despite source disparities, we observed BC mass fractions exhibited a consistent trend once smoke plumes reach the free troposphere.Aerosol processing may channel the BC fraction into the observed 0.5–3% range in the free troposphere after OA condensation has occurred. In addition, factors such as coagulation with dust or ash particles might lead to a decrease in BC mass fraction through dry deposition before OA condensation is occurring.68 The complexity of these dynamics, including fallout and dispersion of particles, necessitates further research to reconcile these different regimes of OA formation and BC mass fraction in general smoke plumes.69–72
The LES revealed insights into the relationship between OA formation and BC mass fraction as the plume is transported within the troposphere to the stratosphere. While the study affirmed that OA formation via thermodynamic processes could reduce the BC mass fraction after organic vapors condensate into OA. However, there was few aircraft transects at the tropopause to provide evidence for the horizontal plume mixing and cooling at this altitude. This absence can be attributable to the limited sampling of PyroCu-like plumes with enough convective potential energy to reach the tropopause. Yet, the general structure of the decreasing BC mass fraction profile agreed between observations and the LES.
5 Conclusion
This study probed the vertical distribution of BC mass fractions in wildfire smoke plumes and the influence of OA formed via condensation on modifying these fractions. We observed a consistent BC mass fraction – in the free troposphere – across different emission locations. This consistency may arise from OA formation, which curtails near-field variability as plumes disperse into the far field. We have highlighted the need to account for the OA formation in controlling the vertical distribution of BC mass fraction in wildfire plumes, especially when transported into the stratosphere. Our large eddy simulation further corroborated that OA formation – due to thermodynamics – reduces the BC mass fraction, and the chimney effect limits tropospheric mixing during plume ascent.In conclusion, our findings underscore the importance of considering both the vertical distribution of BC mass fraction in wildfire smoke plumes and the role of OA in shaping this fraction. These considerations are essential to enhance climate modeling and more accurately characterize the environmental repercussions of wildfires.
Author contributions
Conceptualization contributors were K. G., J. R., K. B. B., and M. D. The investigation, methodology and writing – review & editing – contributors were K. G., E. K., S. J., J. R., K. B. B., and M. D. The data curation, formal analysis, visualization and writing – original draft – contributors were K. G., E. K., S. J., and K. B. B.Conflicts of interest
There are no conflicts to declare.Acknowledgements
Data used in this research are available in data repositories for: Atmospheric Radiation Measurement (ARM) user facility, a U.S. Department of Energy (DOE) Office of Science user facility managed by the Biological and Environmental Research Program https://adc.arm.gov/discovery/#/, FIREX-AQ data https://csl.noaa.gov/projects/firex-aq/data.html, and WE-CAN data https://data.eol.ucar.edu/project/WE-CAN. The DOE-ARM program funded BBOP, CARES, TCAP, and CACTI field campaigns. The FIREX-AQ was a combined NOAA and NASA funded campaign, supporting instrument PIs J. P. Schwarz, J. M. Katich, R. Moore, E. Wiggins, E. Winstead, C. Robinson, L. Thornhill, K. Sanchez, G. S. Diskin and D. R. Blake. The WE-CAN campaign was funded by NSF and supported the deployments and instrument PI E. J. T. Levin. This manuscript was supported by the U.S. Department of Energy through the Los Alamos National Laboratory. Los Alamos National Laboratory is operated by Triad National Security, LLC, for the National Nuclear Security Administration of U.S. Department of Energy (Contract No. 89233218CNA000001). K. G., E. K., S. J., J. R., K. B. B. & M. K. D. were supported by Laboratory Directed Research and Development program (20200035DR), and K. G., S. J., K. B. B. & M. K. D. by DOE Biological & Environmental Research Atmospheric System Research. K. G. would also like to thank the discussions of this project with, James E. Lee, and Allison C. Aiken. We also gratefully acknowledge the Los Alamos National Laboratory's Institutional Computing Program for providing computational resources for the performed simulations. Release Number LA-UR-23-22173.References
- M. Fromm, D. Peterson and L. D. Girolamo, J. Geophys. Res.: Atmos., 2019, 124, 13254–13272 CrossRef.
- D. A. Peterson, L. H. Thapa, P. E. Saide, A. J. Soja, E. M. Gargulinski, E. J. Hyer, B. Weinzierl, M. Dollner, M. Schöberl, P. P. Papin, S. Kondragunta, C. P. Camacho, C. Ichoku, R. H. Moore, J. W. Hair, J. H. Crawford, P. E. Dennison, O. V. Kalashnikova, C. E. Bennese, T. P. Bui, J. P. DiGangi, G. S. Diskin, M. A. Fenn, H. S. Halliday, J. Jimenez, J. B. Nowak, C. Robinson, K. Sanchez, T. J. Shingler, L. Thornhill, E. B. Wiggins, E. Winstead and C. Xu, Bull. Am. Meteorol. Soc., 2022, E2140–E2167 Search PubMed.
- J. M. Reisner, A. J. Josephson, K. J. Gorkowski, E. Koo, D. K. Thompson, D. Schroeder and M. K. Dubey, J. Geophys. Res.: Atmos., 2023, 1, 19 Search PubMed.
- D. A. Peterson, E. J. Hyer, J. R. Campbell, J. E. Solbrig and M. D. Fromm, Mon. Weather Rev., 2017, 145, 2235–2255 CrossRef.
- B. N. Murphy, J. Julin, I. Riipinen and A. M. L. Ekman, J. Geophys. Res.: Atmos., 2015, 120, 10441–10464 Search PubMed.
- O. Torres, P. K. Bhartia, G. Taha, H. Jethva, S. Das, P. Colarco, N. Krotkov, A. Omar and C. Ahn, J. Geophys. Res.: Atmos., 2020, 125, 1–25 Search PubMed.
- M. Hallquist, J. C. Wenger, U. Baltensperger, Y. Rudich, D. Simpson, M. Claeys, J. Dommen, N. M. Donahue, C. George, A. H. Goldstein, J. F. Hamilton, H. Herrmann, T. Hoffmann, Y. Iinuma, M. Jang, M. E. Jenkin, J. L. Jimenez, A. Kiendler-Scharr, W. Maenhaut, G. Mcfiggans, T. F. Mentel, A. Monod, A. S. H. Prévôt, J. H. Seinfeld, J. D. Surratt, R. Szmigielski and J. Wildt, Atmos. Chem. Phys., 2009, 9, 5155–5236 CrossRef CAS.
- L. D. Yee, K. E. Kautzman, C. L. Loza, K. A. Schilling, M. M. Coggon, P. S. Chhabra, M. N. Chan, A. W. Chan, S. P. Hersey, J. D. Crounse, P. O. Wennberg, R. C. Flagan and J. H. Seinfeld, Atmos. Chem. Phys., 2013, 13, 8019–8043 CrossRef.
- B. G. Martinsson, J. Friberg, O. S. Sandvik, M. Hermann, P. F. van Velthoven and A. Zahn, npj Clim. Atmos. Sci., 2019, 2, 1–6 CrossRef CAS.
- J. E. Lee, K. Gorkowski, A. G. Meyer, K. B. Benedict, A. C. Aiken and M. K. Dubey, Geophys. Res. Lett., 2022, 49, 1–9 Search PubMed.
- A. J. Sedlacek, E. R. Lewis, T. B. Onasch, P. Zuidema, J. Redemann, D. Jaffe and L. I. Kleinman, Environ. Sci. Technol., 2022, 56, 14315–14325 CrossRef PubMed.
- J. M. Katich, E. C. Apel, I. Bourgeois, C. A. Brock, T. P. Bui, P. Campuzano-Jost, R. Commane, B. Daube, M. Dollner, M. Fromm, K. D. Froyd, A. J. Hills, R. S. Hornbrook, J. L. Jimenez, A. Kupc, K. D. Lamb, K. McKain, F. Moore, D. M. Murphy, B. A. Nault, J. Peischl, A. E. Perring, D. A. Peterson, E. A. Ray, K. H. Rosenlof, T. Ryerson, G. P. Schill, J. C. Schroder, B. Weinzierl, C. Thompson, C. J. Williamson, S. C. Wofsy, P. Yu and J. P. Schwarz, Science, 2023, 379, 815–820 CrossRef CAS PubMed.
- G. D'Angelo, S. Guimond, J. Reisner, D. A. Peterson and M. Dubey, J. Geophys. Res.: Atmos., 2022, 127, 1–20 Search PubMed.
- D. A. Peterson, J. R. Campbell, E. J. Hyer, M. D. Fromm, G. P. Kablick, J. H. Cossuth and M. T. DeLand, npj Clim. Atmos. Sci., 2018, 1, 1–8 CrossRef CAS.
- D. A. Peterson, M. D. Fromm, R. H. McRae, J. R. Campbell, E. J. Hyer, G. Taha, C. P. Camacho, G. P. Kablick, C. C. Schmidt and M. T. DeLand, npj Clim. Atmos. Sci., 2021, 4(1), 16 CrossRef.
- K. Christian, J. Wang, C. Ge, D. Peterson, E. Hyer, J. Yorks and M. McGill, Geophys. Res. Lett., 2019, 46, 10061–10071 CrossRef.
- P. Yu, O. B. Toon, C. G. Bardeen, Y. Zhu, K. H. Rosenlof, R. W. Portmann, T. D. Thornberry, R.-S. Gao, S. M. Davis, E. T. Wolf, J. de Gouw, D. A. Peterson, M. D. Fromm and A. Robock, Science, 2019, 365, 587–590 CrossRef CAS PubMed.
- P. Yu, S. M. Davis, O. B. Toon, R. W. Portmann, C. G. Bardeen, J. E. Barnes, H. Telg, C. Maloney and K. H. Rosenlof, Geophys. Res. Lett., 2021, 48(1), 9 Search PubMed.
- D. R. Allen, M. D. Fromm, G. P. Kablick and G. E. Nedoluha, J. Atmos. Sci., 2020, 77, 4297–4316 Search PubMed.
- G. P. Kablick, D. R. Allen, M. D. Fromm and G. E. Nedoluha, Geophys. Res. Lett., 2020, 47(1), 9 Search PubMed.
- S. Khaykin, B. Legras, S. Bucci, P. Sellitto, L. Isaksen, F. Tencé, S. Bekki, A. Bourassa, L. Rieger, D. Zawada, J. Jumelet and S. Godin-Beekmann, Communications Earth and Environment, 2020, 1(1), 12 CrossRef.
- S. Das, P. R. Colarco, L. D. Oman, G. Taha and O. Torres, Atmos. Chem. Phys., 2021, 21, 12069–12090 CrossRef CAS.
- M. D. Fromm, G. P. Kablick, D. A. Peterson, R. A. Kahn, V. J. Flower and C. J. Seftor, J. Geophys. Res.: Atmos., 2021, 126(1), 25 Search PubMed.
- H. Lestrelin, B. Legras, A. Podglajen and M. Salihoglu, Atmos. Chem. Phys., 2021, 21, 7113–7134 CrossRef CAS.
- A. K. Kochanski, D. V. Mallia, M. G. Fearon, J. Mandel, A. H. Souri and T. Brown, J. Geophys. Res.: Atmos., 2019, 124, 9099–9116 CrossRef.
- R. C. Malone, L. H. Auer, G. A. Glatzmaier, M. C. Wood and O. B. Toon, J. Geophys. Res., 1986, 91, 1039–1053 CrossRef.
- G. D. Virgilio, J. P. Evans, S. A. P. Blake, M. Armstrong, A. J. Dowdy, J. Sharples and R. McRae, Geophys. Res. Lett., 2019, 46, 8517–8526 CrossRef.
- O. B. Toon, R. P. Turco, A. Robock, C. Bardeen, L. Oman and G. L. Stenchikov, Atmos. Chem. Phys., 2007, 7, 1973–2002 CrossRef CAS.
- O. B. Toon, C. G. Bardeen, A. Robock, L. Xia, H. Kristensen, M. McKinzie, R. J. Peterson, C. S. Harrison, N. S. Lovenduski and R. P. Turco, Sci. Adv., 2019, 5(1), 13 Search PubMed.
- A. Robock, L. Oman, G. L. Stenchikov, O. B. Toon, C. Bardeen and R. P. Turco, Atmos. Chem. Phys., 2007, 7, 2003–2012 CrossRef CAS.
- R. P. Turco, O. B. Toon, T. P. Ackerman, J. B. Pollack and C. Sagan, Science, 1983, 222, 1283–1292 CrossRef CAS PubMed.
- J. Coupe, C. G. Bardeen, A. Robock and O. B. Toon, J. Geophys. Res.: Atmos., 2019, 124, 8522–8543 CrossRef.
- M. J. Mills, O. B. Toon, J. Lee-Taylor and A. Robock, Earth's Future, 2014, 2, 161–176 CrossRef CAS.
- J. Jagermeyr, A. Robock, J. Elliott, C. Muller, L. Xia, N. Khabarov, C. Folberth, E. Schmid, W. Liu, F. Zabel, S. S. Rabin, M. J. Puma, A. Heslin, J. Franke, I. Foster, S. Asseng, C. G. Bardeen, O. B. Toon and C. Rosenzweig, Proc. Natl. Acad. Sci. U. S. A., 2020, 117, 7071–7081 CrossRef CAS PubMed.
- L. Radke, A. Hegg, P. Hobbs and J. Penner, Atmos. Res., 1995, 38, 315–332 CrossRef CAS.
- P. Dziekan, M. Waruszewski and H. Pawlowska, Geosci. Model Dev., 2019, 12, 2587–2606 CrossRef.
- C. Y. Lim, D. H. Hagan, M. M. Coggon, A. R. Koss, K. Sekimoto, J. D. Gouw, C. Warneke, C. D. Cappa and J. H. Kroll, Atmos. Chem. Phys., 2019, 19, 12797–12809 CrossRef CAS.
- C. Warneke, J. P. Schwarz, J. Dibb, O. Kalashnikova, G. Frost, J. A. Saad, S. S. Brown, W. A. Brewer, A. Soja, F. C. Seidel, R. A. Washenfelder, E. B. Wiggins, R. H. Moore, B. E. Anderson, C. Jordan, T. I. Yacovitch, S. C. Herndon, S. Liu, T. Kuwayama, D. Jaffe, N. Johnston, V. Selimovic, R. Yokelson, D. M. Giles, B. N. Holben, P. Goloub, I. Popovici, M. Trainer, A. Kumar, R. B. Pierce, D. Fahey, J. Roberts, E. M. Gargulinski, D. A. Peterson, X. Ye, L. H. Thapa, P. E. Saide, C. H. Fite, C. D. Holmes, S. Wang, M. M. Coggon, Z. C. J. Decker, C. E. Stockwell, L. Xu, G. Gkatzelis, K. Aikin, B. Lefer, J. Kaspari, D. Griffin, L. Zeng, R. Weber, M. Hastings, J. Chai, G. M. Wolfe, T. F. Hanisco, J. Liao, P. C. Jost, H. Guo, J. L. Jimenez and J. Crawford, J. Geophys. Res.: Atmos., 2023, 128(1), 62 Search PubMed.
- L. Kleinman and A. J. Sedlacek, Biomass Burning Observation Project (BBOP) Final Campaign Report, 2016 Search PubMed.
- E. Fisher, J. Collett, A. Sullivan, P. DeMoot, S. Murphy, J. Thornton, F. Flocke, S. van den Heever, D. Toohey and L. Hu, Western Wildfire Experiment for Cloud Chemistry, Aerosol Absorption and Nitrogen, 2017 Search PubMed.
- E. NASA/NOAA, WE-CAN: Low Rate (LRT - 1 Sps) Navigation, State Parameter, and Microphysics Flight-Level Data, Version 1.1 (Version 1.1) [Data Set], 2023 Search PubMed.
- B. Schmid, J. M. Tomlinson, J. M. Hubbe, J. M. Comstock, F. Mei, D. Chand, M. S. Pekour, C. D. Kluzek, E. Andrews, S. C. Biraud and G. M. McFarquhar, Bull. Am. Meteorol. Soc., 2014, 95, 723–742 CrossRef.
- R. Zaveri, W. J. Shaw, D. J. Cziczo, B. Schmid, R. a. Ferrare, M. L. Alexander, M. Alexandrov, R. J. Alvarez, W. P. Arnott, D. B. Atkinson, S. Baidar, R. M. Banta, J. C. Barnard, J. Beranek, L. K. Berg, F. Brechtel, W. a. Brewer, J. F. Cahill, B. Cairns, C. D. Cappa, D. Chand, S. China, J. M. Comstock, M. K. Dubey, R. C. Easter, M. H. Erickson, J. D. Fast, C. Floerchinger, B. a. Flowers, E. Fortner, J. S. Gaffney, M. K. Gilles, K. Gorkowski, W. I. Gustafson, M. Gyawali, J. Hair, R. M. Hardesty, J. W. Harworth, S. Herndon, N. Hiranuma, C. Hostetler, J. M. Hubbe, J. T. Jayne, H. Jeong, B. T. Jobson, E. I. Kassianov, L. I. Kleinman, C. Kluzek, B. Knighton, K. R. Kolesar, C. Kuang, A. Kubátová, a. O. Langford, A. Laskin, N. Laulainen, R. D. Marchbanks, C. Mazzoleni, F. Mei, R. C. Moffet, D. Nelson, M. D. Obland, H. Oetjen, T. B. Onasch, I. Ortega, M. Ottaviani, M. Pekour, K. a. Prather, J. G. Radney, R. R. Rogers, S. P. Sandberg, A. Sedlacek, C. J. Senff, G. Senum, A. Setyan, J. E. Shilling, M. Shrivastava, C. Song, S. R. Springston, R. Subramanian, K. Suski, J. Tomlinson, R. Volkamer, H. W. Wallace, J. Wang, a. M. Weickmann, D. R. Worsnop, X.-Y. Yu, A. Zelenyuk and Q. Zhang, Atmos. Chem. Phys., 2012, 12, 7647–7687 CrossRef CAS.
- D. Cziczo, Understanding the Effect of Aerosol Properties on Cloud Droplet Formation during TCAP Field Campaign Report, 2016 Search PubMed.
- A. Varble, S. Nesbitt, P. Salio, E. Avila, P. Borque, P. DeMott, G. McFarquhar, S. van den Heever, E. Zipser, D. Gochis, R. Houze, M. Jensen, P. Kollias, S. Kreidenweis, R. Leung, K. Rasmussen, D. Romps and C. Williams, Cloud, Aerosol, and Complex Terrain Interactions (CACTI) Field Campaign Report, 2019 Search PubMed.
- J. Uin, Ultra-High-Sensitivity Aerosol Spectrometer (UHSAS) Instrument Handbook, 2016 Search PubMed.
- Y. Cai, D. C. Montague, W. Mooiweer-Bryan and T. Deshler, J. Aerosol Sci., 2008, 39, 759–769 CrossRef CAS.
- E. S. Cross, J. G. Slowik, P. Davidovits, J. D. Allan, D. R. Worsnop, J. T. Jayne, D. K. Lewis, M. Canagaratna and T. B. Onasch, Aerosol Sci. Technol., 2007, 41, 343–359 CrossRef CAS.
- A. Zelenyuk, D. Imre, J. H. Han and S. Oatis, Anal. Chem., 2008, 80, 1401–1407 CrossRef CAS PubMed.
- B. J. Turpin and H. J. Lim, Aerosol Sci. Technol., 2001, 35, 602–610 CrossRef CAS.
- A. Sedlacek, Single-Particle Soot Photometer (SP2) Instrument Handbook, 2017 Search PubMed.
- I. J. Simpson, D. R. Blake, N. J. Blake, S. Meinardi, B. Barletta, S. C. Hughes, L. T. Fleming, J. H. Crawford, G. S. Diskin, L. K. Emmons, A. Fried, H. Guo, D. A. Peterson, A. Wisthaler, J.-H. Woo, J. Barré, B. Gaubert, J. Kim, M. J. Kim, Y. Kim, C. Knote, T. Mikoviny, S. E. Pusede, J. R. Schroeder, Y. Wang, P. O. Wennberg and L. Zeng, Elementa: Science of the Anthropocene, 2020, 8(1), 29 Search PubMed.
- S. Compernolle, K. Ceulemans and J.-F. Müller, Atmos. Chem. Phys., 2011, 11, 9431–9450 CrossRef CAS.
- N. M. Donahue, S. A. Epstein, S. N. Pandis and A. L. Robinson, Atmos. Chem. Phys., 2011, 11, 3303–3318 CrossRef CAS.
- N. M. Donahue, J. H. Kroll, S. N. Pandis and A. L. Robinson, Atmos. Chem. Phys., 2012, 12, 615–634 CrossRef CAS.
- R. Ramani, J. Reisner and S. Shkoller, J. Comput. Phys., 2019, 387, 45–80 CrossRef.
- A. Fierro and J. Reisner, J. Atmos. Sci., 2011, 68, 477–494 CrossRef.
- E. B. Wiggins, B. E. Anderson, M. D. Brown, P. Campuzano-Jost, G. Chen, J. Crawford, E. C. Crosbie, J. Dibb, J. P. DiGangi, G. S. Diskin, M. Fenn, F. Gallo, E. M. Gargulinski, H. Guo, J. W. Hair, H. S. Halliday, C. Ichoku, J. L. Jimenez, C. E. Jordan, J. M. Katich, J. B. Nowak, A. E. Perring, C. E. Robinson, K. J. Sanchez, M. Schueneman, J. P. Schwarz, T. J. Shingler, M. A. Shook, A. J. Soja, C. E. Stockwell, K. L. Thornhill, K. R. Travis, C. Warneke, E. L. Winstead, L. D. Ziemba and R. H. Moore, J. Geophys. Res.: Atmos., 2021, 126(1), 21 Search PubMed.
- R. R. Linn, K. Anderson, J. L. Winterkamp, A. Brooks, M. Wotton, J.-L. Dupuy, F. Pimont and C. Edminster, Can. J. For. Res., 2012, 42, 879–898 CrossRef.
- J. J. Colman and R. R. Linn, Int. J. Wildland Fire, 2007, 16, 493–502 CrossRef.
- R. R. Linn, J. L. Winterkamp, J. J. Colman, C. Edminster and J. D. Bailey, Int. J. Wildland Fire, 2005, 14, 37–48 CrossRef.
- A. J. Josephson, D. Castaño, E. Koo and R. R. Linn, Fire Technol., 2020, 1, 29 Search PubMed.
- G. N. Theodoritsi and S. N. Pandis, Atmos. Chem. Phys., 2019, 19, 5403–5415 CrossRef CAS.
- L. E. Hatch, R. J. Yokelson, C. E. Stockwell, P. R. Veres, I. J. Simpson, D. R. Blake, J. J. Orlando and K. C. Barsanti, Atmos. Chem. Phys., 2017, 17, 1471–1489 CrossRef CAS.
- J. Ditas, N. Ma, Y. Zhang, D. Assmann, M. Neumaier, H. Riede, E. Karu, J. Williams, D. Scharffe, Q. Wang, J. Saturno, J. P. Schwarz, J. M. Katich, G. R. McMeeking, A. Zahn, M. Hermann, C. A. Brenninkmeijer, M. O. Andreae, U. Pöschl, H. Su and Y. Cheng, Proc. Natl. Acad. Sci. U. S. A., 2018, 115, E11595–E11603 CrossRef CAS PubMed.
- A. A. May, G. R. McMeeking, T. Lee, J. W. Taylor, J. S. Craven, I. Burling, A. P. Sullivan, S. Akagi, J. L. Collett, M. Flynn, H. Coe, S. P. Urbanski, J. H. Seinfeld, R. J. Yokelson and S. M. Kreidenweis, J. Geophys. Res., 2014, 119, 11826–11849 CrossRef CAS.
- S. K. Akagi, R. J. Yokelson, C. Wiedinmyer, M. J. Alvarado, J. S. Reid, T. Karl, J. D. Crounse and P. O. Wennberg, Atmos. Chem. Phys., 2011, 11, 4039–4072 CrossRef CAS.
- K. Adachi, J. E. Dibb, E. Scheuer, J. M. Katich, J. P. Schwarz, A. E. Perring, B. Mediavilla, H. Guo, P. Campuzano-Jost, J. L. Jimenez, J. Crawford, A. J. Soja, N. Oshima, M. Kajino, T. Kinase, L. Kleinman, A. J. Sedlacek, R. J. Yokelson and P. R. Buseck, J. Geophys. Res.: Atmos., 2022, 127(1), 22 Search PubMed.
- L. A. Garofalo, M. A. Pothier, E. J. Levin, T. Campos, S. M. Kreidenweis and D. K. Farmer, ACS Earth Space Chem., 2019, 3, 1237–1247 CrossRef CAS.
- V. Selimovic, R. J. Yokelson, G. R. McMeeking and S. Coefield, Atmos. Chem. Phys., 2019, 19, 3905–3926 CrossRef.
- A. L. Hodshire, A. Akherati, M. J. Alvarado, B. Brown-Steiner, S. H. Jathar, J. L. Jimenez, S. M. Kreidenweis, C. R. Lonsdale, T. B. Onasch, A. M. Ortega and J. R. Pierce, Environ. Sci. Technol., 2019, 53, 10007–10022 CrossRef CAS PubMed.
- N. A. June, A. L. Hodshire, E. B. Wiggins, E. L. Winstead, C. E. Robinson, K. L. Thornhill, K. J. Sanchez, R. H. Moore, D. Pagonis, H. Guo, P. Campuzano-Jost, J. L. Jimenez, M. M. Coggon, J. M. Dean-Day, T. P. Bui, J. Peischl, R. J. Yokelson, M. J. Alvarado, S. M. Kreidenwis, S. H. Jathar and J. R. Pierce, Atmos. Chem. Phys., 2022, 22, 12803–12825 CrossRef CAS.
Footnote |
| † Electronic supplementary information (ESI) available: Contains details on the data from the flight campaigns and the organic vapor gas-to-particle partitioning parameterization. See DOI: https://doi.org/10.1039/d3ea00130j |
| This journal is © The Royal Society of Chemistry 2024 |