 Open Access Article
Creative Commons Attribution 3.0 Unported Licence
Covalent triazine framework modified with coordinatively-unsaturated Co or Ni atoms for CO2 electrochemical reduction†
Panpan
Su‡
a,
Kazuyuki
Iwase‡
b,
Takashi
Harada
 a,
Kazuhide
Kamiya
 *acd and
Shuji
Nakanishi
*ac
aResearch Center for Solar Energy Chemistry, Osaka University, 1-3 Machikaneyama, Toyonaka, Osaka 560-8531, Japan. E-mail: kamiya@chem.es.osaka-u.ac.jp; nakanishi@chem.es.osaka-u.ac.jp
bDepartment of Applied Chemistry, The University of Tokyo, 7-3-1 Hongo, Bunkyo-ku, Tokyo 113-8656, Japan
cGraduate School of Engineering Science, Osaka University, 1-3 Machikaneyama, Toyonaka, Osaka 560-8531, Japan
dJapan Science and Technology Agency (JST), PRESTO, 4-1-8 Honcho, Kawaguchi, Saitama 332-0012, Japan
First published on 19th March 2018
Abstract
The electrochemical reduction of carbon dioxide (CO2) has attracted considerable attention as a means of maintaining the carbon cycle. This process still suffers from poor performance, including low faradaic efficiencies and high overpotential. Herein, we attempted to use coordination number as a control parameter to improve the electrocatalytic performance of metal species that have previously been thought to have no CO2 reduction activity. Covalent triazine frameworks (CTF) modified with coordinatively-unsaturated 3d metal atoms (Co, Ni or Cu) were developed for efficient electroreduction of CO2. Co-CTF and Ni-CTF materials effectively reduced CO2 to CO from −0.5 V versus RHE. The faradaic efficiency of the Ni-CTF during CO formation reached 90% at −0.8 V versus RHE. The performance of Ni-CTF is much higher than that of the corresponding metal-porphyrin (using tetraphenylporphyrin; TPP). First principles calculations demonstrated that the intermediate species (adsorbed COOH) was stabilized on the metal atoms in the CTF due to the low-coordination structure of this support. Thus, the free energy barriers for the formation of adsorbed COOH on the metal atoms in the CTF supports were lower than those on the TPP supports.
Introduction
The electrochemical carbon dioxide reduction reaction (CO2RR) in aqueous media is a promising approach to closing the carbon cycle, and as such has attracted significant attention.1 The reduction of CO2 to CO summarized in the following equations is an important step in the CO2RR and represents the first two-electron reaction.2| CO2(g) + * + H+(aq) + e− ↔ COOH* | (1) |
| COOH* + H+(aq) + e− ↔ CO* + H2O | (2) |
| CO* ↔ CO(g) + * | (3) |
There are two important factors determining the adsorption energies of intermediates on electrocatalysts. The first is the metal species in the catalyst i.e. transition metals at active sites having a greater number of d-electrons tend to lower the adsorption energy.3 For this reason, the effects of metal species on the CO2RR have been systematically investigated using tetraphenylporphyrin (TPP),2c,4 which can serve as a platform to support various metals via coordination bonds. It is known that cobalt modified-TPP (Co-TPP) has an appropriate bond strength with COOH* and thus shows efficient CO2RR activity, whereas the catalytic activities of nickel (Ni) or copper (Cu) modified-TPP are low because the COOH* binding energy is insufficient.4c–e The second critical factor is the coordination structure (or the coordination number) of the metal.5 First principles calculations have demonstrated that a decrease in coordination number of bulk Pt or Cu leads to an increase in the CO* binding strength,5a,b thus affecting the CO2RR activity. Therefore, it may be possible to use the coordination number as a control parameter to improve the performance of metal species that have previously been thought to have no CO2RR activity.
Covalent triazine frameworks (CTF), consisting of microporous conjugated polymers with 1,3,5-triazine linker units,6 are promising platforms for metal species with coordination unsaturation. Our group has previously reported that the adsorption energies of dioxygen and nitrogen oxides on Cu-CTF are larger than those on Cu-TPP or bulk Cu, respectively.7 This increase in the adsorption energy was attributed to the coordinatively unsaturated nature of the Cu atoms in the CTF. In the present work, we synthesized CTFs modified with coordinatively-unsaturated 3d metal atoms as electrocatalysts for CO2RR with the aim of eliciting the potential performance of metals that have, to date, been regarded as inactive.
Results and discussion
The CTF was synthesized via the polymerization of 2,6-dicyanopyridine in the presence of conductive carbon particles (CPs; KetchenBlack EC600JD, please see the synthesis part) in the same manner as described in our previous reports.7,8 The obtained CTF was subsequently impregnated with aqueous solutions of various divalent metal chlorides to obtain M(II)-CTF (M = Co, Ni or Cu). The full details of the synthesis are provided in the Experimental section. The elemental analyses were conducted by semi-quantitative X-ray photoelectron spectroscopy (XPS) and inductively coupled plasma atomic emission spectroscopy (ICP-AES) (Tables S1 and S2†). The CTF layer was uniformly polymerized on CPs, which has been proven by N 1s XPS spectra and transmission electron microscopy (TEM) energy dispersive X-ray (EDX) mapping in our previous reports.8b In addition, the SEM pictures for CTF (Fig. S1†) show that the particle size of 20–80 nm, which corresponded to the size of the CPs, also revealed that CTF was well mixed with CPs.7,8 The powder XRD patterns for CTF (Fig. S2†) indicated that our M-CTFs have amorphous structure, which is consistent with the reported CTF originated from 2,6-dicyanopyridine.6a,d The high-resolution TEM images (Fig. S3†) suggested that no metal or metal oxide nanoparticles was formed on M-CTF, which are consistent with the previous results.7a,8b The nitrogen adsorption–desorption isotherms indicates that CTF and Ni-CTF have a hierarchical pore system composed of micro- and mesopores (see Fig. S4† for the detail).Electronic and structural characterizations of the metal sites in M-CTF specimens were conducted using extended X-ray absorption fine structure (EXAFS) analyses. Previously, we demonstrated that the Cu atoms in Cu-CTF are in the form of Cu(II) and have a lower first coordination number of 3.4 compared to the value of 4 in Cu-TPP.7b The present study focused on the characterization of Ni-CTF (as presented herein) and Co-CTF (as presented in ESI, see Fig. S6† and the associated caption). Fig. S5† shows the Ni–K XANES spectra for Ni-CTF and the reference samples. The XANES absorption edge corresponding to 1s → 4p transitions9 for Ni-CTF located at 8333 eV, which is consistent with that for NiO and Ni(II)-TPP. These results indicated that the Ni(II) valence state was dominant in Ni-CTF. Similarly, Fig. S6a† indicated that the Co(II) valence state was dominant in Co-CTF.
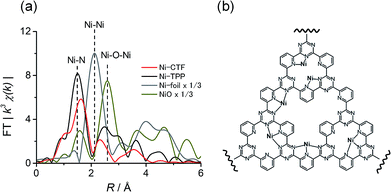
We also acquired EXAFS data to assess the molecular structure of the Ni-CTF (Fig. 1a). Ni-CTF shows one strong peak at 1.7 Å, whereas no strong peak corresponds to Ni–Ni bond and Ni–O–Ni bonds were not observed.10 We previously demonstrated that no metal species were found on CPs that were treated with MCl2 solutions,7a indicating that metal species were anchored on CTFs. In addition, the TEM results showed that no NiO nanoparticle was formed. Thus, the first coordination sphere (the peak at 1.7 Å) was composed of N atoms of CTF. The curve fitting for EXAFS spectra were performed for Ni-CTF (detail see Table S3† and its captions). The coordination number of N atoms in the first coordination sphere of Ni-CTF is 3.4. These data indicate that the Ni atoms in the Ni-CTF were individually isolated and had an unsaturated first coordination sphere in the pores of the CTF (Fig. 1b), identical result is also obtained for Co-CTF (Fig. S6†).
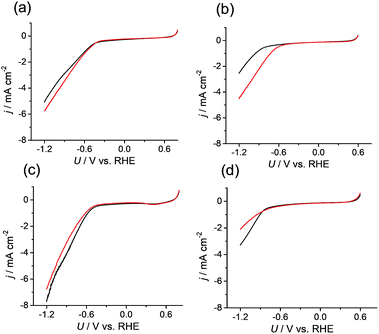
Because the data confirmed that the metal centers in the M-CTF had lower coordination numbers than those in the corresponding M-TPP, we next evaluated and compared the CO2RR activities of these samples. Changes in current density (j) at different potentials (U) were examined using M-CTF electrodes in Ar-saturated phosphate buffer solutions (PBS, pH 6.8) and CO2-saturated KHCO3 solutions (pH 6.8). As shown in Fig. 2b, the cathodic current produced by the Ni-CTF was significantly increased when CO2 was present in the electrolyte. The onset potential for the reduction reaction in CO2-saturated solutions was −0.48 V versus RHE, whereas a current attributed solely to the hydrogen evolution reaction (HER) was observed from −0.72 V vs. RHE in the absence of CO2. In contrast, little or no increase in the reduction current in the presence of CO2 was observed when using the Co-CTF, Cu-CTF or bare CTF (Fig. 2b, c and d, respectively). The reduction peak of metal centers was not observed for M-CTF in the absence of CO2. This is likely because these peaks were overlapped with the HER current.
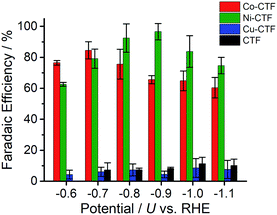
CVs alone cannot provide conclusive evidence for CO2 reduction because the different electrolytes (PBS and KHCO3 solutions) were used for the comparison. Thus, subsequently, we quantitatively analysed the CO2 reduction products in the gas phase using gas chromatography-mass spectrometry (GC-MS). A representative GC-MS chart is shown in Fig. S7.† The effects of potential on the faradaic efficiency (FE) of the CO generation reaction using M-CTFs in neutral solutions are summarized in Fig. 3. At the appropriate potential, the main product of the electrolysis in the presence of CO2 when employing either Ni-CTF or Co-CTF was CO, whereas almost no CO evolution was observed with the Cu-CTF or bare CTF throughout the entire experimental potential region. In particular, the Ni-CTF exhibited CO formation with a FE exceeding 90% over the range of −0.8 to −0.9 V. It should be noted that the extent of CO evolution by the bare CTF was almost negligible, indicating that the Ni/Co sites in the CTF served as the catalytic centers. In contrast, the FE of Cu-CTF was similar with that of bare CTF, meaning that the FE of Cu-CTF was affected by the CO2RR activity of CTF frameworks to some extent. GC-MS and nuclear magnetic resonance (NMR, Fig. S8†) data showed that H2 was the other major product in all cases, along with trace amounts of methane (<0.5%). Note that only H2 was observed in the absence of CO2, indicating that the CO was generated not from the degradation of CTF but from CO2RR (Fig. S7†). The partial current density values (Fig. 4) during the CO generation using Ni-CTF and Co-CTF (3–4 A g−1) were equivalent to those reported for a carbon-supported Au catalyst and metal-modified nitrogen-doped carbon catalysts.11 The Tafel plots of M-CTF are shown in Fig. S9.† The slope of Tafel plots for Ni-CTF and Co-CTF is 154 mV dec−1 and 162 mV dec−1, respectively. In contrast, the Tafel slopes for Cu-CTF (305 mV dec−1) and CTF (272 mV dec−1) were much larger than that of Ni-CTF and Co-CTF, implying the inefficiency of Cu-CTF and CTF for CO2 electrochemical reduction. The electrocatalytic stability of Ni-CTF was evaluated at −0.65 V (vs. RHE) for 3 h in CO2 saturated KHCO3 electrolyte. As Fig. S10† shows, the FE for CO displayed almost negligible change, while the reduction current exhibited mildly decreased. As the stability for our catalyst is not enough for the real application, further experiments to improve the stability by choosing the appropriate framework are ongoing in our laboratory.
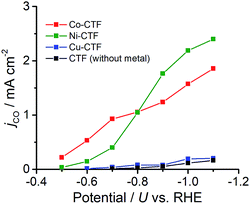 | ||
| Fig. 4 Partial current density values during the CO generation reaction using Co-CTF (red), Ni-CTF (green), Cu-CTF (blue) and CTF (black). | ||
For comparison purposes, the CO2 reduction activities of M-TPP were also tested. In the present work, the M-TPP samples were adsorbed on carbon nanoparticles prior to electro-chemical measurements. An increase in the cathodic current from −0.5 V was observed when using Co-TPP in the presence of CO2, whereas the Ni- and Cu-TPP showed no such increase (Fig. S11†). The FE and partial current density values of the CO generation using M-TPP are shown in Fig. S12a and b,† respectively. The partial current density values in association with Co, Ni and Cu-TPP were 1.3, 0.04 and 0.04 mA cm−2 at −0.9 V vs. RHE, respectively. The major product resulting from the use of Ni- and Cu-TPP was H2 at all potentials. Therefore, only Co-TPP exhibited effective CO2RR activity among these three TPPs, a result that is consistent with previous studies.4b–e
The origin of the differences in the activities during CO2 reduction to CO of the M-CTF and M-TPP were subsequently examined, employing DFT calculations. After structural optimization of M-CTF, the 3-coordination metal site was the most stable, as represented in Fig. S13† (see the Experimental section for the detail). Thus, the DFT results also revealed that the low coordination metal sites were stabilized by the CTF frameworks, which is basically consistent with the EXFAS results. Fig. 5 and Table S4† shows the free energy diagrams for the electrochemical reduction of CO2 to CO on M-CTF and M-TPP at 0 V and −0.87 V vs. RHE, based on the computational hydrogen electrode model.2g,11b,12 Notably, an increase in the number of d-electrons of the transition metal representing the active sites increased the Gibbs free energy change (ΔG) value associated with the formation of COOH* and CO* in the case of both the CTFs and TPPs (although the energy change was in the order of Co < Ni < Cu). These data are consistent with results reported for work with M-porphyrins in association with the CO2RR and also the HER and oxygen reduction reaction.3,4c,e The rate determining step when using these materials is evidently the first reduction reaction: the formation of COOH* (reaction (1)). The free energy barrier of this step depends on the applied potential,2g,11b,12a and so we calculated the CO2 limiting potential (UL (CO2)) for each catalyst, defined as the potential at which all elementary steps become exergonic, as summarized in Table S5.† The UL (CO2) obtained with the Co-TPP was approximately −0.6 V vs. RHE, whereas the values for the Cu-TPP and Ni-TPP were much more negative (<−2.0 V). Therefore, a low energy barrier to the formation of COOH* apparently resulted in the high CO2 reduction activity exhibited by the Co-TPP. In addition, the UL (CO2) values of the CTFs were smaller than those of the corresponding TPP. In particular, the overall reaction pathway on the Ni-CTF becomes exergonic at −0.87 V vs. RHE (Fig. 5a), which essentially coincides with the potential range at which CO formation was observed on the same material. In contrast, the UL (CO2) of the Cu-CTF (−1.2 V) was 0.33 V more negative, and so the formation of COOH* is still endothermic at −0.87 V on the latter. We expect that Cu-based catalysts with a further low-coordination number (less than 3) exhibit efficient CO2RR activity.
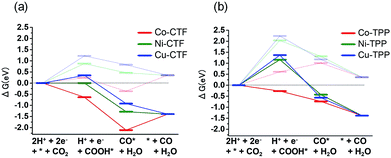 | ||
| Fig. 5 Free energy diagrams for CO2 reduction to CO on Co (red), Ni (green) and Cu (blue)-modified (a) CTF, and (b) TPP at 0 V (pale lines) and −0.87 V (dark lines). | ||
The partial current densities during CO generation are plotted against ΔG (COOH*) in Fig. 6, clearly indicating that the low ΔG (COOH*) is important for high CO2RR activity, and also showing that the Ni active sites appear quite high on the plot of CO2RR activity upon changing the ligand from TPP to CTF. That is, by transitioning the ligand from TPP to CTF, a lower ΔG (COOH*) was obtained such that Ni became the optimal metal species. In the case of the Co-CTF, the release of CO (reaction (3)), which is independent of the applied potential, was an endothermic reaction. As mentioned in the Introduction, the rate-determining step for CO2RR, which depends on the adsorption energy of CO and COOH, is the reaction (1) or the reaction (3). However, the existence of the scaling relationship of them does not allow us to independently control these two adsorption energies.2e,f,13 Therefore, on the basis of the DFT calculations, there should be the volcano-type relation accompanied with the single peak which locates between Co-CTF and Co-TPP in Fig. 6. The rate-determining step can be evaluated by the position in the volcano plot against the peak. Co-CTF has lower ΔG (COOH*) than the optimal value (the peak of the volcano plot), resulting that the rate-determining step was the reaction (3) (CO desorption). Thus, in contrast to Cu-based catalysts, Co based catalysts with a further low-coordination number, which bind CO more strongly, should show poor CO2RR activity. In contrast, the rate-determining step of the other catalysts in the higher ΔG (COOH*) side was the reaction (1) (CO2 activation). To complete the wide range of volcano-type curve, the investigation of CO2RR activity of catalysts with different metal species and coordination numbers is under progress in our laboratory.
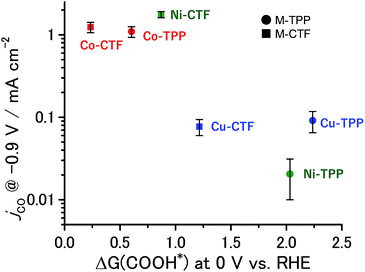 | ||
| Fig. 6 Relationship between ΔG (COOH*) at 0 V and jco at −0.9 V. The error bar represents the standard deviation from three experimental trial. | ||
At this point, we can explain the origin of the lower ΔG (COOH) values exhibited by the M-CTF compared to those for the corresponding M-TPP. The EXAFS results demonstrate that the metal atoms in the CTF have unsaturated coordination structures (that is, low coordination numbers, as shown in Fig. 1b), compared with the metals in the porphyrin-like ligands. Calle-Vallejo and co-authors have used first principles calculations to show that metal sites with lower coordination values have higher adsorption energies because they possess numerous accessible d-orbitals as well as low steric hindrance.5a,c,d Therefore, metal atoms in CTF with low coordination numbers can more strongly bind small molecules than those in N4 macrocycles, resulting in a low free energy barrier to the first reaction step.
Conclusions
In the present work, we developed a novel route to precisely tune the adsorption energies of critical intermediate species for efficient CO2RR through the modulation of the coordination number of active centers. The Ni and Co-CTF effectively reduced CO2 to CO, whereas, among the M-TPP, only the Co-TPP showed any activity. DFT calculations demonstrated that the free energy barrier of the first reduction step, the formation of adsorbed COOH, was decreased by changing the ligands from TPP to CTF. The lower coordination metal sites were stabilized on the CTF due to their rigid framework, allowing COOH* species to be absorbed at these low coordination sites. Consequently, the Ni-based catalyst obtained using CTF rather than TPP ligands was situated at a higher position on the volcano-like CO2RR activity plot. Thus, our work provides a new avenue to design efficient catalysts for CO2RR.Experimental
Synthesis of CTF
Each CTF was prepared using essentially the same method described in our previous publications.7 Briefly, 2,6-dicyanopyridine (64.5 mg, Koei Kagaku) and Ketjen Black EC600JD (64.5 mg, Lion Corp.) were mixed with ZnCl2 (6.82 g, Wako) in a glass vacuum tube and then heated to 400 °C at 3.3 °C min−1 and held at that temperature for 40 h. The resulting powder was washed with deionized water, tetrahydrofuran (THF, Wako), HCl (1 M, Wako) and aqueous ammonia (1 M, Wako). The obtained CTF was dispersed in a 10 mM aqueous solution of MCl2 (M = Co, Ni or Cu) and stirred at 80 °C for 3 h. Subsequently, the product was collected by centrifugation and thoroughly washed with deionized water to remove any unbound metal salt, followed by drying at 60 °C in a vacuum oven for 1 day.Loading of M-TPP onto carbon particles
Here, we take Co-TPP electrode as an example to show the preparation procedure of M-TPP electrode. Firstly, Co-TPP (9.5 mg) and EC600JD (90 mg) were dispersed in 20 mL DMF solvent using an ultrasonic bath, and then, the mixture was dried at 80 °C with a rotary evaporator. The metal concentration of the mixture of M-TPP and EC600JD is the same with that of the corresponding M-CTF (determined by the XPS measurements). These loaded M-TPP are denoted as M-TPP.Characterizations
XPS (Axis Ultra, Kratos Analytical Co.) spectra were obtained using monochromatic Al Kα X-rays at hν = 1486.6 eV. XAFS data were acquired by the transmission method using the hard X-ray BL01B01 beam line at the SPring-8 facility, Japan. Transmitted X-rays were detected using a double-crystal Si (111) monochromator. Surface inspection was carried out with a scanning electron microscope (SEM; JEOL, JSM-7600F) and high-resolution transmission electron microscope (TEM; Hitachi, H-9000NAR). XANES spectra and EXAFS were analysed using Athena, ARTEMIS and FEFF6L software. A powder X-ray diffraction (XRD) pattern was recorded on a PANalytical X'Pert PRO diffractometer with Cu Kα radiation. Metal content was determined by inductively coupled plasma atomic emission spectroscopy (ICP-AES; Optima 8300, PerkinElmer). The N2 adsorption–desorption isotherm was obtained by a Micromeritics 3 Flex at 77 K.Electrochemical measurements
Electrochemical measurements were performed using a Hokuto Denko Electrochemical Station (Model HZ-5000) in a two-compartment electrochemical cell (separated by a Nafion membrane) in conjunction with three electrodes. A Ag/AgCl electrode (with saturated KCl as the internal solution) and platinum wire were used as the reference and counter electrodes, respectively. Each working electrode was fabricated by dispersing 3 mg of the desired M-CTF (or CTF) and 28.5 μL Nafion (5 wt%, Aldrich) in 300 μL ethanol using an ultrasonic bath to generate a catalyst ink. A 60 μL quantity of this ink was dropped onto a glassy carbon plate (2 cm2), which was then left to dry in air at room temperature, to yield a catalyst layer with a loading of 0.3 mg cm−2. The gaseous products that accumulated in the cathodic part of the reaction cell were analyzed by GC-MS (GCMS-QP 2010 Plus, Shimadzu, Japan), calibrated using CO and H2 samples diluted with air to various concentrations. Products in liquid phase were analyzed on a Varian 500 MHz NMR spectrometer. A 0.5 mL electrolyte (0.1 M KHCO3) after electrolysis was mixed with D2O (0.1 mL) and dimethyl sulphoxide (32 μL) as internal standard.DFT calculations
Density functional theory (DFT) calculations of the adsorption energies of intermediates on the M-CTF and M-TPP were performed using the OpenMX code.14 The generalized gradient approximation of the Perdew–Burke–Ernzerhof model (GGA-PBE) was applied, and a kinetic energy cutoff of 120 Ryd was selected. The detailed structural parameters of the M-CTF can be found in our previous publication.7b The structure of CTF frameworks without metals was first relaxed. Then, we doped metal sites and relaxed the metal configuration, while the frameworks were fixed. The optimized Ni-CTF structure is shown in Fig. S13.† One COOH or CO molecules were adsorbed on one metal sites, and their configurations were relaxed to calculate the free energy diagram. To simplify the DFT calculations, we used a slab consisting of a single CTF layer as the model structure of M-CTFs. A slab model was used with a 15 Å vacuum layer between the CTF layers. Zero-point energy and entropic corrections were applied based on reported values4c,12a to convert electronic energies into Gibbs free energies. In this work, the solvation energy was not applied and a −0.24 eV correction was added to CO to compensate for a limitation of the PBE model.4c,15 Reaction free energies were calculated using the computational hydrogen electrode (CHE) model, following the same method as described in previous reports.2g,11b,12a Briefly, in this model, the chemical potential of a proton–electron pair in solution is equal to half that of a gas phase H2 molecule at 0 V vs. RHE. Thus, we utilized the following equation to apply the overpotential when calculating the free energy diagram.| G[H+ + e−] = 0.5 G[H2] − eU | (4) |
Conflicts of interest
There are no conflicts to declare.Acknowledgements
The XAFS data were acquired at the SPring-8 facility (proposal no. 2016A1120, 2016A1464, 2016B1098, 2016B1696 and 2017A1790). This research was also supported by the PRESTO Program (grant no. JPMJPR1415) of the Japan Science and Technology Agency (JST) and by a JSPS KAKENHI Program (grant no. 16J09552 and 17H04798). TEM measurement was carried out by using a facility in the Research Center for Ultra-High Voltage Electron Microscopy, Osaka University and TEM observation was supported by Dr Takao Sakata.Notes and references
- (a) C. Costentin, M. Robert and J. M. Saveant, Chem. Soc. Rev., 2013, 42, 2423 RSC; (b) J. L. Qiao, Y. Y. Liu, F. Hong and J. J. Zhang, Chem. Soc. Rev., 2014, 43, 631 RSC; (c) R. J. Lim, M. S. Xie, M. A. Sk, J. M. Lee, A. Fisher, X. Wang and K. H. Lim, Catal. Today, 2014, 233, 169 CrossRef CAS; (d) Q. Lu, J. Rosen, Y. Zhou, G. S. Hutchings, Y. C. Kimmel, J. G. Chen and F. Jiao, Nat. Commun., 2014, 5, 3243 Search PubMed.
- (a) M. Liu, Y. J. Pang, B. Zhang, P. De Luna, O. Voznyy, J. X. Xu, X. L. Zheng, C. T. Dinh, F. J. Fan, C. H. Cao, F. P. G. de Arquer, T. S. Safaei, A. Mepham, A. Klinkova, E. Kumacheva, T. Filleter, D. Sinton, S. O. Kelley and E. H. Sargent, Nature, 2016, 537, 382 CrossRef CAS PubMed; (b) C. Costentin, S. Drouet, M. Robert and J. M. Saveant, Science, 2012, 338, 90 CrossRef CAS PubMed; (c) S. Lin, C. S. Diercks, Y. B. Zhang, N. Kornienko, E. M. Nichols, Y. B. Zhao, A. R. Paris, D. Kim, P. Yang, O. M. Yaghi and C. J. Chang, Science, 2015, 349, 1208 CrossRef CAS PubMed; (d) D. Ren, B. S. H. Ang and B. S. Yeo, ACS Catal., 2016, 6, 8239 CrossRef CAS; (e) K. P. Kuhl, T. Hatsukade, E. R. Cave, D. N. Abram, J. Kibsgaard and T. F. Jaramillo, J. Am. Chem. Soc., 2014, 136, 14107 CrossRef CAS PubMed; (f) A. A. Peterson and J. K. Nørskov, J. Phys. Chem. Lett., 2012, 3, 251 CrossRef CAS; (g) K. Chan, C. Tsai, H. A. Hansen and J. K. Nørskov, ChemCatChem, 2014, 6, 1899 CrossRef CAS.
- (a) F. Calle-Vallejo, N. G. Inoglu, H.-Y. Su, J. I. Martínez, I. C. Man, M. T. M. Koper, J. R. Kitchin and J. Rossmeisl, Chem. Sci., 2013, 4, 1245 RSC; (b) F. Calle-Vallejo, J. I. Martínez, J. M. García-Lastra, J. Rossmeisl and M. T. M. Koper, Phys. Rev. Lett., 2012, 108, 116103 CrossRef CAS PubMed; (c) F. Calle-Vallejo, J. I. Martínez and J. Rossmeisl, Phys. Chem. Chem. Phys., 2011, 13, 15639 RSC.
- (a) C. Costentin, M. Robert and J. M. Saveant, Acc. Chem. Res., 2015, 48, 2996 CrossRef CAS PubMed; (b) G. F. Manbeck and E. Fujita, J. Porphyrins Phthalocyanines, 2015, 19, 45 CrossRef CAS; (c) M.-J. Cheng, Y. Kwon, M. Head-Gordon and A. T. Bell, J. Phys. Chem. C, 2015, 119, 21345 CrossRef CAS; (d) N. Sonoyama, M. Kirii and T. Sakata, Electrochem. Commun., 1999, 1, 213 CrossRef CAS; (e) V. Tripkovic, M. Vanin, M. Karamad, M. E. Björketun, K. W. Jacobsen, K. S. Thygesen and J. Rossmeisl, J. Phys. Chem. C, 2013, 117, 9187 CrossRef CAS.
- (a) H. Li, Y. Li, M. T. M. Koper and F. Calle-Vallejo, J. Am. Chem. Soc., 2014, 136, 15694 CrossRef CAS PubMed; (b) Z. Zhao, Z. Chen, X. Zhang and G. Lu, J. Phys. Chem. C, 2016, 120, 28125 CrossRef CAS; (c) F. Calle-Vallejo, J. I. Martinez, J. M. Garcia-Lastra, P. Sautet and D. Loffreda, Angew. Chem., Int. Ed., 2014, 53, 8316 CrossRef CAS PubMed; (d) F. Calle-Vallejo, D. Loffreda, M. T. M. Koper and P. Sautet, Nat. Chem., 2015, 7, 403 CrossRef CAS PubMed; (e) X. F. Ma and H. L. Xin, Phys. Rev. Lett., 2017, 118, 036101 CrossRef PubMed.
- (a) P. Kuhn, M. Antonietti and A. Thomas, Angew. Chem., Int. Ed., 2008, 47, 3450 CrossRef CAS PubMed; (b) K. Sakaushi and M. Antonietti, Bull. Chem. Soc. Jpn., 2015, 88, 386 CrossRef CAS; (c) C. E. Chan-Thaw, A. Villa, P. Katekomol, D. Su, A. Thomas and L. Prati, Nano Lett., 2010, 10, 537 CrossRef CAS PubMed; (d) R. Palkovits, M. Antonietti, P. Kuhn, A. Thomas and F. Schüth, Angew. Chem., Int. Ed., 2009, 48, 6909 CrossRef CAS PubMed; (e) P. Kuhn, A. L. Forget, D. Su, A. Thomas and M. Antonietti, J. Am. Chem. Soc., 2008, 130, 13333 CrossRef CAS PubMed; (f) P. Puthiaraj, Y.-R. Lee, S. Zhang and W.-S. Ahn, J. Mater. Chem. A, 2016, 4, 16288 RSC.
- (a) K. Iwase, T. Yoshioka, S. Nakanishi, K. Hashimoto and K. Kamiya, Angew. Chem., Int. Ed., 2015, 54, 11068 CrossRef CAS PubMed; (b) T. Yoshioka, K. Iwase, S. Nakanishi, K. Hashimoto and K. Kamiya, J. Phys. Chem. C, 2016, 120, 15729 CrossRef CAS.
- (a) R. Kamai, K. Kamiya, K. Hashimoto and S. Nakanishi, Angew. Chem., Int. Ed., 2016, 55, 13184 CrossRef CAS PubMed; (b) K. Kamiya, R. Kamai, K. Hashimoto and S. Nakanishi, Nat. Commun., 2014, 5, 5040 CrossRef CAS PubMed.
- G. Kwag, E. Park and S. Kim, Bull. Korean Chem. Soc., 2004, 25, 298 CrossRef CAS.
- (a) A. K. Agegnehu, C.-J. Pan, J. Rick, J.-F. Lee, W.-N. Su and B.-J. Hwang, J. Mater. Chem., 2012, 22, 13849 RSC; (b) A. Anspoks and A. Kuzimn, J. Non-Cryst. Solids, 2011, 357, 2604 CrossRef CAS.
- (a) W. Zhu, R. Michalsky, Ö. Metin, H. Lv, S. Guo, C. J. Wright, X. Sun, A. A. Peterson and S. Sun, J. Am. Chem. Soc., 2013, 135, 16833 CrossRef CAS PubMed; (b) W. Zhu, Y.-J. Zhang, H. Zhang, H. Lv, Q. Li, R. Michalsky, A. A. Peterson and S. Sun, J. Am. Chem. Soc., 2014, 136, 16132 CrossRef CAS PubMed; (c) A. S. Varela, N. R. Sahraie, J. Steinberg, W. Ju, H. S. Oh and P. Strasser, Angew. Chem., Int. Ed., 2015, 54, 10758 CrossRef CAS PubMed; (d) H. Nishihara, T. Hirota, K. Matsuura, M. Ohwada, N. Hoshino, T. Akutagawa, T. Higuchi, H. Jinnai, Y. Koseki, H. Kasai, Y. Matsuo, J. Maruyama, Y. Hayasaka, H. Konaka, Y. Yamada, S. Yamaguchi, K. Kamiya, T. Kamimura, H. Nobukuni and F. Tani, Nat. Commun., 2017, 8, 109 CrossRef PubMed; (e) P. Su, K. Iwase, S. Nakanishi, K. Hashimoto and K. Kamiya, Small, 2016, 12, 6083 CrossRef CAS PubMed.
- (a) H. Mistry, R. Reske, Z. Zeng, Z.-J. Zhao, J. Greeley, P. Strasser and B. R. Cuenya, J. Am. Chem. Soc., 2014, 136, 16473 CrossRef CAS PubMed; (b) J. K. Nørskov, J. Rossmeisl, A. Logadottir, L. Lindqvist, J. R. Kitchin, T. Bligaard and H. Jónsson, J. Phys. Chem. B, 2004, 108, 17886 CrossRef.
- H. A. Hansen, J. B. Varley, A. A. Peterson and J. K. Nørskov, J. Phys. Chem. Lett., 2013, 4, 388 CrossRef CAS PubMed.
- (a) T. Ozaki, Phys. Rev. B, 2003, 67, 155108 CrossRef; (b) T. Ozaki and H. Kino, Phys. Rev. B, 2004, 69, 195113 CrossRef.
- F. Calle-Vallejo and M. T. M. Koper, Angew. Chem., Int. Ed., 2013, 52, 7282 CrossRef CAS PubMed.
Footnotes |
| † Electronic supplementary information (ESI) available. See DOI: 10.1039/c8sc00604k |
| ‡ Both authors equally contributed to this work. |
| This journal is © The Royal Society of Chemistry 2018 |

