 Open Access Article
Improved ammonia production using Cu2O@poly-carbazole electrocatalysts in the electrochemical reduction of molecular nitrogen and nitrogen oxoanions†
Luis
Herrán‡
 abc,
Diego F.
Veliz-Silva‡
ab,
Colin
Poblete
ab,
Elías
Leiva
 ab,
Jessica
Honores
 ab,
Esteban
Landaeta
 g,
Mamié
Sancy
ad,
Rodrigo del
Río
ab,
César
Sáez-Navarrete
 ae,
Enrique
Dalchiele
f and
Mauricio
Isaacs
 *ab
*ab
aMillenium Institute on Green Ammonia as Energy Vector, Pontificia Universidad Católica de Chile, Santiago, 7820436, Chile. E-mail: misaacs@uc.cl
bDepartamento de Química Inorgánica, Facultad de Química y de Farmacia, Pontificia Universidad Católica de Chile, Santiago 7820244, Chile
cDepartamento de Ingeniería Mecánica y Metalúrgica, Escuela de Ingeniería, Pontificia Universidad Católica de Chile, Santiago, 7820436, Chile
dEscuela de construcción Civil, Facultad de Ingeniería, Pontificia Universidad Católica de Chile, Santiago, 7820436, Chile
eDepartamento de Ingeniería Química y Bioprocesos, Escuela de Ingeniería, Pontificia Universidad Católica de Chile, Santiago, 7820436, Chile
fInstituto de Física, Facultad de Ingeniería, Herrera y Reissig 565, C.C. 30, Montevideo, 11000, Uruguay
gEscuela de Ingeniería, Universidad Central, Av. Santa Isabel 1186, Santiago, 8330563, Chile
First published on 6th August 2024
Abstract
In the present study, a Cu2O@PCz electrode for the nitrogen reduction reaction is proposed; this electrode takes advantage of the catalytic properties of Cu2O in conjunction with conducting polymers such as polycarbazole (PCz). This combination demonstrates an improvement in the catalytic activity and higher stability of this metal oxide in nitrogen electro-reduction reaction (NRR) and nitrogen oxoanion electro-reduction reaction (NORR) processes under aqueous conditions. On this basis, the material synthesized on FTO (SnO2![[thin space (1/6-em)]](https://www.rsc.org/images/entities/char_2009.gif) :
:![[thin space (1/6-em)]](https://www.rsc.org/images/entities/char_2009.gif) F), Cu2O@PCz, exhibits a faradaic efficiency of around 38.83%, together with an NH3 productivity of 1.83 μg h−1 cm−2 in NRR type processes, on applying a potential of −0.8 V (V vs. Ag/AgCl). Similarly, in NORR type processes, the material exhibits NH3 and N2H4 productivity. The latter is the most relevant in terms of the yields obtained. Specifically, using nitrite (NO2−), an efficiency of around 77.72% was obtained, together with a formation rate of 37.02 μg h−1 cm−2 at a potential of −0.8 V (V vs. Ag/AgCl). Although N2H4 is a by-product of ammonia formation, this molecule can be considered an intermediate, which broadens the scope of this study for future research into the production of green chemicals. Finally, this research presents promising new routes for the production of NH3 at room temperature, highlighting the potential of low-cost materials, easy synthesis, and enhanced stability.
F), Cu2O@PCz, exhibits a faradaic efficiency of around 38.83%, together with an NH3 productivity of 1.83 μg h−1 cm−2 in NRR type processes, on applying a potential of −0.8 V (V vs. Ag/AgCl). Similarly, in NORR type processes, the material exhibits NH3 and N2H4 productivity. The latter is the most relevant in terms of the yields obtained. Specifically, using nitrite (NO2−), an efficiency of around 77.72% was obtained, together with a formation rate of 37.02 μg h−1 cm−2 at a potential of −0.8 V (V vs. Ag/AgCl). Although N2H4 is a by-product of ammonia formation, this molecule can be considered an intermediate, which broadens the scope of this study for future research into the production of green chemicals. Finally, this research presents promising new routes for the production of NH3 at room temperature, highlighting the potential of low-cost materials, easy synthesis, and enhanced stability.
1. Introduction
Ammonia (NH3) is a fundamental precursor in different chemical processes. This compound plays a crucial role in global food production. In addition, the use of ammonia has become widespread in various fields, being currently a very studied molecule and of great interest and being proposed as a means of transport and storage of hydrogen due to its hydrogen content of 17.8% by weight, besides remaining in the liquid phase at pressures close to about 8 bars, which allows relatively simple transport and storage processes.1The process used for many years for the industrial production of ammonia is known as the Haber–Bosch process.2 Currently, this process synthesizes ammonia from N2 and H2 in the presence of iron-based catalysts. This synthetic methodology requires a considerable amount of energy and capital, being a very expensive and highly polluting process due to the large amount of greenhouse gases it releases into the environment;3 an example is the hydrogen source of the process, which relies on steam methane reforming of natural gas, which emits more than 300 million tons of carbon dioxide per year.4 For this reason, significant efforts have been made to develop environmentally friendly approaches through energy saving and sustainable processes.
One approach with significant potential is the electrochemical nitrogen reduction reaction (NRR), which uses ambient conditions and aqueous solvents as a proton source instead of H2 gas.5,6 Moreover, the energy input in electrocatalysis can be supplied by renewable energy sources.7 However, laboratory-scale tests show low conversion efficiency and yield, which limits the practical application of ammonia generation.8 These disadvantages are mainly due to the highly stable chemical properties, non-polarity, and low proton affinity of N2, in addition to the hydrogen evolution reaction at the cathode competing with the NRR for electrons.9–11 For all these reasons, in the search for efficient and environmentally friendly methods, the prospect of simultaneously reducing other nitrogenous compounds (NOnx− in this case) emerges as a remarkable option. These nitrogen oxoanion compounds (NOnx−) can be easily reduced electrochemically (compared to N2) due to several factors, such as the lower energy required to break the N![[double bond, length as m-dash]](https://www.rsc.org/images/entities/char_e001.gif) O bond (activation energy 204 kJ mol−1) compared to the N
O bond (activation energy 204 kJ mol−1) compared to the N![[triple bond, length as m-dash]](https://www.rsc.org/images/entities/char_e002.gif) N bond (activation energy 941 kJ mol−1).12 Moreover, NOnx− compounds exhibit higher solubility in water than N2 due to their polar characteristics.8 Consequently, electrochemical reduction for ammonia production can be performed either from N2 or from NOnx−.13,14
N bond (activation energy 941 kJ mol−1).12 Moreover, NOnx− compounds exhibit higher solubility in water than N2 due to their polar characteristics.8 Consequently, electrochemical reduction for ammonia production can be performed either from N2 or from NOnx−.13,14
Electrochemical reactions for ammonia production require the intervention and/or participation of a catalyst to facilitate the reaction. Remarkable progress has been made in this field, with notable advances,15 such as the development of catalysts synthesized based on Au nanoclusters,16 Ru nanoparticles17 and transition metal nitride catalysts.18 In particular, copper oxide materials have shown great promise for reducing nitrogen compounds to NH3 by electrocatalysis and photocatalysis.19 Compared to the precious metal catalysts previously mentioned, a clear advantage of copper oxide materials is their considerably lower cost, specifically cuprous oxide (Cu2O), that is a low-cost and visible light-sensitive material. Moreover, it has been widely used in electrochemical and photocatalytic conversion processes.20,21 This compound possesses conduction and valence band levels suitable for N2 reduction since it is a p-type semiconductor with a band gap of 2.17 eV and a high electrocatalytic response. Unfortunately, Cu2O is unstable and could be oxidized, which limits its electrocatalytic activity in aqueous media. It has previously been used to reduce nitrogen derivatives such as NO3− (nitrates) and NO2− (nitrites) to ammonia and ammonia derivatives; however these electrodes have been shown to be unstable.20–24 Moreover, there is little research examining the electrocatalytic performance of Cu2O for the electrochemical reduction of N2, which motivates the possible use of this copper oxide for ammonia generation, in addition to analyzing the possible by-products generated from both N2 reduction and the reduction of other nitrogen oxoanions on Cu2O catalysts.19,25,26 Given the potential capacity of cuprous oxide in this process, strategies to enhance the stability of this oxide are being explored. Based on the latter, studies have determined, by in situ/operating spectroscopy, a direct correlation between changes in the chemical state of the catalyst as a function of potential and time during the NO3RR/NO2RR and the catalytic selectivity of Cu2O nanocubes, providing information on the main active species involved in the process. From this, it was established that the slow reduction of Cu(I) to metallic Cu at low overpotentials (0.1 V vs. RHE) results in low production rates and efficiencies for NH3, suggesting that the Cu(I) species can only catalyze the reduction of NO3− to NO2−, prior to its reduction to metallic copper.27
In general, copper-based catalysts have a high catalytic activity for nitrogen oxoanion electroreduction, since Cu atoms with a 3d10 orbital are more favorable for the adsorption of this type of ionic compound and their subsequent reduction to ammonia.28 On the other hand, copper-based catalysts have not been very well studied for nitrogen reduction, since the different studies proposed place other elements such as Fe and Mo as low-cost and very active species for this process. However, it has been proposed that copper nanostructures have great advantages in these types of electrochemical applications, such as high electrical conductivity, high mechanical strength, low cost, abundant availability and an environmentally friendly nature. In addition, it has been shown that the embedding of Cu nanoparticles on supports such as carbon improves both the catalytic stability and the activity of the system in electrocatalytic reactions.29,30 Based on this, compounds based on copper and other transition metals have been studied, such as dinuclear compounds such as Cu–Ti, which have shown that copper facilitates the reduction of nitrogen through a “distal” type mechanism, generated from the interaction of the two metal centers with each of the nitrogens of the N2 species.28
Along the same lines, the chemical functionalization of transition metal nanocrystals is crucial in electrochemical processes, as it improves electrocatalytic activity, adjusts electronic and geometrical structures, stabilizes and controls particle morphology, and facilitates proton enrichment at the electrode/electrolyte interface. These improvements are essential to optimize reactions such as hydrogen evolution, oxygen reduction and formic acid oxidation, increasing the efficiency and selectivity of electrocatalysts.31 Although challenges exist, such as precise control of adsorption of functional molecules and long-term stability, chemical functionalization remains a promising strategy for the development of more efficient and stable electrocatalysts. One such example is the use of polyamines (PAMs) in conjunction with metal centers. These polymers donate electrons to noble metals, affecting the electronic structure of the metal nanocrystals and improving their catalytic activity. A specific case is functionalization with PEI (polyethylenimine), a type of PAM, in Pd nanowires improving the oxygen reduction activity (ORR) by changing the electronic structure of Pd.32
Based on the above, one of the most promising approaches involves modifying electrodes with a substance that preserves the high stability and durability of Cu2O while maintaining its excellent catalytic properties. Conductive organic polymers represent a viable option for this purpose. These materials exhibit the typical attributes of conventional polymers, such as solubility, mechanical flexibility, and low production costs, yet they offer conductivity levels comparable to those of semiconductors or even metals.33–37 In this instance, the application of carbazole is proposed. This compound belongs to a critical class of heterocycles and offers several advantages, including enhanced stability and a higher redox potential relative to other conducting polymers. Additionally, it exhibits favorable electroactive and photoactive properties.38–42 Moreover, although several methods exist for obtaining polycarbazoles, electrochemical synthesis stands out for its reproducibility and simplicity. On the other hand, this method can be carried out at room temperature with thickness control by varying the current or potential as a function of time.38 Therefore, in this research, the use of copper(I) oxide nanoparticles electrochemically deposited on a polycarbazole (PCz) layer, using an FTO/glass substrate is proposed. This approach is intended to improve the stability of copper oxide nanoparticles to enhance and maintain their potential reducing effect in electrocatalytic reactions for N2 and nitrogen oxoanion compounds over time.
2. Results and discussion
2.1 Fabrication, characterization and properties
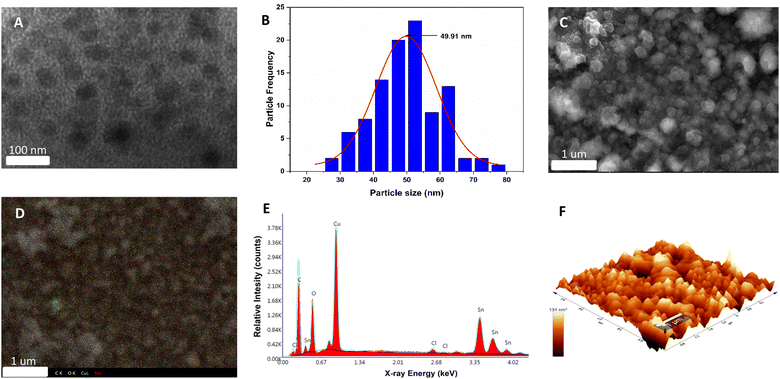
The synthesis of the Cu2O electrode, stabilized with polycarbazole, was performed using the methodology described in the ESI (S1†). First, the electropolymerization of carbazole on an FTO glass was performed by potential cycling, which leads to the formation of carbamoyl radicals at potentials above 1.2 V against Ag/AgCl.43 The polymerization of carbazole on FTO is a process that occurs with a two-electron transfer and dimerization of the pendant “carbazole” ring through the 3,6-positions (see Fig. S2†).44 Subsequently, for Cu2O deposition, the previously synthesized electrode (FTO/PCz) is subjected to chronopotentiometry using a constant current of −1 mA for 5 min, using a copper lactate solution at pH 12.5. For this process, a current variation is observed as a function of Cu2O deposition on the electrode (see Fig. S3†).Fig. 1 illustrates the different morphological and topographical characterization studies of the material. Specifically, in Fig. 1A, transmission electron microscopy (TEM) shows the copper(I) oxide nanoparticles (black flakes) that are supported on the polycarbazole surface (lighter background).
The size distribution of the copper nanoparticles was observed using a Gaussian distribution with a peak of around 50 nm. Considering 100 nanoparticles, the average size results in a value of 49.91 nm (see Fig. 1B). In Fig. 1C–E, scanning electron microscopy (SEM) images show different material agglomerations on the FTO electrode. These agglomerations of the material are mainly formed by polycarbazole. At the same time, Cu2O nanoparticles are uniformly deposited all over the surface, which can be seen in Fig. 1C. Fig. 1D shows the EDX (energy dispersive X-ray spectroscopy) mapping; this analysis allows the X-ray generated by the sample to be captured (see ESI, Section S1† for more details). In this case, atomic centers referring to C, O, Cu and Sn are analyzed. Based on the above, the spectrum shows different atomic centers, evidencing the homogeneity of the system with respect to the polymer and the copper nanoparticles. It should be noted that the Sn signals belong to the conductive glass used for the electrodeposition of the catalytic material. On the other hand, the EDX elemental analysis (Fig. 1E) reports a high presence of copper, oxygen, carbon, and tin. The first three elements are given by Cu2O and polycarbazole deposited on the electrode, while tin is the constituent material of the FTO electrode; it is worth mentioning that the EDX represents the area shown in Fig. 1C. AFM microscopy (Fig. 1F) shows the 3D surface of the synthesized Cu2O@PCz electrode. The relatively homogeneous deposition of nanoparticles can be observed where the heights and widths of the deposited nanoparticles are close to 100 nm. The cuprous oxide is deposited on the rough surface generated by the polymer. This coincides with the electrode morphology observed in FE-SEM microscopy, as shown in Fig. 1C.
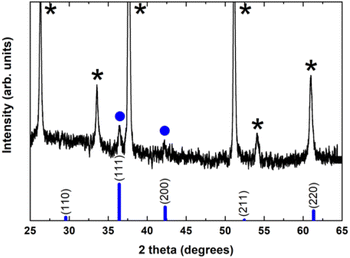
To investigate and identify the different crystallographic phases and the overall crystalline quality of the electrochemically grown Cu2O thin films, X-ray diffraction (XRD) measurements have been carried out in the standard Bragg–Brentano configuration.
Fig. 2 shows a typical diffraction pattern of an electrodeposited Cu2O sample galvanostatically grown onto an FTO/glass substrate. The results indicate that the single cubic Cu2O phase is well-defined, and the samples are polycrystalline; no other impurity phases were detected (such as metallic copper, CuO phase), indicating the pure phase in the electrodeposited Cu2O thin films. To determine the preferred orientation of the Cu2O films, the intensity ratio I(111)/I(200) for the two most intense peaks has been evaluated, and a value of 1.3 has been obtained. The relative intensity ratio I(111)/I(200) corresponding to a polycrystalline pure Cu2O sample without preferential orientation exhibits a value of 2.88.45 Above this value, polycrystalline Cu2O thin films are formed in a [111] preferred orientation, whereas if this ratio is smaller than 2.88, the samples reveal a [100] texture.46 Thus, pure Cu2O films electrochemically grown in our case displayed a [100] preferential orientation. Moreover, the broadening of the diffraction peaks demonstrates the nanocrystalline character of these Cu2O thin films. Average crystallite size was calculated from the full width at half maximum (FWHM) of XRD peaks by using the Scherrer formula:47
 | (1) |
Unfortunately, the crystalline phases present in the Cu2O@PCz electrode could not be identified. This is mainly due to the fact that the signals belonging to the FTO crystal overlap with the low intensity signals belonging to Cu2O (see Fig. S10†). However, small signals can be observed, attributable to the pattern observed for Cu2O without the polymer (see Fig. 2).
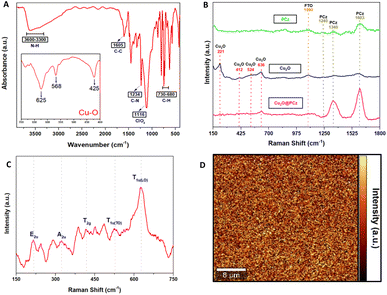
Fig. 3A shows the FTIR-ATR spectra of the Cu2O@PCz electrode, revealing the characteristic peaks of the polycarbazole and Cu2O nanoparticles. Specifically, for the polymer, the signals are observed at 3595, 1605, 1234, and 730–680 cm−1, corresponding to N–H, the antisymmetric and symmetric C–C stretching deformation, C–N (stretching of aromatic C–N bonds or vibration of the disubstituted benzene ring), and –C–H (out-of-plane deformation of the C–H bond in the benzene ring) respectively. In addition, at 1116 cm−1, a high-intensity signal is observed, coming from the supporting electrolyte used in the polycarbazole electropolymerization (ClO4−) adsorbed on the electrode surface.49 Similarly, around the characteristic signals of Cu2O, shifts at 635, 568, and 425 cm−1 are observed. The absorption peak at 425 cm−1 corresponds to the metal–oxygen interaction (Cu–O), while vibration in the range 560–660 cm−1 corresponds to (Cu–O–Cu).50,51
As for Raman spectroscopy (Fig. 3B and C), experiments were performed to investigate the chemical nature of the Cu2O@PCz electrode. For this purpose, 532 nm laser irradiation was used. PCz and Cu2O@PCz samples were measured, and the characteristic signals of each species were observed separately (Fig. 2B). Specifically, the above 1100 cm−1 signals belonging to PCz and the peaks observed at 1340 and 1603 cm−1 are associated with C![[double bond, length as m-dash]](https://www.rsc.org/images/entities/char_e001.gif) C stretching and C–C aromatic bonds, respectively.52 The small peak at 1240 cm−1, appreciable in the PCz spectrum, would correspond to oxidized carbazole,50 which disappears upon subsequent deposition of Cu2O due to the negative potential used. Finally, a peak concerning the conductive glass used (FTO) can be seen at 1090 cm−1.53,54
C stretching and C–C aromatic bonds, respectively.52 The small peak at 1240 cm−1, appreciable in the PCz spectrum, would correspond to oxidized carbazole,50 which disappears upon subsequent deposition of Cu2O due to the negative potential used. Finally, a peak concerning the conductive glass used (FTO) can be seen at 1090 cm−1.53,54
The characteristic vibrational modes of Cu2O with A, E and T symmetry can be observed in the region between 100 and 700 cm−1 (see Fig. 3C). The observed shifts are assigned as follows: 221 cm−1 (2Eu), 336 cm−1 (A2u), 412 cm−1 (T2g), 524 cm−1 (T1u(TO)) and 636 cm−1 (T1u(LO)), as reported in the literature.50,55 It is worth noting that the areas associated with the polycarbazole (from wavenumber 1000 cm−1) show signs of fluorescence, so that Raman scattering makes it challenging to visualize, both using 532 nm and 785 nm laser excitation. Signals from Cu2O are present, as shown in Fig. 3B.
Fig. 3D shows 2D Raman spectra, corresponding to a 40 μm × 40 μm region mapped using a filter set to the characteristic band intensity of the T1u(LO) vibrational mode (636 cm−1).50,55 The Raman spectrum of Cu2O reveals a p-type semiconductor character because the observed Raman bands are associated with copper vacancy interactions that conduct electricity through holes; these results agree with those of previously reported investigations.56 In addition, a relatively homogeneous deposit of copper oxide nanoparticles is observed, where the signals of greater intensity (yellow color of the 2D spectrum) correspond to the copper nanoparticles. In contrast, the zones represented by black color within the 2D spectrum correspond to polycarbazole zones where the vibration signal analyzed cannot be observed, which indicates that there would not be Cu2O deposited in those segments.
Fig. 4A shows the existence of Cu, Sn, O, N, and C. The high-resolution XPS spectrum of Cu2p is demonstrated in Fig. 4B. The peak positions of Cu2O 2p1/2 and Cu 2p3/2 were 951.99 eV and 932.08 eV, respectively.57,58 The peaks adjusted at 935.12 eV and 955.03 eV are attributed to copper(II) oxides, such as CuO, and the two detectable peaks of the shaking satellite indicate the presence of this species in the sample.59,60 Unfortunately, it is tough to determine whether the resulting Cu+1 peaks are Cu2O or metallic Cu due to a slight difference in the peak of the Cu2p core.57 As a complementary way, the use of the Cu Auger peak [LMM] is a reliable way to confirm the chemical state in question.61Fig. 4C shows that the Auger spectra at 570.03 eV are attributed to Cu2O and not to metallic Cu due to the lower band energy (568 eV) of Cu.57,61,62 Based on the areas obtained from the XPS spectrum, we can identify that 36% corresponds to Cu+1 and 64% to Cu+2, being in a ratio of approximately 1![[thin space (1/6-em)]](https://www.rsc.org/images/entities/char_2009.gif) :
:![[thin space (1/6-em)]](https://www.rsc.org/images/entities/char_2009.gif) 2.
2.
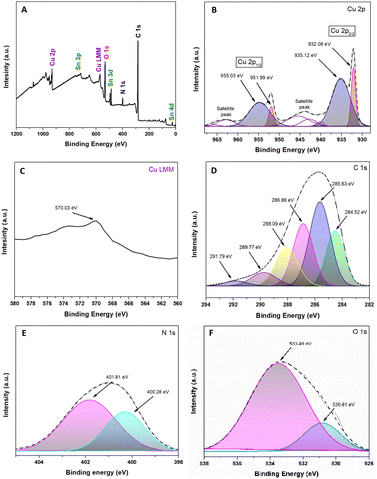 | ||
| Fig. 4 Spectroscopic analysis XPS of the Cu2O@PCz electrode. (A) Survey spectra; (B) Cu 2p; (C) Cu 2p AES (Auger electron spectroscopy); (D) C 1s; (E) N 1s; and (F) O 1s. | ||
The high-resolution peaks N1s and C1s are related to the conducting polymer PCz, shown in Fig. 4D and E. The peaks of C1s were divided into six components: the C–C/C–H bond (284.52 eV), C–N bond (285.63 eV), C–O bond (286.86 eV) and C![[double bond, length as m-dash]](https://www.rsc.org/images/entities/char_e001.gif) O bond (288.09 eV).63,64 This last peak would correspond to CO2 adsorbed on the material and the formation of an O–C–O epoxide group, a product of the interaction between the polymer and the irradiation to which it was exposed, which gives rise to other peaks, such as those originating at 289.77 eV and 291.79 eV.63,65 Similarly, among the most important peaks in Fig. 4E, those located at 401.81 eV and 400.28 eV correspond to R4N+ and C–N, respectively.63,66 Referring to Fig. 4F, the O1s spectrum can be observed; in particular, the peak located at 530.81 eV corresponds to the presence of Cu–O.60 Likewise, the peak at 533.48 is attributed to the conductive glass (FTO), which is based on SnO2.67,68
O bond (288.09 eV).63,64 This last peak would correspond to CO2 adsorbed on the material and the formation of an O–C–O epoxide group, a product of the interaction between the polymer and the irradiation to which it was exposed, which gives rise to other peaks, such as those originating at 289.77 eV and 291.79 eV.63,65 Similarly, among the most important peaks in Fig. 4E, those located at 401.81 eV and 400.28 eV correspond to R4N+ and C–N, respectively.63,66 Referring to Fig. 4F, the O1s spectrum can be observed; in particular, the peak located at 530.81 eV corresponds to the presence of Cu–O.60 Likewise, the peak at 533.48 is attributed to the conductive glass (FTO), which is based on SnO2.67,68
2.2 Electrocatalytic performance and stability
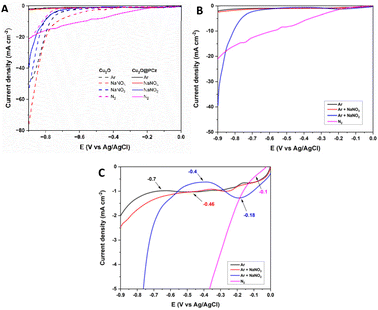
Once the electrode was characterized, its electrocatalytic performance was evaluated at different potentials (−0.4, −0.6, and −0.8 V; all measurements were performed with respect to a saturated Ag/AgCl reference electrode) for 2 h in 0.1 M Na2SO4 aqueous solution at pH 5.95, under room temperature and pressure conditions. A closed H-type cell separated using a Nafion 117 membrane and saturated with N2 was used; the NH3 generated and the by-product N2H4 were quantified by the indophenol blue method and the method of Watt and Chrisp, respectively. In addition, purity tests of the nitrogen used were carried out to rule out the presence of NOxin situ in the respective procedures, using differential electrochemical mass spectrometry (DEMS) (ESI “S1-DEMS Methodology”†).Fig. 5 shows the electrochemical results of the linear sweep voltammetry (LSV) curves of the Cu2O and Cu2O@PCz electrodes under the above conditions, changing only the nitrogen species to be reduced (Fig. 5A). Initially, the behavior of the materials is analyzed in an Ar-saturated solution without N2 or NOnx− compounds (black lines). The same test is performed, but using NOnx− species in solution (in red NO3− and blue NO2− separately), and finally, the behavior of a solution saturated only with N2 (Pink) is studied; the eight polarization curves show the electrocatalytic behavior of the electrode in the respective solutions, using a sweep rate of 1 mV s−1, where the segmented lines are representative of the Cu2O cathode and the continuous lines are representative of the Cu2O@PCz cathode.
In general, when comparing LSVs with and without a polymer, the most important changes can be observed in the HER process, because in the absence of the polymer, a significant current drop is observed at around −0.7 V (dotted black line), similar to the effect experienced by nitrate reduction (dotted red line). On the other hand, in the presence of the polymer, these current drops are practically imperceptible, with a noticeable difference in the current drop (black solid line). This indicates the hydrophobic effect generated by the polymer on the electrode, which significantly reduces the HER process. Along with this, an improvement in the effect of nitrogen reduction (pink lines) is appreciated, generating a continuous current drop from −0.1 V, as a product of the inhibition of the HER process. Finally, with respect to nitrite reduction, this reduction does not vary significantly in the presence of the polymer, which would indicate that the presence of the polymer would not affect the kinetics of the electrochemical process.
Fig. 5B and C show LSVs obtained with the Cu2O@PCz electrode, with and without the presence of nitrogen compounds. From this, it can be seen that the blank (LSV in Ar) has a current drop at a potential of −0.7 V, which could be attributed to the HER process. In the presence of NO3− an onset potential at −0.46 V is observed, revealing that the processes associated with NO3− reduction are generated at this potential. The same behavior presents the LSV of NO2− whose onset potential is located at −0.4 V. Finally, the LSV performed with N2 presented an onset potential at −0.1 V, thus demonstrating that using the Cu2O@PCz electrode all potentials that could be associated with the reductions of the tested nitrogen compounds occur before the HER onset potential. In addition, the difference in current density between the NO2− and N2 LSV with Ar LSV is particularly obvious, indicating that the Cu2O@PCz electrode has great catalytic potential for such processes over the HER process.
Fig. 6A–C show the faradaic efficiency and production rates of ammonia and hydrazine obtained for the electroreduction of NO2−, NO3− and N2, respectively. For the NO3− reduction, the faradaic efficiency was around 39% at −0.6 V; this value is lower than that of other reported catalysts, which exceed 90%, mainly due to the presence of other by-products generated from the interaction with Cu, such as NO2−, NO, and N2.69–71 In relation to the electroreduction of the NO2− species, the great catalytic capacity of the system for the production of hydrazine can be observed, in parallel to the production of ammonia. From this, a faradaic efficiency of 77.72% and a high production rate (37.025 μg h−1 cm−2) can be obtained at a potential of −0.8 V. These results are promising for the electrochemical production of this by-product. Hydrazine can be used as a preliminary step to green ammonia electrowinning, but, like ammonia, it is also considered a green hydrogen source.72–74 This fact makes it imperative for a future study of the way to obtain this compound, to identify new areas of study and application for this phenomenon, which has not been possible to identify in other investigations, with such high faradaic efficiencies. The values obtained for hydrazine production could not be compared with those in other studies in the literature, since hydrazine is not quantified in this type of analysis because it is considered a by-product of ammonia production. When NO2− is directly reduced, NH3 and N2 are evaluated as reaction products;75–77 however, previous studies indicated that copper oxides, together with other transition metals such as Pd, can allow the subsequent reduction of the generated hydrazine to ammonia, generating a faradaic efficiency higher than 90%, considering hydrazine as an intermediate product of the reaction.78 For N2 reduction, a production rate of 1.81 μg h−1 cm−2 was obtained, together with a faradaic efficiency of 38.82% for ammonia formation, using a potential of −0.8 V. Although this production value is within the average value of the catalysts used in the NRR, the faradaic efficiency obtained is much higher compared to the average faradaic efficiency of the catalysts, which does not exceed 10% of average efficiency, demonstrating the extraordinary capacity of this system for NR type reactions.79–81 Determination of efficiency and comparison data are detailed in the ESI (see Table S2†).
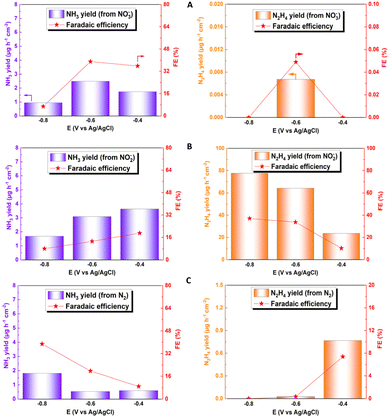 | ||
| Fig. 6 Faradaic efficiency and generation rate at different potentials for ammonia (blue) and hydrazine (orange) for electroreduction of (A) NO3−, (B) NO2− and (C) N2. | ||
Fig. 7 shows chronoamperometric studies of the Cu2O@PCz electrode at different potentials with the different precursors for the ammonia electrosynthesis. These results reveal that the Cu2O@PCz electrode exhibits stable current densities at various potentials, with constant charge retentions over time for each of the precursors; using a potential of −0.6 V (vs. Ag/AgCl), such stability is close to 92.5% after 2 hours of continuous electrochemical tests (Fig. 7A–C).
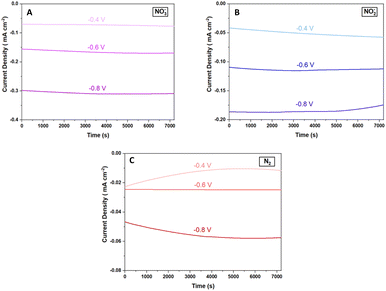 | ||
| Fig. 7 Galvanostatic curves for the Cu2O@PCz electrode at different potentials using (A) NO3−, (B) NO2−, and (C) N2. | ||
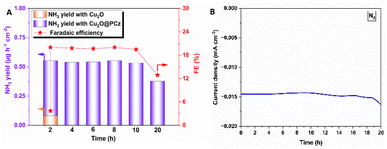
On the other hand, using the same potential and observing the highest stability using N2 as a precursor, both NH3 production rates and the faradaic efficiency of such a process are analyzed (Fig. 8). The values remained relatively constant during 20 h of continuous NRR electrochemical testing, with a retention of current stability of about 95% up to 10 h of electrolysis (see Fig. 8B). Along with this, the faradaic efficiencies and ammonia generation rate also remained constant up to 10 hours. After that, both a significant variation in current and a considerable decrease in faradaic efficiency and ammonia formation rate are observed. These results can confirm the high stability of the Cu2O@PCz electrode, both when working at different potentials and when used for prolonged periods of time, without losing its catalytic properties, at least up to 10 hours of continuous work. In addition, the two-hour bar (see Fig. 8A) shows a comparison between the yields and faradaic efficiency for the stabilized Cu2O@PCz and unstabilized Cu2O electrodes; an increase in ammonia production yield and faradaic efficiency of the catalyst is observed in the presence of the polymer, indicating a higher catalytic activity when Cu2O nanoparticles are stabilized. This could also indicate that the oxidation of Cu2O to CuO in the absence of the polymer generates a lower catalytic activity for N2 reduction, since this species would not be active for the NRR process. This can also be seen in the NO3− and NO2− reduction processes, by comparing the two 2-hour electrolysis processes, with and without the polymer (Fig. S9†).
2.3 Characterization after electrocatalysis
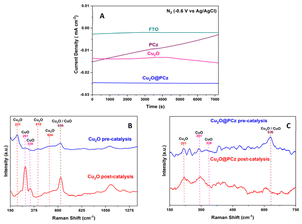
After the catalytic evaluation, the Cu2O@PCz electrode is characterized, using the nitrogen reduction at −0.6 V (vs. Ag/AgCl) as a model to analyze the proposed electrode.Regarding the stability of the material, analyzing the different components separately (FTO glass, Cu2O and PCz respectively) and the Cu2O@PCz electrode. The behaviors of the different currents along the catalysis were plotted (Fig. 9A). From this; it is observed that the FTO conductive glass has a relatively stable current well below that of the final electrode constituents. On the other hand, in the electrode with the respective polymer PCz an initial current increase is observed. Still, it decreases over time, eventually stabilizing and reaching a value similar to that of the conductive glass without deposit, which may be due to the presence of a constant reduction of possible unpolymerized oxidized carbazole to a point where the carbazole is completely reduced; this electrode does not present catalytic activity for N2.82 Similarly, the Cu2O and Cu2O@PCz currents are relatively stable, but there is an improvement in the cathodic current with the presence of the polymer in the catalyst.
In Fig. 9B, it can be observed that, after the catalytic cycle, in the absence of the polymer, the intensity of the characteristic signals of Cu2O decreased, and in turn, two characteristic signals in the presence of CuO in the sample appear (291 and 338 cm−1),83 demonstrating the low stability of Cu2O nanoparticles in the catalytic cycle. In Fig. 9C, it can be observed that, in the presence of the polymer together with the Cu2O nanoparticles, there is no increase in the intensity of the signals belonging to CuO, as it occurs when there is no polymer in the catalyst (see Fig. 9B). However, these signals are already present in the system, before catalysis, which indicates that both species are present in the catalyst and that they are stabilized by the polycarbazole present, due to the almost insignificant change in the pre- and post-catalysis signals. This is also demonstrated in the XPS spectrum of the Cu2O@PCz electrode analyzed above (Fig. 4A), where this electrode contains both Cu2O and CuO species pre-catalysis.
On the other hand, regarding the morphological changes of the Cu2O@PCz cathode, an important change in the morphology of the material can be seen in the TEM after catalysis, where, unlike those seen in Fig. 1, there are clusters of material with different diameters, which exceed 300 nm (see Fig. S11†). In parallel, it can be observed in Fig. 10 that the FE-SEM of the material changes after 20 hours of electrolysis, generating clusters of copper species on the surface. This may be because during the electroreduction process, changes in the electrochemical conditions, such as the ion concentration, pH, and applied potential, may favor the nucleation and growth of the particles, generating these structures. In addition, when observing the magnification of these “spherical” structures (Fig. S12†), the presence of nanometric structures in the form of flakes is observed on the electrode before catalysis (see Fig. 1).
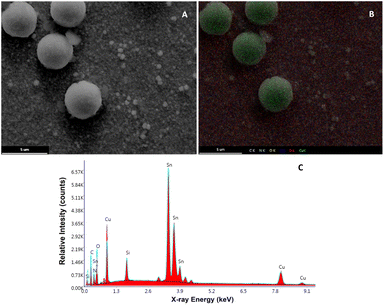 | ||
| Fig. 10 (A) FE-SEM image of the Cu2O@PCz electrode surface after 10 hours of electrolysis. (B) FE-SEM mapping of C, O, Cu and Sn. (C) EDX analysis. | ||
Similarly, the XPS spectrum of the material shows an important variation in the distribution of copper species. Specifically, before electrolysis, the distribution of Cu+1/Cu+2 was 1![[thin space (1/6-em)]](https://www.rsc.org/images/entities/char_2009.gif) :
:![[thin space (1/6-em)]](https://www.rsc.org/images/entities/char_2009.gif) 2 (Fig. 4), whereas after 20 hours of electrolysis, the distribution changes to about 1
2 (Fig. 4), whereas after 20 hours of electrolysis, the distribution changes to about 1![[thin space (1/6-em)]](https://www.rsc.org/images/entities/char_2009.gif) :
:![[thin space (1/6-em)]](https://www.rsc.org/images/entities/char_2009.gif) 1 respectively (Fig. S13†). The change may be due to several factors, such as the migration of copper ions on the surface, due to the agglomeration evidenced. Along with this, at the surface level, some of the Cu2+ ions may have been reduced as a result of the negative potential applied. All these factors may result in some of the energy applied to the system being lost in these processes, generating a drop in the efficiency of nitrogen reduction.
1 respectively (Fig. S13†). The change may be due to several factors, such as the migration of copper ions on the surface, due to the agglomeration evidenced. Along with this, at the surface level, some of the Cu2+ ions may have been reduced as a result of the negative potential applied. All these factors may result in some of the energy applied to the system being lost in these processes, generating a drop in the efficiency of nitrogen reduction.
Impedance analysis of Cu2O and Cu2O@PCz was also performed before and after the NRR process, as shown in Fig. 11. Nyquist diagrams of the Cu2O deposits reveal several capacitive semicircles between the high-frequency range (HF) and low-frequency domain (MF-LF). The impedance response at HF can be associated with the Cu2O oxidation reaction previously discussed (see Fig. 9B). The impedance behavior at MF-LF can be related to the diffusion process of N2 in the solution and Cu2O because the electrochemical measurements were carried out under static conditions. The NRR did not significantly influence the impedance response of the Cu2O@PCz electrode after 2 h at −0.6 V (vs. Ag/AgCl), also in agreement with the Raman analysis (see Fig. 9C). This suggests that Cu2O is stabilized when deposited on the PCz layer formed on the FTO glass. However, a change in the resistivity of the material was determined after 20 h of electrolysis (see Fig. 11B), which was attributed to the change in the electrode surface, specifically to the change in the oxidation state of Cu. Along with this, the change in the electrode surface can be seen in Fig. 10, where after the 20 hours of electrolysis, the copper present on the cathode begins to agglomerate, forming large spheres of copper oxide, which has a direct effect on the electrical resistivity of the material.
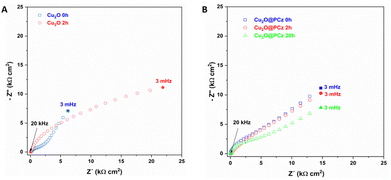 | ||
| Fig. 11 Nyquist diagram of (A) Cu2O and (B) Cu2O@PCz, at different NRR times, using −0.6 V (vs. Ag/AgCl). | ||
3. Conclusion
A Cu2O@PCz electrode was prepared, and its characteristic vibrational states (ATR-IR and Raman) and chemical bonding characteristics (XPS) were characterized. Thus, homogeneous deposits of these nanoparticles were generated on the electrode surface, which was verified by 2D Raman spectroscopy and EDX. Along with the above, sizes, particle shapes, and deposition thicknesses (≈50 nm, flakes, and 0.60 μm, respectively) could be identified from AFM, TEM and FE-SEM images. Similarly, stability analyses showed that the polymeric structure affects the long-term stabilization of copper(I) oxide nanoparticles when working between nitrogen reduction potentials, both at short and long electrolysis times (2 and 20 hours, respectively). Finally, it should be noted that the proposed electrodes have great potential to be used in the electrocatalysis of ammonia from molecular nitrogen and nitrogen oxoanions (NO2− and NO3−), and ammonia production rates around 2 μg h−1 cm−2 were obtained, together with a faradaic efficiency of above 30% using NO3− and N2 as precursors. Regarding the latter, the efficiency of other catalysts does not exceed 10%, rendering this material highly promising for future research and application. Similarly, remarkable yields have been achieved in the production of hydrazine, particularly when reducing nitrite at potentials of −0.8 V. This process generated formation rates of 37 μg h−1 cm−2 with a faradaic efficiency of approximately 78%. These results, unmentioned in other studies, suggest a possible new research direction in the utilization of copper(I) oxide and nitrite to produce this critical chemical, which tends to be considered a by-product in green ammonia electrowinning.Data availability
Data are available upon request from the authors.Author contributions
L. Herrán, D. Veliz-Silva and Colin Poblete conceptualized the idea and experimental design. L. Herrán, D. Veliz-Silva and E. Leiva, with the support of R. del Río, M. Isaacs and C. Saez, prepared the catalysts and evaluated the electrochemical performance of the reduction of nitrogenous compounds. L. Herrán, D. Veliz-Silva E. Landaeta, J. Honores and E. Dalchiele contributed to the material characterization of the catalysts. All the work was supervised by M. Isaacs and M. Sancy. L. Herrán and D. Veliz-Silva contributed equally, and all the authors actively participated in the discussion of the results.Conflicts of interest
The authors declare no conflict of interest.Acknowledgements
The authors would like to express their gratitude to Cedenna Project AFB220001, FONDECYT Regular Projects 1221179, FONDEQUIP EQM150020, EQM190016, and EQM150101, the Millennium Institute of Green Ammonia as Energy Vector ICN2021_023(MIGA) and ANID Becas/Doctorado Nacional 21231544.Notes and references
- R. Lan, J. T. S. Irvine and S. Tao, Int. J. Hydrogen Energy, 2012, 37, 1482–1494 CrossRef CAS.
- M. A. Sutton, D. Simpson, P. E. Levy, R. I. Smith, S. Reis, M. van Oijen and W. de Vries, Glob Change Biol., 2008, 14, 2057–2063 CrossRef.
- K. Wang, D. Smith and Y. Zheng, Carbon Resour. Convers., 2018, 1, 2–31 CrossRef.
- Y. Tanabe and Y. Nishibayashi, Coord. Chem. Rev., 2013, 257, 2551–2564 CrossRef CAS.
- E. Skúlason, T. Bligaard, S. Gudmundsdóttir, F. Studt, J. Rossmeisl, F. Abild-Pedersen, T. Vegge, H. Jónsson and J. K. Nørskov, Phys. Chem. Chem. Phys., 2012, 14, 1235–1245 RSC.
- D. Kim, S. Surendran, Y. Lim, H. Choi, J. Lim, J. Y. Kim, M. K. Han and U. Sim, Int. J. Energy Res., 2022, 46, 4119–4129 CrossRef CAS.
- C. Tang and S. Z. Qiao, Chem. Soc. Rev., 2019, 48, 3166–3180 RSC.
- T. Mou, J. Long, T. Frauenheim and J. Xiao, ChemPlusChem, 2021, 86, 1211–1224 CrossRef CAS.
- A. R. Singh, B. A. Rohr, J. A. Schwalbe, M. Cargnello, K. Chan, T. F. Jaramillo, I. Chorkendorff and J. K. Nørskov, ACS Catal., 2017, 7, 706–709 CrossRef CAS.
- B. H. R. Suryanto, H. L. Du, D. Wang, J. Chen, A. N. Simonov and D. R. MacFarlane, Nat. Catal., 2019, 2, 290–296 CrossRef CAS.
- Y. Liu, M. Cheng, Z. He, B. Gu, C. Xiao, T. Zhou, Z. Guo, J. Liu, H. He, B. Ye, B. Pan and Y. Xie, Angew. Chem., Int. Ed., 2018, 131, 741–745 CrossRef.
- H. Hirakawa, M. Hashimoto, Y. Shiraishi and T. Hirai, ACS Catal., 2017, 7, 3713–3720 CrossRef CAS.
- Y. Yao and L. Zhang, Sci. Bull., 2022, 67, 1194–1196 CrossRef PubMed.
- Z. Deng, H. Liu, H. Wang, C. Ma, J. Du and B. Zheng, Inorg. Chem. Front., 2024, 11, 2339–2345 RSC.
- B. H. R. Suryanto, H.-L. Du, D. Wang, J. Chen, A. N. Simonov and D. R. MacFarlane, Nat. Catal., 2019, 2, 290–296 CrossRef CAS.
- M.-M. Shi, D. Bao, B.-R. Wulan, Y.-H. Li, Y.-F. Zhang, J.-M. Yan and Q. Jiang, Adv. Mater., 2017, 29, 1606550 CrossRef PubMed.
- A. Liu, M. Gao, Y. Gao, X. Ren, Y. Yang, Q. Yang, Y. Li, L. Gao, X. Liang and T. Ma, Inorg. Chem. Commun., 2020, 120, 108169 CrossRef.
- S. Y. Park, Y. J. Jang and D. H. Youn, Catalysts, 2023, 13, 1–19 Search PubMed.
- S. Zhang, Y. Zhao, R. Shi, C. Zhou, G. I. N. Waterhouse, Z. Wang, Y. Weng and T. Zhang, Angew. Chem., Int. Ed., 2021, 60, 2554–2560 CrossRef CAS PubMed.
- M. Madasu, C. F. Hsia, S. Rej and M. H. Huang, ACS Sustainable Chem. Eng., 2018, 6, 11071–11077 CrossRef CAS.
- F. Matamala-Troncoso, C. Ky Nguyen, D. R. MacFarlane, M. Isaacs and C. Sáez-Navarrete, Mater. Lett., 2021, 293, 1–4 CrossRef.
- M. García, J. Honores, D. Quezada, C. Díaz, P. Dreyse, F. Celis, C. P. Kubiak, G. Canzi, F. Guzmán, M. J. Aguirre and M. Isaacs, Electrochim. Acta, 2016, 192, 61–71 CrossRef.
- K. Calfumán, M. J. Aguirre, P. Cañete-Rosales, S. Bollo, R. Llusar and M. Isaacs, Electrochim. Acta, 2011, 56, 8484–8491 CrossRef.
- L. Fang, S. Wang, C. Song, S. Lu, X. Yang, X. Qi and H. Liu, Chem. Eng. J., 2022, 446, 1–10 CrossRef.
- P. E. De Jongh, D. Vanmaekelbergh and J. J. Kelly, Chem. Mater., 1999, 11, 3512–3517 CrossRef CAS.
- X. Yuan, H. Yuan, L. Ye, J. Hu, Y. Xu and P. Li, RSC Adv., 2015, 5, 42855–42860 RSC.
- L. Bai, F. Franco, J. Timoshenko, C. Rettenmaier, F. Scholten, H. S. Jeon, A. Yoon, M. Rüscher, A. Herzog, F. T. Haase, S. Kühl, S. W. Chee, A. Bergmann and R. C. Beatriz, J. Am. Chem. Soc., 2024, 146, 9665–9678 CrossRef CAS.
- Y. Cheng, X. Li, P. Shen, Y. Guo and K. Chu, Energy Environ. Mater., 2023, 6, 1–7 Search PubMed.
- Y. Liu, W. Qiu, P. Wang, R. Li, K. Liu, K. M. Omer, Z. Jin and P. Li, Appl. Catal., B, 2024, 340, 1–8 Search PubMed.
- C. Li, S. Zhang, Z. Ding, H. Zhou, G. Wang and H. Zhang, Inorg. Chem. Front., 2020, 7, 3555–3560 RSC.
- Z. X. Ge, Y. Ding, T. J. Wang, F. Shi, P. J. Jin, P. Chen, B. He, S. Bin Yin and Y. Chen, J. Energy Chem., 2023, 77, 209–216 CrossRef CAS.
- Q. Xue, Z. Wang, Y. Ding, F. Li and Y. Chen, Chin. J. Catal., 2023, 45, 6–16 CrossRef CAS.
- S. Zhang, Q. Li and S. Zhang, Regener. Ther., 2023, 24, 85–93 CrossRef CAS PubMed.
- M. Zhang, L. Wang, H. Xu, Y. Song and X. He, Nanomicro Lett., 2023, 15, 135 CAS.
- T. Zhang, X. Huo, L. Wang, F. Ma and Y. Hou, J. Phys. D Appl. Phys., 2023, 56, 435503 CrossRef.
- J. Li, H. Sun, S.-Q. Yi, K.-K. Zou, D. Zhang, G.-J. Zhong, D.-X. Yan and Z.-M. Li, Nanomicro Lett., 2022, 15, 15 Search PubMed.
- K. Arjun and B. Karthikeyan, Appl. Phys. A, 2023, 129, 543 CrossRef CAS.
- F. Bekkar, F. Bettahar, I. Moreno, R. Meghabar, M. Hamadouche, E. Hernáez, J. L. Vilas-Vilela and L. Ruiz-Rubio, Polymers, 2020, 12, 1–33 CrossRef PubMed.
- K. Hoshino, N. Yazawa, Y. Tanaka, T. Chiba, T. Izumizawa and M. Kubo, ACS Appl. Mater. Interfaces, 2010, 2, 413–424 CrossRef CAS PubMed.
- W. Sangwan, K. Petcharoen, N. Paradee, W. Lerdwijitjarud and A. Sirivat, Carbohydr. Polym., 2016, 151, 213–222 CrossRef CAS PubMed.
- M. Guzel, Y. Torlak, H. Choi and M. Ak, Mater. Res. Bull., 2023, 167, 112406 CrossRef CAS.
- T. Soganci, Y. Baygu, N. Kabay, G. Dumlu, Y. Gök and M. Ak, New J. Chem., 2020, 44, 18616–18624 RSC.
- U. Geissler, M. L. Hallensleben, A. Rienecker and N. Rohde, Soluble Polycarbazoles and Carbazole Motied Electrodes, 1997, vol. 84 Search PubMed.
- A. F. Frau, N. C. Estillore, T. M. Fulghum and R. C. Advincula, ACS Appl. Mater. Interfaces, 2010, 2, 3726–3737 CrossRef CAS PubMed.
- S. Bijani, R. Schrebler, E. A. Dalchiele, M. Gabás, L. Martínez and J. R. Ramos-Barrado, J. Phys. Chem. C, 2011, 115, 21373–21382 CrossRef CAS.
- S. Bijani, L. Martínez, M. Gabás, E. A. Dalchiele and J. R. Ramos-Barrado, J. Phys. Chem. C, 2009, 113, 19482–19487 CrossRef CAS.
- B. D. Cullity, Elements of X-Ray Diffraction, Addison-Wesley Publishing Company Inc., Reading, USA, 2nd edn, 1978 Search PubMed.
- N. G. Elfadill, M. R. Hashim, K. M. Chahrour, M. A. Qaeed and M. Bououdina, Superlattices Microstruct., 2015, 85, 908–917 CrossRef CAS.
- A. S. Sarac, M. Ates and E. A. Parlak, J. Appl. Electrochem., 2006, 36, 889–898 CrossRef CAS.
- S. Bouachma, K. Ayouz-Chebout, M. Kechouane, A. Manseri, C. Yaddadene, H. Menari and N. Gabouze, Appl. Phys. A: Mater. Sci. Process., 2022, 128, 1–13 CrossRef.
- P. T. S. de la Cruz, K. Irikura, A. Lachgar, J. C. Cardoso, H. A. Cavero and M. V. B. Zanoni, Electrocatalysis, 2021, 11, 546–554 CrossRef.
- A. S. Sarac, S. A. M. Tofail, M. Serantoni, J. Henry, V. J. Cunnane and J. B. McMonagle, Appl. Surf. Sci., 2004, 222, 148–165 CrossRef CAS.
- N. Wang, J. Zhu, X. Zheng, F. Xiong, B. Huang, J. Shi and C. Li, Faraday Discuss., 2014, 176, 185–197 RSC.
- Z. Jiang, D. Yang, N. Wang, F. Zhang, B. Zhao, S. Tan and J. Zhang, Sci. China Chem., 2013, 56, 1573–1577 CrossRef CAS.
- E. Landaeta, Z. D. Schultz, A. Burgos, R. Schrebler and M. Isaacs, Green Chem., 2018, 20, 2356–2364 RSC.
- P. Choubey, T. Berlijn, A. Kreisel, C. Cao and P. J. Hirschfeld, Phys. Rev. B: Condens. Matter Mater. Phys., 2014, 90, 1–5 CrossRef.
- H. Gong, Y. Zhang, Y. Cao, M. Luo, Z. Feng, W. Yang, K. Liu, H. Cao and H. Yan, Appl. Catal., B, 2018, 237, 309–317 CrossRef CAS.
- S. Karthikeyan, S. Kumar, L. J. Durndell, M. A. Isaacs, C. M. A. Parlett, B. Coulson, R. E. Douthwaite, Z. Jiang, K. Wilson and A. F. Lee, ChemCatChem, 2018, 10, 3554–3563 CrossRef CAS.
- X. Li, W. Kong, X. Qin, F. Qu and L. Lu, Microchim. Acta, 2020, 187, 1–9 CrossRef PubMed.
- Z. Dan, Y. Yang, F. Qin, H. Wang and H. Chang, Materials, 2018, 11, 1–14 Search PubMed.
- Z. Yin, Y. Xiao, X. Wan, Y. Jiang, G. Chen, Q. Shi and S. Cao, J. Mater. Sci., 2021, 56, 3874–3886 CrossRef CAS.
- M. Zhang, Z. Chen, Y. Wang, J. Zhang, X. Zheng, D. Rao, X. Han, C. Zhong, W. Hu and Y. Deng, Appl. Catal., B, 2019, 246, 202–210 CrossRef CAS.
- P. Niu, H. Huang, L. Zhao, C. Zhang, Z. Shen and M. Li, J. Electroanal. Chem., 2021, 894, 1–10 CrossRef.
- M. Majumder, R. B. Choudhary and A. K. Thakur, Carbon N. Y., 2019, 142, 650–661 CrossRef CAS.
- S. Yamamoto, K. Takeuchi, Y. Hamamoto, R. Y. Liu, Y. Shiozawa, T. Koitaya, T. Someya, K. Tashima, H. Fukidome, K. Mukai, S. Yoshimoto, M. Suemitsu, Y. Morikawa, J. Yoshinobu and I. Matsuda, Phys. Chem. Chem. Phys., 2018, 20, 19532–19538 RSC.
- R. Kessel and J. W. Schultze, Surface Analytical and Photoelectrochemical Investigations of Conducting Polymers, 1990, vol. 16 Search PubMed.
- W. Liu, Q. Kang, L. Wang, L. Wen and Z. Li, Environ. Sci. Pollut. Res., 2022, 29, 51989–52002 CrossRef CAS PubMed.
- P. G. Choi, N. Izu, N. Shirahata and Y. Masuda, ACS Appl. Nano Mater., 2019, 2, 1820–1827 CrossRef CAS.
- F. Wang, H. Zhao, G. Zhang, H. Zhang, X. Han and K. Chu, Adv. Funct. Mater., 2023, 34, 1–9 Search PubMed.
- N. Isoda, H. Yokoyama, M. Nojiri, S. Suzuki and K. Yamaguchi, Bioelectrochemistry, 2010, 77, 82–88 CrossRef CAS PubMed.
- E. Murphy, Y. Liu, I. Matanovic, M. Rüscher, Y. Huang, A. Ly, S. Guo, W. Zang, X. Yan, A. Martini, J. Timoshenko, B. R. Cuenya, I. V. Zenyuk, X. Pan, E. D. Spoerke and P. Atanassov, Nat. Commun., 2023, 14, 4554 CrossRef CAS.
- X. Liu, W. Sun, X. Hu, J. Chen and Z. Wen, Chem. Eng. J., 2023, 474, 1–10 Search PubMed.
- L. Zhu, J. Huang, G. Meng, T. Wu, C. Chen, H. Tian, Y. Chen, F. Kong, Z. Chang, X. Cui and J. Shi, Nat. Commun., 2023, 14, 1–13 Search PubMed.
- C. Lim, H. Roh, E. H. Kim, H. Kim, T. Park, D. Lee and K. Yong, Small, 2023, 19, 1–11 Search PubMed.
- L. Mattarozzi, S. Cattarin, N. Comisso, P. Guerriero, M. Musiani, L. Vázquez-Gómez and E. Verlato, Electrochim. Acta, 2013, 89, 488–496 CrossRef CAS.
- D. Reyter, D. Bélanger and L. Roué, Electrochim. Acta, 2008, 53, 5977–5984 CrossRef CAS.
- J. Choi, J. Choi, H. L. Du, H. L. Du, C. K. Nguyen, C. K. Nguyen, B. H. R. Suryanto, A. N. Simonov, A. N. Simonov, D. R. MacFarlane and D. R. MacFarlane, ACS Energy Lett., 2020, 5, 2095–2097 CrossRef CAS.
- S. Liu, L. Cui, S. Yin, H. Ren, Z. Wang, Y. Xu, X. Li, L. Wang and H. Wang, Appl. Catal., B, 2022, 319, 1–8 Search PubMed.
- S. Giddey, S. P. S. Badwal and A. Kulkarni, Int. J. Hydrogen Energy, 2013, 38, 14576–14594 CrossRef CAS.
- G. Qing, R. Ghazfar, S. T. Jackowski, F. Habibzadeh, M. M. Ashtiani, C. P. Chen, M. R. Smith and T. W. Hamann, Chem. Rev., 2020, 120, 5437–5516 CrossRef CAS PubMed.
- C. J. M. Van Der Ham, M. T. M. Koper and D. G. H. Hetterscheid, Chem. Soc. Rev., 2014, 43, 5183–5191 RSC.
- L. Kortekaas, F. Lancia, J. D. Steen and W. R. Browne, J. Phys. Chem. C, 2017, 121, 14688–14702 CrossRef CAS PubMed.
- C. H. Tsai, P. H. Fei, C. M. Lin and S. L. Shiu, Coatings, 2018, 8, 1–13 Search PubMed.
Footnotes |
| † Electronic supplementary information (ESI) available. See DOI: https://doi.org/10.1039/d4ta02904f |
| ‡ These authors equally contributed to this work. |
| This journal is © The Royal Society of Chemistry 2024 |

