 Open Access Article
Electrocatalytic study of the hydrogen evolution reaction on MoS2/BP and MoSSe/BP in acidic media†
Arunima
Singh
 *,
Manjari
Jain
 ,
Preeti
Bhumla
 and
Saswata
Bhattacharya
 *
*
Department of Physics, Indian Institute of Technology Delhi, Hauz Khas, New Delhi 110016, India. E-mail: saswata@physics.iitd.ac.in; Arunima.Singh@physics.iitd.ac.in
First published on 22nd August 2023
Abstract
Molecular hydrogen (H2) production by the electrochemical hydrogen evolution reaction (HER) is being actively explored for non-precious metal-based electrocatalysts that are earth-abundant and low cost like MoS2. Although it is acid-stable, its applicability is limited by catalytically inactive basal planes, poor electrical transport and inefficient charge transfer at the interface. Therefore, the present work examines its bilayer van der Waals heterostructure (vdW HTS). The second constituent monolayer boron phosphide (BP) is advantageous as an electrode material owing to its chemical stability in both oxygen and water environments. Here, we have performed first-principles based calculations under the framework of density functional theory (DFT) for the HER in an electrochemical double layer model with the BP monolayer, MoS2/BP and MoSSe/BP vdW HTSs. The climbing image nudged elastic band method (CI-NEB) has been employed to determine the minimum energy pathways for Tafel and Heyrovsky reactions. The calculations reveal that the Tafel reaction shows no reaction barrier. Thereafter, for the Heyrovsky reaction, we obtained a low reaction barrier in the vdW HTSs as compared to that in the BP monolayer. Subsequently, we have observed no significant difference in the reaction profile of MoS2/BP and MoSSe/BP vdW HTSs in the case of 2 × 2 supercell configuration. However, in the case of 3 × 3 and 4 × 4 configurations, MoSSe/BP shows a feasible Heyrovsky reaction with no reaction barrier. The coverages with 1/4H+ concentration (conc.) deduced high coverage with low conc. and low coverage with high conc. to be apt for the HER via the Heyrovsky reaction path. Finally, on observing the activation barrier of the Heyrovsky pathway along with that of second H adsorption at the surface, the Heyrovsky path is expected to be favoured.
1 Introduction
The availability of clean and renewable energy sources governs the tenable development. Innovation in systems like fuel cells, metal–air batteries and water electrolysis positively impacts the environment.1 The cleanest alternative for the same is molecular hydrogen (H2) and hence, in the present context, we consider materials that support its production.2,3 The electrochemical reactions that are in sync with the clean environment aim involve the hydrogen oxidation reaction (HOR), oxygen reduction reaction (ORR), hydrogen evolution reaction (HER) and oxygen evolution reaction (OER).4 The former two are associated with fuel cells, while the latter two are associated with water splitting or water electrolysis. There exists a wide range of materials that can catalyze these electrochemical reactions by photocatalytic or electrocatalytic pathways.5–10 The present paper focuses on the HER by electrocatalysts. The HER requires large overpotential to be initiated, and therefore catalysts are required to lower the overpotential.11 In this respect, Pt has established itself to be an efficient catalyst.12 However, its high cost and low abundance have urged the scientific community to find new materials for catalytic applications.13 In fact, any heterogeneous catalysis under periodic boundary conditions faces the challenge of possessing an apt catalytic material that decreases the reaction barrier.14The HER can occur in both acidic and alkaline media. In either of the media, the reaction steps follow (i) adsorption of H, (ii) its reduction and (iii) desorption as H2.15 Now, the HER has been reported to have sluggish kinetics in alkaline media with ambiguous active sites.16,17 Since the electrolytic reactions at the electrode are acidic, we are focusing on acidic media in the present study. The adsorption step is very fast and is termed the Volmer step:18
| Volmer reaction (fast): H+ + e− → Had |
The subsequent steps take place either through Tafel or Heyrovsky paths (Fig. 1).
| Tafel reaction: 2Had → H2 |
| Heyrovsky reaction: Had + H+ + e− → H2 |
 | ||
| Fig. 1 (Color online) HER steps: Volmer is the adsorption step, and Tafel/Heyrovsky is the evolution step. | ||
As previously mentioned, the concept is to obtain material for the reaction that does not include precious metals like Pt. The literature has shown the transition metals (Fe, Ni, and Co), carbides, metal oxides (RuO2 and IrO2), graphene, non-layered 2D materials, metal–organic frameworks (MOFs) and transition metal dichalcogenides (TMDs) as effective HER catalysts.11,15,19–23 We restrict our study to the 2D materials that showcase quantum confinement effects with increased carrier mobility and large surface area.24–26 This results in their increased catalytically active sites. The monolayer TMDs (in place of graphene) have established themselves as a potent material with optimal band gaps suitable for optoelectronics, photocatalysis and electrocatalysis.27–33 In addition, due to their flexibility, these are widely studied for flexible electronic devices. The literature has reported their use as catalysts for the HER, especially on the surface of 1T′-MoS2 and edge sites of 2H-MoS2.34–36 The former is metastable and coexists with other phases (1T′′ and 1T′′′).37 Hence, we consider 2H-MoS2 in our work. MoS2 being acid-stable is an added advantage.38 Furthermore, its heterojunctions have also shown promising HER catalytic behaviour.16,39–41 It is pertinent to mention here that the tunability of 2D materials for specific applications is prevalent by defect engineering, strain engineering, stacking order, external field implementation, alloying and forming heterojunctions.42–48 Amongst them, formation of heterojunctions with van der Waals forces in between the constituent monolayers are classified under van der Waals heterostructures (vdW HTSs). These have proved a real boon to the field of work because the constituent monolayers retain their properties simultaneously with their combined vdW HTS properties.49 In addition, the electronegativity difference between the constituent monolayers actuates electron transfer, thereby affecting the HER.50 Even if the constituent monolayers have inactive sites, the resulting vdW HTS can be obtained as an active electrocatalyst due to an inbuilt electric field at the interface.51
Presently, we explore the boron phosphide (BP) monolayer, MoS2/BP and MoSSe/BP vdW HTSs for the HER. Recent studies have reported vdW HTSs with BP instead of graphene as it has a similar single atomic layered hexagonal structure, however, along with a band gap.52 The BP monolayer has been reported with low carrier effective mass, high carrier mobility, good mechanical strength, and stability in water environments.53,54 Since the lattice parameter of MoS2 and BP is similar, the MoS2/BP vdW HTS becomes a plausible system with minimal lattice mismatch.55 The BP monolayer has also been synthesized experimentally.56 In addition, since Janus (MoSSe) has established itself with more catalytically active sites than MoS2, we have also analyzed the MoSSe/BP vdW HTS. Any prior investigations for the HER on these systems are hitherto unknown; hence we have considered these systems for our work.
The aforementioned HER reaction path should account for the proton and electron free energies.57 These are incorporated by the computational hydrogen electrode model as proposed by Nørskov et al.18 The model caters to the fundamental problem of large-scale calculation of a real system along with electrolyte by following the electrochemical double layer approach rather than external charge formation. The underlying approximation considers solvated protons up to the first bilayer. Until now, no study has been reported for the analysis of vdW HTSs using the computational hydrogen electrode model for the HER in acidic media to the best of our knowledge.58 We have initially discussed the stacking configuration and electronic structure. Subsequently, the computational hydrogen electrode model is discussed. Thereafter, Tafel and Heyrovsky reaction paths are analyzed. Finally, we discuss the electrode potential and the reaction and activation energies.
2 Methodology
The first-principles based density functional theory (DFT) calculations have been employed in the present work.59–64 The associated code chosen is the Vienna ab initio simulation package (VASP)65–67 with projector augmented wave (PAW) pseudopotentials using plane wave basis. The generalized gradient approximation (GGA) that accounts for the exchange–correlation (xc) interaction amongst electrons is incorporated by the PBE xc functional (as proposed by Perdew–Burke–Ernzerhof (PBE)68,69). The Brillouin zone (BZ) sampling of 2 × 2 K-mesh is used for conjugate gradient minimization with an energy tolerance of 0.001 meV and a force tolerance of 0.001 eV Å−1. The intermediate, initial and final energetics are obtained by the BZ sampling of a 6 × 6 K-mesh. The plane wave cutoff energy is set to 500 eV. All the structures are built with 20 Å vacuum that avoids the electrostatic interactions among the periodic images. The two-body Tkatchenko–Scheffler vdW scheme has been employed for obtaining optimized structures.70,71 This is an iterative scheme based on Hirshfeld partitioning of the electron density. We have employed the climbing-image nudged elastic band (CI-NEB) method to obtain the minimum energy path for the HER.72,73 Note that we have not explicitly considered entropy calculations, as in approximation of solvated protons on the first layer, and 0.2–0.3 eV can be added all along the energetics.18 In reference to the previous literature, we have not included the spin–orbit coupling (SOC) in our calculations.74–763 Results and discussion
3.1 Heterostructure
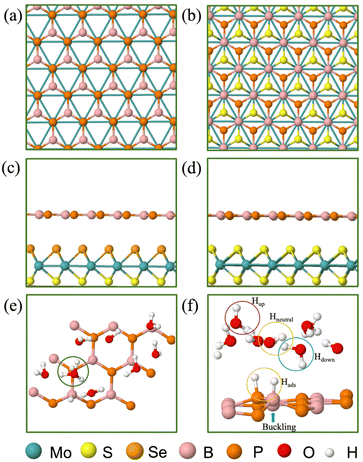
The present paper features the BP monolayer, MoS2/BP and MoSSe/BP vdW HTSs for HER assessment. The lattice parameter of the BP monolayer is 3.20 Å and that of MoS2 is 3.16 Å. Since the lattice mismatch between them is less (1.2% as obtained by (l(MoS2) − l(BP))/l(BP), where l(MoS2) and l(BP) is the lattice constant of MoS2 and BP, respectively), the corresponding MoS2/BP vdW HTS formed is commensurate.77 Its corresponding structural and electronic properties are obtained from unit cell configuration (see Fig. S1–S3 in the ESI†), whereby, MoS2/BP and MoSSe/BP form type 1 and type 2 alignment and it corroborates with the prior research.55,78 Note that, initially, two stacking styles (see Fig. 2(a) and (b)) between the constituent monolayers were considered, wherein the stacking corresponding to Fig. 2(b) has minimum binding energy.39 Therefore, we have proceeded with this stacking in our work.3.2 HER study
Now, we advance on HER study, for which we have constituted 2 × 2, 3 × 3 and 4 × 4 supercells. The former being smaller restricts the proton concentration (conc.) variability; therefore, we need larger supercells. In view of this, we are analyzing the 2 × 2 supercell along with 3 × 3 and 4 × 4, because, unlike the monolayer, the vdW HTS with further large supercell size becomes computationally demanding. The subsequent paragraphs discuss the concepts of coverage and proton conc. for clarity.The first step is to obtain the coverage that gives ΔGH ≃ 0 for our study. The number of adsorbed hydrogen (Hads) per surface atom is defined as the coverage. ΔGH is the free energy of atomic hydrogen adsorption and is expressed as:
| ΔGH = ΔEH + ΔEZPE − TΔSH |
| ΔEH = E[nH] − E[(n − 1)H] − 1/2E[H2] |
In the aforementioned equations, ΔEH is the hydrogen binding energy on the surface of the vdW HTS, E[nH] (or E[(n − 1)H]) is the energy of the configuration with n(or n − 1) number of Hads, ΔEZPE is the zero-point energy of Hads and ΔSH is the entropy of H2 in the gas phase. At 298 K, ΔEZPE − TΔSH = 0.25 eV is well established in the literature.38 We observe the 2 × 2 supercell with 25% H coverage (2Hads per 8 surface atoms) and the 3 × 3 supercell with 11% H coverage (2Hads per 18 surface atoms) with ΔGH equal to −0.024 eV and 0.049 eV, respectively. We have deduced these coverages after trials up to 38%. The 4 × 4 supercell shares the same coverage and H+ conc. as in the case of the 2 × 2 supercell. We have chosen consecutive B and P atomic sites for Hads as this configuration was found to be the most stable. Also, we observed buckling at the site of Hads (see Fig. 2(f)).
We now discuss the optimized systems consisting of a water layer (water–solid interface with a 3 Å thick water layer) without and with solvated protons (i.e., H+). Fig. 2(e) shows the BP monolayer (2Hads) with H+ in the 3 × 3 supercell. Note that the H+ is in the form of hydronium (H3O) in the water layer. The 2 × 2 supercell is a small supercell and therefore, only 1H+ is been considered. However, the corresponding H2O molecules in the water layer are varied, thereby constituting 1/3 (i.e., 1H+/3H2O) and 1/4 (i.e., 1H+/4H2O) H+ conc. The configuration corresponding to the 3 × 3 supercell size has been studied for 1/8 (i.e., 1H+/8H2O) H+ conc. The 4 × 4 supercell size with 12 and 16H2O has been studied for 1/3 and 1/4H+ conc. The water orientation (see Fig. 2(f)) over the Hads species is flat and Hup orientation is usually seen on the topmost layer. Further, all H2O molecules are not Hdown, rather, they are at some angular orientations other than strict Hup and Hdown configurations. These orientations are essential because the electrostatic potential, as seen from the solid surface, also depends on the same. The stability of the vdW HTS along with water layer orientation is established by the similar profile of the radial distribution plot at 0 K and 300 K (see Fig. S8 in the ESI†).
3.3 Tafel reaction step
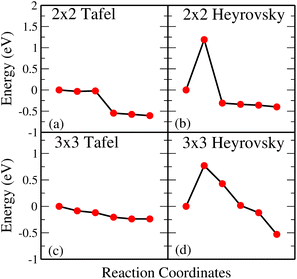
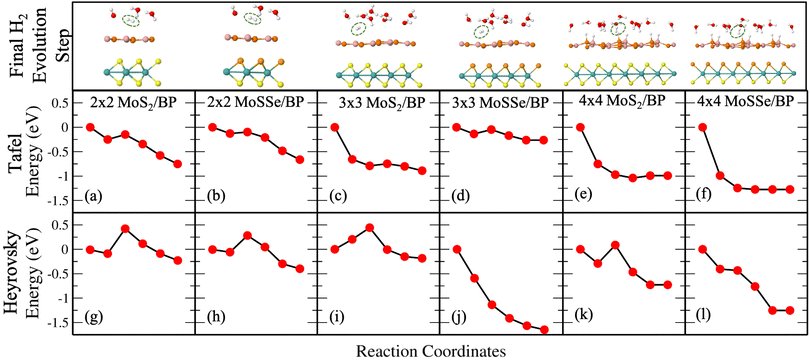
Fig. 3(a) and (b) give Tafel and Heyrovsky reaction steps, respectively on the BP monolayer. This corresponds to the 2 × 2 supercell with 3H2O molecules and 1/3H+ conc., respectively. The BP monolayer acts as a reference to analyze the reactions for the MoS2/BP and MoSSe/BP vdW HTSs. Here, we observe a reaction barrier in the Heyrovsky reaction step (1.19 eV) and not in the case of the Tafel reaction step. The reaction steps for the 3 × 3 supercell and 1/8H+ conc. are given in Fig. 3(c) and (d), whereby the Tafel reaction steps show no barrier and the Heyrovsky reaction steps show a reduced reaction barrier as compared to that in the 2 × 2 supercell. Further, we first discuss the Tafel reaction step analysis for the vdW HTSs. Fig. 4 highlights the Tafel reaction step on the MoS2/BP ((a), (c) and (e)) and MoSSe/BP ((b), (d) and (f)) vdW HTSs. Firstly, no significant difference is observed between MoS2/BP and MoSSe/BP vdW HTSs for the 2 × 2 supercell. The overview of the Tafel reaction analysis is consistent with Tafel being a surface reaction, thereby, lower or no observed reaction barrier. We observed that the minimum energy profile in the Tafel reaction is not continuously decreasing; instead, a slight hump is present. This corresponds to the buckling in the BP monolayer. As previously mentioned, the site of Hads is buckled with respect to other sites, and during the H2 evolution process, the corresponding BP site adjusts itself to the planar configuration (see Fig. 5). Note that the BP surface is considered for the reaction analysis as the basal plane of MoS2 is not catalytically active.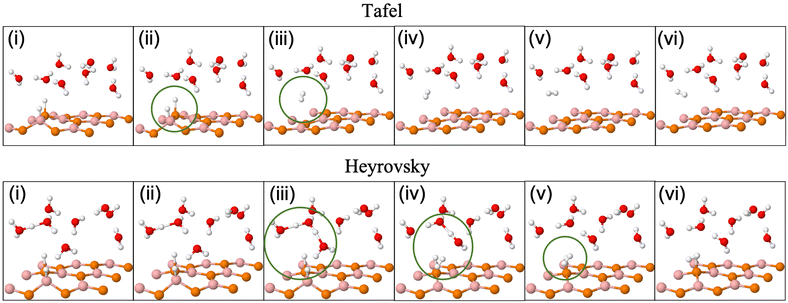 | ||
| Fig. 5 (Color online) Tafel (upper row) and Heyrovsky (lower row) reaction profile snapshots on the 3 × 3 BP surface. | ||
Now, the Tafel reaction path discussed in the manuscript is for two adjacent H-atom desorption as a molecular H2. We have also performed the calculations on the 2 × 2 supercell to check the sites and the corresponding activation barrier (Volmer step). The first step consists of the transfer of H+ to H adsorbed at the P (HadsP) or B (HadsB) site, where the HadsB shows lower barrier than HadsP. The second step is the H adsorption when the surface already has Hads at any other site. In the case of second HadsB, with already existing HadsP we obtain a barrier in the range of 0.05 eV – 0.08 eV. However, when the HadsB precedes HadsP, the final structure is at a higher ground energy state than the initial structure. Hence, this reaction path is not possible. The aforementioned observation is for both MoS2/BP and MoSSe/BP vdW HTSs (see Fig. S9 in the ESI†).
3.4 Heyrovsky reaction step
Unlike Tafel, the Heyrovsky reaction step is not a pure surface reaction. It involves charge transfer, thereby affecting the reaction barrier and Fig. 4(g)–(l) substantiate the same. We have observed a reduction in the reaction barrier in the vdW HTSs as compared to that in the BP monolayer (refer to Fig. 3 and 4). The 4 × 4 supercell configuration puts forth the lowest reaction barrier amongst the three supercell configurations. MoS2/BP and MoSSe/BP demonstrate this reduction from 0.43 eV (Fig. 4(g)) to 0.08 eV (Fig. 4(k)) and 0.28 eV (Fig. 4(h)) to 0 eV (Fig. 4(l)), respectively. Apart from previously discussed, we also considered the 4 × 4 supercell corresponding to the 15.6% H coverage (5Hads per 32 surface atoms) with ΔGH equal to 0.026 eV and 1/3H+ conc., for the Heyrovsky reaction step. In this case, a 0.09 eV reaction barrier is observed for MoS2/BP, whereas MoSSe/BP showed 0 eV. Further, we observe a significant change in the case of MoSSe and this may be attributed to the combined effect of the coverage and the electronegativity difference within the MoSSe layer that affects the charge transfer at the interface.Apart from the factors that are discussed above, there are structural parameters that affect the reaction steps. The H bonds in H3O+ stretch before combining with the Hads. At the transition state, H2 is formed. After that, the atoms adjust themselves to low energy configuration. After the intermediate step, the B and P atoms adjust, corresponding to Hads, along with the other H2O molecules. As in the Tafel scenario, the steps post H2 formation optimize the H2 molecule in the water layer. The reaction barrier, therefore, depends on the buckling in the monolayer, the water molecule's orientation, and the coexisting water molecules with H+ (see Fig. 5).
Finally, we discuss the Heyrovsky reaction in MoS2/BP for 1/4H+ conc. in the cases of 2 × 2 (i.e., 1H+/4H2O), 3 × 3 (i.e., 2H+/8H2O) and 4 × 4 (i.e., 4H+/16H2O) supercells. We observed that the reaction barrier decreases from 0.43 eV (Fig. 4(g)) to 0.09 eV (Fig. 6(a)), 0.44 eV (Fig. 4(i)) to 0 eV (Fig. 6(b)) and 0.08 eV (Fig. 4(k)) to 0 eV (Fig. 6(c)) in 2 × 2, 3 × 3 and 4 × 4 supercells, respectively. This indicates that high coverage prefers low H+ conc. and vice versa for a reduction in the reaction barrier.
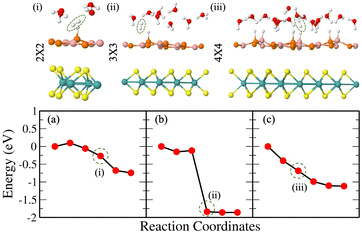 | ||
| Fig. 6 (Color online) Heyrovsky reaction path for the MoS2/BP vdW HTS with 1/4H+ conc. in (a) 2 × 2 supercell, (b) 3 × 3 supercell and (c) 4 × 4 supercell. | ||
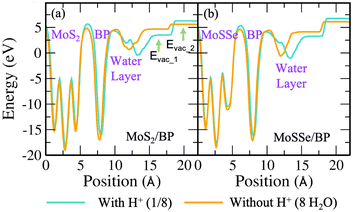
Note that till now we discussed the H2 evolution that includes H+ and HadsB. The trend with supercell size is the same in the case of HadsP as well (see Fig. S10 and S11 in the ESI†). However, for a particular supercell the reaction barrier for the latter is smaller than the former, indicating that H+ would initially prefer combining with HadsP. We correlate this with the overpotential of the reaction, as discussed in the following section. Overpotential is the difference between the experimentally obtained reaction potential and the electrode potential. The electrode potential is analyzed only in the Heyrovsky reaction as it involves proton transfer. Therefore, this affects the work function and the potential at which the reaction takes place.
3.5 Electrode potential
The electrode potential (U) of the slab is reported relative to the normal hydrogen electrode (NHE):| U = ϕ − ϕNHE |
| vdW HTSs | With H+ | Without H+ | ||
|---|---|---|---|---|
| U 1 (V) | U 2 (V) | U 1 (V) | U 2 (V) | |
| MoS2/BP (2 × 2) | −2.31 | 0.48 | 1.04 | 0.70 |
| MoSSe/BP (2 × 2) | −1.83 | 1.07 | −0.68 | 1.31 |
| MoS2/BP (3 × 3) | −2.09 | −0.05 | −0.09 | 0.84 |
| MoSSe/BP (3 × 3) | −2.55 | 0.90 | −0.79 | 1.19 |
| MoS2/BP (4 × 4) | −2.12 | 0.39 | −0.20 | −0.75 |
| MoSSe/BP (4 × 4) | −2.08 | 1.02 | 1.27 | 1.27 |
As the dependence of ϕ on water orientation has been previously discussed, we have explicitly optimized the Hdown configuration for H2O molecules. The Heyrovsky reaction path for the same in MoS2/BP and MoSSe/BP 3 × 3 supercells can be seen in Fig. S16(a) and (b) of the ESI.† The obtained barrier is reduced as compared to the 2 × 2 supercells of MoS2/BP and MoSSe/BP and the 3 × 3 supercell of MoS2/BP. The corresponding electrode potential is also reported in Fig. S16(c) and (d) of the ESI.†
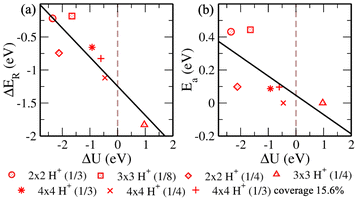
Now we progress towards the extrapolation approach to address the problem of potential change from initial to final in the case of the proton transfer Heyrovsky reaction. In this approach, we obtain reaction energies and activation energies of the system with different supercell sizes and H+ conc. The former represents the energy difference between the initial and final states, while the latter is the amount of energy required to overcome the reaction barrier. Thereafter, we obtain ΔER and Eavs. ΔU plot. ΔU signifies a change in electrode potential from initial to final. Moreover, the change in U1 (corresponding to water layer potential) is significant as compared to the change in U2 (corresponding to MoS2 layer potential). The potential drop and charge transfer would accordingly affect the U1 and U2. Hence, the reaction taking place at the BP layer surface is crucial and we must consider U1 for our analysis of electrode potential. Therefore, ΔU represented in the plot is corresponding to U1. On extrapolating ΔER to ΔU = 0, we obtain −1.24 eV. The negative value indicates the spontaneity of the Heyrovsky reaction step. In the case of positive ΔER, the Heyrovsky reaction would have been the rate-determining step. The corresponding Ea is obtained as 0.05 eV. Hence, on comparing the vdW HTS with the monolayer, the synergistic effect of the two layers plays a role in affecting the overpotential and hence the reaction mechanism.
Now, we revisit the observations systematically. HadsB shows lower ground state energy and reaction barrier than HadsP. Also, we obtain a barrier in the range 0.05 eV – 0.08 eV when HadsP precedes HadsB at the surface. The vice versa observes higher ground state energy of the final structure state than the initial structure. Therefore, though the Tafel reaction path shows no reaction barrier, the above mentioned proton transfer (Volmer step) is restricted on sites. Subsequently, for the Heyrovsky reaction path, we observe the lower barrier for H2 evolution that includes H+ and HadsP. Hence, the extrapolated Heyrovsky Ea of 0.05 eV further indicates the Heyrovsky reaction path to be plausible.
Finally, it is pertinent to discuss the challenges for any further study. The present attempt to analyze the bilayer vdW HTSs with the explicit solvation approach (with few water layer molecules of 3 Å) would be computationally cumbersome if the monolayers or atomic layers increase. The large atomic size of the system also affects the proton concentration data and transition state search. Hence, the accountability of charge and potential should shift towards an approach that entails both explicit and implicit, and the employability of machine learning potentials. This would ensure the study of large systems with reduced computational time and cost.80–82
4 Conclusion
In summary, we have modelled dynamically stable MoS2/BP and MoSSe/BP vdW HTSs. They have been studied for the HER using the computational hydrogen electrode model. The optimized structure with the water layer showed a significant potential drop at the surface–water interface. The electrostatic potential is further affected by the proton solvated in the water layer and the Hads constituting coverage over the surface. 2 × 2, 3 × 3 and 4 × 4 supercells with 25%, 11% and 25% H coverage have been deduced for the calculations. First, MoS2/BP and MoSSe/BP vdW HTSs show reduced barrier height for both Tafel and Heyrovsky reactions in comparison to the BP monolayer. The Tafel reaction, being a surface reaction does not require charge transfer, herein corroborates with no or lower barrier observed in the MoS2/BP and MoSSe/BP vdW HTSs. The analysis of H adsorption at B and P sites infers HadsB with lower ground state energy. The second Volmer step restricts the path of HadsB preceding the HadsP. In the case of the Heyrovsky reaction, a reduced reaction barrier has been reported for HadsP. Further, there is no significant difference between the MoSSe/BP and MoS2/BP vdW HTS, as observed from the minimum energy reaction paths, except in the case of 11% coverage of MoSSe/BP with no reaction barrier. Hence, the MoSSe-based vdW HTS has shown that the Heyrovsky reaction favoured the HER for low coverage. On comparing the supercells (and hence different coverages) with respect to the same H+ conc., we observe high coverage to favour low H+ conc. and vice versa for a reduced reaction barrier. Finally, as per the extrapolation approach for ΔERvs. ΔU, the Heyrovsky reaction mechanism is plausible.Conflicts of interest
There are no conflicts of interest to declare.Acknowledgements
AS acknowledges IIT Delhi for the senior research fellowship. MJ acknowledges CSIR, India, for the senior research fellowship [grant no. 09/086(1344)/2018-EMR-I]. PB acknowledges UGC, India, for the senior research fellowship [1392/(CSIR-UGC NET JUNE 2018)]. S. B. acknowledges financial support from SERB under a core research grant (Grant No. CRG/2019/000647) to set up his high-performance computing (HPC) facility “Veena” at IIT Delhi for computational resources.References
- X. Zhang, A. Chen, L. Chen and Z. Zhou, Adv. Energy Mater., 2022, 12, 2003841 CrossRef CAS.
- S. Chu and A. Majumdar, Nature, 2012, 488, 294–303 CrossRef CAS PubMed.
- Z. W. Seh, J. Kibsgaard, C. F. Dickens, I. Chorkendorff, J. K. Nørskov and T. F. Jaramillo, Science, 2017, 355, 4998 CrossRef.
- V. Vij, S. Sultan, A. M. Harzandi, A. Meena, J. N. Tiwari, W.-G. Lee, T. Yoon and K. S. Kim, ACS Catal., 2017, 7, 7196–7225 CrossRef CAS.
- Q. Lu, Y. Yu, Q. Ma, B. Chen and H. Zhang, Adv. Mater., 2016, 28, 1917–1933 CrossRef CAS.
- L. Cao and C. Wang, ACS Cent. Sci., 2020, 6, 2149–2158 CrossRef CAS PubMed.
- H. Jin, T. Song, U. Paik and S.-Z. Qiao, Acc. Mater. Res., 2021, 2, 559–573 CrossRef CAS.
- N. Abidi, K. R. G. Lim, Z. W. Seh and S. N. Steinmann, Wiley Interdiscip. Rev.: Comput. Mol. Sci., 2021, 11, e1499 CAS.
- N. Abidi, A. Bonduelle-Skrzypczak and S. N. Steinmann, ACS Appl. Mater. Interfaces, 2020, 12, 31401–31410 CrossRef CAS PubMed.
- M. Jain, D. Gill, S. Monga and S. Bhattacharya, J. Phys. Chem. C, 2023, 127, 15620–15629 CrossRef CAS.
- H. Zhang, X. Yang, H. Zhang, J. Ma, Z. Huang, J. Li and Y. Wang, Chem.–Eur. J., 2021, 27, 5074–5090 CrossRef CAS PubMed.
- J. N. Hansen, H. Prats, K. K. Toudahl, N. Mørch Secher, K. Chan, J. Kibsgaard and I. Chorkendorff, ACS Energy Lett., 2021, 6, 1175–1180 CrossRef CAS PubMed.
- G. Zhao, J. Chen, W. Sun and H. Pan, Adv. Funct. Mater., 2021, 31, 2010633 CrossRef CAS.
- Y. Shi, Z.-R. Ma, Y.-Y. Xiao, Y.-C. Yin, W.-M. Huang, Z.-C. Huang, Y.-Z. Zheng, F.-Y. Mu, R. Huang and G.-Y. Shi, et al. , Nat. Commun., 2021, 12, 1–11 CrossRef PubMed.
- H. Jin, C. Guo, X. Liu, J. Liu, A. Vasileff, Y. Jiao, Y. Zheng and S.-Z. Qiao, Chem. Rev., 2018, 118, 6337–6408 CrossRef CAS PubMed.
- J. Wei, M. Zhou, A. Long, Y. Xue, H. Liao, C. Wei and Z. J. Xu, Nano-Micro Lett., 2018, 10, 1–15 CrossRef PubMed.
- S. Li, S. Sirisomboonchai, X. An, X. Ma, P. Li, L. Ling, X. Hao, A. Abudula and G. Guan, Nanoscale, 2020, 12, 6810–6820 RSC.
- E. Skúlason, G. S. Karlberg, J. Rossmeisl, T. Bligaard, J. Greeley, H. Jónsson and J. K. Nørskov, Phys. Chem. Chem. Phys., 2007, 9, 3241–3250 RSC.
- Y. Wang, Z. Zhang, Y. Mao and X. Wang, Energy Environ. Sci., 2020, 13, 3993–4016 RSC.
- Y. Wang, H. Zhang, X. Yang, J. Ma, Z. Huang and J. Li, Chemistry, 2020, 118, 5074–5090 Search PubMed.
- J. Du, F. Li and L. Sun, Chem. Soc. Rev., 2021, 50, 2663–2695 RSC.
- D. V. Esposito, S. T. Hunt, Y. C. Kimmel and J. G. Chen, J. Am. Chem. Soc., 2012, 134, 3025–3033 CrossRef CAS PubMed.
- S. Trasatti, Electrochim. Acta, 1991, 36, 225–241 CrossRef CAS.
- S. H. Mir, V. K. Yadav and J. K. Singh, ACS Omega, 2020, 5, 14203–14211 CrossRef CAS PubMed.
- X. Zhang, B. Wang, X. Niu, Y. Li, Y. Chen and J. Wang, Mater. Horiz., 2018, 5, 1058–1064 RSC.
- K. Khan, A. K. Tareen, M. Aslam, Y. Zhang, R. Wang, Z. Ouyang, Z. Gou and H. Zhang, Nanoscale, 2019, 11, 21622–21678 RSC.
- A. Singh, P. Basera, S. Saini, M. Kumar and S. Bhattacharya, J. Phys. Chem. C, 2020, 124, 1390–1397 CrossRef CAS.
- Y. Chen, S. Huang, X. Ji, K. Adepalli, K. Yin, X. Ling, X. Wang, J. Xue, M. Dresselhaus and J. Kong, et al. , ACS Nano, 2018, 12, 2569–2579 CrossRef CAS PubMed.
- C. Rao, K. Gopalakrishnan and U. Maitra, ACS Appl. Mater. Interfaces, 2015, 7, 7809–7832 CrossRef CAS PubMed.
- E. Singh, P. Singh, K. S. Kim, G. Y. Yeom and H. S. Nalwa, ACS Appl. Mater. Interfaces, 2019, 11, 11061–11105 CrossRef CAS PubMed.
- H. Zeng, G.-B. Liu, J. Dai, Y. Yan, B. Zhu, R. He, L. Xie, S. Xu, X. Chen and W. Yao, et al. , Sci. Rep., 2013, 3, 1608 CrossRef PubMed.
- C.-Y. Wang and G.-Y. Guo, J. Phys. Chem. C, 2015, 119, 13268–13276 CrossRef.
- R. Kronberg, M. Hakala, N. Holmberg and K. Laasonen, Phys. Chem. Chem. Phys., 2017, 19, 16231–16241 RSC.
- H. Wang, X. Xiao, S. Liu, C.-L. Chiang, X. Kuai, C.-K. Peng, Y.-C. Lin, X. Meng, J. Zhao and J. Choi, et al. , J. Am. Chem. Soc., 2019, 141, 18578–18584 CrossRef CAS PubMed.
- J. Chen, F. Li, Y. Tang and Q. Tang, J. Mater. Chem. C, 2020, 8, 15852–15859 RSC.
- N. Abidi, A. Bonduelle-Skrzypczak and S. N. Steinmann, J. Phys. Chem. C, 2021, 125, 17058–17067 CrossRef CAS.
- C. Shang, Y. Fang, Q. Zhang, N. Wang, Y. Wang, Z. Liu, B. Lei, F. Meng, L. Ma and T. Wu, et al. , Phys. Rev. B, 2018, 98, 184513 CrossRef CAS.
- Q. Tang and D.-e. Jiang, ACS Catal., 2016, 6, 4953–4961 CrossRef CAS.
- A. Singh, M. Jain and S. Bhattacharya, Nanoscale Adv., 2021, 3, 2837–2845 RSC.
- F. Ling, W. Kang, H. Jing, W. Zeng, Y. Chen, X. Liu, Y. Zhang, L. Qi, L. Fang and M. Zhou, npj Comput. Mater., 2019, 5, 20 CrossRef.
- F. Keivanimehr, S. Habibzadeh, A. Baghban, A. Esmaeili, A. Mohaddespour, A. H. Mashhadzadeh, M. R. Ganjali, M. R. Saeb, V. Fierro and A. Celzard, Sci. Rep., 2021, 11, 1–9 CrossRef PubMed.
- J. Wan, S. D. Lacey, J. Dai, W. Bao, M. S. Fuhrer and L. Hu, Chem. Soc. Rev., 2016, 45, 6742–6765 RSC.
- J. Zhao, Q. Deng, A. Bachmatiuk, G. Sandeep, A. Popov, J. Eckert and M. H. Rümmeli, Science, 2014, 343, 1228–1232 CrossRef CAS PubMed.
- W. Bao, L. Jing, J. Velasco, Y. Lee, G. Liu, D. Tran, B. Standley, M. Aykol, S. Cronin and D. Smirnov, et al. , Nat. Phys., 2011, 7, 948–952 Search PubMed.
- J. Feng, X. Qian, C.-W. Huang and J. Li, Nat. Photonics, 2012, 6, 866–872 CrossRef CAS.
- F. Wang, Y. Zhang, C. Tian, C. Girit, A. Zettl, M. Crommie and Y. R. Shen, Science, 2008, 320, 206–209 CrossRef CAS PubMed.
- J. J. Humphrey, R. Kronberg, R. Cai, K. Laasonen, R. E. Palmer and A. J. Wain, Nanoscale, 2020, 12, 4459–4472 RSC.
- J. Xie, X. Yang and Y. Xie, Nanoscale, 2020, 12, 4283–4294 RSC.
- G. Swain, S. Sultana and K. Parida, Nanoscale, 2021, 13, 9908–9944 RSC.
- G. Zhao, K. Rui, S. X. Dou and W. Sun, Adv. Funct. Mater., 2018, 28, 1803291 CrossRef.
- S. Bawari, N. M. Kaley, S. Pal, T. V. Vineesh, S. Ghosh, J. Mondal and T. N. Narayanan, Phys. Chem. Chem. Phys., 2018, 20, 15007–15014 RSC.
- H. Şahin, S. Cahangirov, M. Topsakal, E. Bekaroglu, E. Akturk, R. T. Senger and S. Ciraci, Phys. Rev. B: Condens. Matter Mater. Phys., 2009, 80, 155453 CrossRef.
- J. Wu, J.-H. Li and Y.-X. Yu, ACS Appl. Mater. Interfaces, 2021, 13, 10026–10036 CrossRef CAS PubMed.
- T. V. Vu, A. Kartamyshev, N. V. Hieu, T. D. Dang, S.-N. Nguyen, N. Poklonski, C. V. Nguyen, H. V. Phuc and N. N. Hieu, RSC Adv., 2021, 11, 8552–8558 RSC.
- M. K. Mohanta, A. Rawat, N. Jena, Dimple, R. Ahammed and A. De Sarkar, ACS Appl. Mater. Interfaces, 2019, 12, 3114–3126 CrossRef PubMed.
- B. Padavala, C. Frye, X. Wang, Z. Ding, R. Chen, M. Dudley, B. Raghothamachar, P. Lu, B. Flanders and J. Edgar, Cryst. Growth Des., 2016, 16, 981–987 CrossRef CAS.
- Y. Xiao and W. Zhang, Nanoscale, 2020, 12, 7660–7673 RSC.
- J. D. Wiensch, J. John, J. M. Velazquez, D. A. Torelli, A. P. Pieterick, M. T. McDowell, K. Sun, X. Zhao, B. S. Brunschwig and N. S. Lewis, ACS Energy Lett., 2017, 2, 2234–2238 CrossRef CAS.
- R. M. Martin, Electronic Structure: Basic Theory and Practical Methods, Cambridge University Press, 2004 Search PubMed.
- R. M. Martin, L. Reining and D. M. Ceperley, Interacting Electrons, Cambridge University Press, 2016 Search PubMed.
- C. Freysoldt, B. Grabowski, T. Hickel, J. Neugebauer, G. Kresse, A. Janotti and C. G. Van de Walle, Rev. Mod. Phys., 2014, 86, 253 CrossRef.
- L.-p. Feng, J. Su, S. Chen and Z.-T. Liu, Mater. Chem. Phys., 2014, 148, 5–9 CrossRef CAS.
- P. Hohenberg and W. Kohn, Phys. Rev., 1964, 136, B864 CrossRef.
- W. Kohn and L. J. Sham, Phys. Rev., 1965, 140, A1133 CrossRef.
- G. Kresse and J. Furthmüller, Phys. Rev. B: Condens. Matter Mater. Phys., 1996, 54, 11169 CrossRef CAS PubMed.
- P. E. Blöchl, Phys. Rev. B: Condens. Matter Mater. Phys., 1994, 50, 17953 CrossRef PubMed.
- V. Blum, R. Gehrke, F. Hanke, P. Havu, V. Havu, X. Ren, K. Reuter and M. Scheffler, Comput. Phys. Commun., 2009, 180, 2175–2196 CrossRef CAS.
- C. Stampfl and C. Van de Walle, Phys. Rev. B: Condens. Matter Mater. Phys., 1999, 59, 5521 CrossRef CAS.
- J. P. Perdew, K. Burke and M. Ernzerhof, Phys. Rev. Lett., 1996, 77, 3865 CrossRef CAS PubMed.
- A. Tkatchenko and M. Scheffler, Phys. Rev. Lett., 2009, 102, 073005 CrossRef PubMed.
- A. Tkatchenko, R. A. DiStasio Jr, R. Car and M. Scheffler, Phys. Rev. Lett., 2012, 108, 236402 CrossRef PubMed.
- G. Henkelman, B. P. Uberuaga and H. Jónsson, J. Chem. Phys., 2000, 113, 9901–9904 CrossRef CAS.
- G. Henkelman and H. Jónsson, J. Chem. Phys., 2000, 113, 9978–9985 CrossRef CAS.
- C.-F. Fu, Q. Luo, X. Li and J. Yang, J. Mater. Chem. A, 2016, 4, 18892–18898 RSC.
- J. Weng and S.-P. Gao, Phys. Chem. Chem. Phys., 2018, 20, 26453–26462 RSC.
- K. Ren, W. Tang, M. Sun, Y. Cai, Y. Cheng and G. Zhang, Nanoscale, 2020, 12, 17281–17289 RSC.
- A. U. Rahman, J. M. Morbec, G. Rahman and P. Kratzer, Phys. Rev. Mater., 2018, 2, 094002 CrossRef CAS.
- K. Ren, M. Sun, Y. Luo, S. Wang, J. Yu and W. Tang, Appl. Surf. Sci., 2019, 476, 70–75 CrossRef CAS.
- Q. He, X. Chen, S. Chen, L. Liu, F. Zhou, X.-B. Li and G. Wang, ACS Appl. Mater. Interfaces, 2018, 11, 2944–2949 CrossRef PubMed.
- M. Liu, Y. Jin and J. Pan, Mater. Today Commun., 2022, 31, 103425 CrossRef CAS.
- S. Steinmann, Q. Wang and Z. W. Seh, Mater. Horiz., 2023, 10, 393–406 RSC.
- C. Schran, F. L. Thiemann, P. Rowe, E. A. Müller, O. Marsalek and A. Michaelides, Proc. Natl. Acad. Sci. U. S. A., 2021, 118, e2110077118 CrossRef CAS PubMed.
Footnote |
| † Electronic supplementary information (ESI) available. See DOI: https://doi.org/10.1039/d3na00215b |
| This journal is © The Royal Society of Chemistry 2023 |

