Unraveling the role of chemical composition in the lattice thermal conductivity of oxychalcogenides as thermoelectric materials†
Ernesto J.
Blancas
 a,
Jose J.
Plata
 *a,
Julia
Santana
a,
Felipe
Lemus-Prieto
b,
Antonio M.
Márquez
 a and
Javier Fdez.
Sanz
a
aDepartamento de Química Física, Facultad de Química, Universidad de Sevilla, Seville, Spain. E-mail: jplata@us.es
bResearch, Technological Innovation and Supercomputing Center of Extremadura (CenitS), Cáceres, Spain
First published on 20th June 2022
Abstract
Oxychalcogenides represent a large chemical space with potential application as thermoelectric materials due to their low thermal conductivity. However, the nature of this behaviour is still under debate. Understanding the origin of the anharmonicity of these materials is key to developing models that improves the efficiency of thermoelectric materials. In this work, we combine machine learning with first principles calculations to explore oxychalcogenides materials. Machine learning not only accelerates the prediction of the lattice thermal conductivity for large chemical spaces with high accuracy, but also catalyzes the development of design principles to discover new thermoelectric materials. Using this approach, lattice thermal conductivity has been directly connected to the effect of each species in the material, using atomic projections of the scattering rates. The role of the monovalent atom and the lone pair electron for the trivalent cation are discussed in detail. Based on this knowledge, it is possible to connect complex properties such as lattice thermal conductivity with a more manageable synthetic variable such as chemical composition. Using this strategy, we propose promising new oxychalcogenides such as BiOAgSe, which subsequently has been confirmed as having ultra-low lattice thermal conductivity and BiOAg0.5Cu0.5Se which presents a lower κl and promising properties for thermoelectricity.
1 Introduction
Global energy demands require the development of new strategies to improve the efficiency of our energy grid and, simultaneously, accelerate the transition to renewable energies. Thermoelectric, TE, materials are one of the best available solutions when it comes to reducing the dependency on fossil fuels and making other green energy resources more cost efficient. However, the discovery and optimization of new thermoelectric materials face many obstacles. The efficiency of a thermoelectric materials, measured by its figure of merit ZT, rarely surpassed 1 during the last 50 years of the 20th century. This is partially due to the relationship between the transport properties that define ZT, | (1) |
The experimental measurement of κl or any other of the transport properties involved in ZT represent another obstacle. Most of these properties are extremely sensitive to synthesis conditions, hampering the systematic exploration of large chemical spaces. Despite of these difficulties, thermoelectric materials are experiencing a renaissance during last two decades.3 Atomistic simulations and computational materials science have propelled the discovery of many TE materials with ZT values above 2.4 Nevertheless, there is plenty of room for improvement in this area. For instance, the accurate prediction of κl requires large and expensive ab initio molecular dynamics, MD,5 or the calculation, at least, of 3rd-order interatomic forces constants, IFCs.6
Machine learning, ML, has recently emerged as the ideal strategy for reducing computational costs when calculating κl. Accurate ML-based potentials have reduced the computational cost of approaches based on MD7 and new methods have been developed to extract nth-order IFCs using ML at a reduced cost.8,9 These new approaches have changed the paradigm when exploring new TE materials. Exploring large chemical spaces is no longer a problem, and the scientific community is focusing on extracting design principles for these large amount of data.10 However, this last step cannot be underestimated. Connecting real space variables such as chemical composition with reciprocal-space variables which determine transport properties is fundamental for developing new and more efficient TE materials.11
Oxychalcogenides represent one of these large chemical spaces that need to be explored in more detail.12 Since BiOCuSe was reported as a promising TE material in 2011,13,14 a large amount of data has been published with respect to their TE performance.15–17 For instance, different strategies have been proposed to increase their power factor, such as doping,18 alloying19 or engineering grain boundaries.20 Torimayama et al. have recently demonstrated that electron transport properties of these materials can be improved through n-type doping instead of p-type doping.21 However, the key property that make oxychalcogenides excel as TE materials is their low lattice thermal conductivity. Interestingly, this fact has been attributed to different factors, and there is still some controversy. For instance, Ding et al. described how anharmonic vibrations and structural scattering of phonons are partially caused by in-layer and interlayer off-phase vibrational modes.22 Saha et al. compared the vibrational properties of BiOCuSe and LaOCuSe, finding that the main reason for their different κl is the mass difference between Bi and La.23,24 Additionally, Vaqueiro et al. combined DFT calculations with analysis of in situ neutron diffraction data to demonstrate that weak bonding of copper atoms play a crucial role, reducing the lattice thermal conductivity of these compounds.25 Although all these works present solid proofs, most of them are based on the calculation of the harmonic force constants to study harmonic (phonon dispersion curves) or quasi-harmonic (Grüneisen parameters) properties. Lattice thermal conductivity is a property that stems from the anharmonicity of the material, thus, features such as anharmonic force constants and scattering rates are essential to understanding its behavior. However, until recently, exploring highly computationally demanding properties such a κl in large chemical spaces was an unaffordable task.
Here, we present a new approach in which the low thermal conductivity of oxychalcogenides is directly connected to their chemical composition. Machine learning is combined with first principles calculations to accelerate the calculation of κl for oxychalcogenides. These results are analyzed through atomic-projected scattering rates-frequency heat maps, unraveling the role of each element in the anharmonicity and lattice thermal conductivity of these materials.
2 Methodology
2.1 Geometry optimization
The atoms and the lattice of the ground state structures were fully relaxed at 0 K with VASP package,26,27 using projector-augmented wave (PAW) potentials.28 The exchange-correlation functional proposed by Perdew–Burke–Ernzerhof (PBE)29 was combined with Grimme D3 van der Waals corrections30 to obtain the energies. D3 corrections are critical for a good description of slab interactions and lattice parameters (Table 1). Core and valence electrons were selected following standards proposed by Calderon et al.31 Plane waves with a cut-off of 500 eV were used for valence electrons and the primitive cells were optimized with a 5 × 5 × 3 k-point mesh. Wavefunction was considered as converged when the energy difference between two electronic steps was smaller than 10−9 eV. Geometry and lattice vectors were fully relaxed, using an 8 atoms conventional cell, until forces over all atoms were smaller than 10−7 eV Å−1. An additional support grid for the evaluation of the augmentation charges was included to reduce the noise in the forces.| Material | a (Å) | c (Å) | κ l (W K−1 m−1) | κ xx l (W K−1 m−1) | κ zz l (W K−1 m−1) |
|---|---|---|---|---|---|
| BiOCuSe | 3.91 | 8.97 | 1.26 | 1.66 | 0.47 |
| (3.92)32 | (8.91)32 | (1.03)14 | |||
| BiOCuS | 3.85 | 8.59 | 1.83 | 2.20 | 1.08 |
| (3.87)32 | (8.56)32 | ||||
| LaOCuS | 3.94 | 8.45 | 4.41 | 5.40 | 1.64 |
| (4.00)33 | (8.51)33 | ||||
| AcOCuS | 4.045 | 8.64 | 1.70 | 2.44 | 0.24 |
| LaOAgS | 4.03 | 9.04 | 2.45 | 3.28 | 0.80 |
| (4.05)34 | (9.04)34 | ||||
| LaOLiS | 3.98 | 8.70 | 7.83 | 9.76 | 3.97 |
| BiOAgSe | 3.99 | 9.54 | 0.87 | 1.09 | 0.43 |
| (3.99)35 | (9.46)35 |
2.2 Supercell single-point calculations and force constants
Interatomic force constants, IFCs, were calculated using the HiPhive package, which combines the forces calculated for random atomic distortion in supercells with machine learning regression.8 The forces were calculated in 5 × 5 × 3 supercell (600 atoms) using the same setup as the one used for the geometry optimizations. The amplitude of the distortions applied to the atoms plays an important role in the calculation of the IFCS so a 2 steps approach was designed.36 First, small random distortions were generated for all the atoms of 3 supercells and second and third-order IFCs were calculated using the HiPhive package. Then, eight new distorted supercells were created superimposing normal modes with random phase factors and amplitudes corresponding to 300 K. The recursive feature elimination RFE, algorithm was used to obtain the force constants from the DFT forces. Even though RFE is more expensive than ordinary least-square regression, this algorithm requires fewer number of structures to converge. Additionally, reducing the number of parameters via RFE also simplifies the model, keeping only the most relevant interaction terms. IFCs were calculated including cutoffs for second, third and fourth-order terms. In order to ensure transferability across compounds, cutoffs were determined based on coordination shells. We have used a wrapper code for the hiPhive program that automates the distorted supercell creation, force calculation using VASP, and the construction of the ML IFCs, which is available for public use.36,372.3 BTE solver
The ShengBTE package was used to solve the Boltzmann Transport Equation, BTE, and obtain lattice thermal conductivity.38 BTE is solved through the iterative approach, which predicts more accurate values than the relaxation time approximation. Lattice thermal conductivity is calculated as a 3 × 3 tensor, καβl, so the anisotropy of the system can be analyzed. Oxychalcogenides studied in this work belong to tetragonal space group so only the diagonal values present non-null values with κxx = κyy Average lattice thermal conductivity, κl, will be defined as the average of the diagonal values of the καβl tensor. Total scattering rates, Γtot, were computed including isotopic and three-phonon scattering. Memory demand and the convergence of κl with the number of q-points were balanced using a gaussian smearing of 0.1 eV and a dense mesh of 12 × 12 × 12. Scattering rates heat maps and their projections were obtained combining ShengBTE and Phonopy39 through a high-throughput tool which is available for public use.403 Results
3.1 BiOCuSe
BiOCuSe is a layered oxychalcogenide that belongs to the tetragonal structural prototype ZrCuSiAs. Its 3D structure alternates fluorite-like [Bi2O2]2+ slabs with antifluorite-like [Cu2Se2]2− slabs along the c-axis.12 In order to give a good description of the long range interactions between layers, Grimme D3 van der Waals corrections30 have been included, obtaining very good agreement with both, a and c, experimental lattice parameters for BiOCuSe and the other oxychalcogenides included in this work (Table 1). Dispersion curves extracted from ML-regression are also in good agreement with the results obtained using the finite differences approach, full-DFT, where the IFCs are determined directly from the displacement of one or two specific atoms in the supercell (Fig. 1a).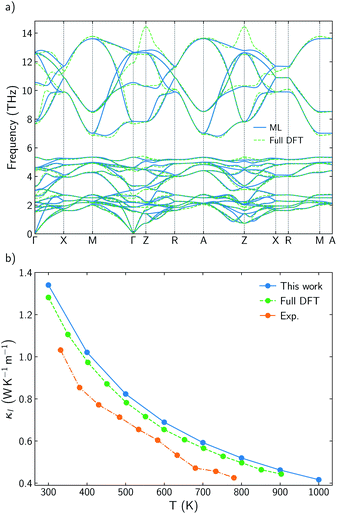 | ||
| Fig. 1 (a) Comparison of BiOCuSe phonon dispersion curves obtained using the machine-learned force constant potential, ML, via HiPhive with those from the full-DFT method via Phonopy. (b) Comparison of experimental κl (orange)14 with calculated results using a full-DFT approach (green),41 and ML-based model (blue) between 300 and 900 K. | ||
Root mean square error, RMSE, of the forces rapidly converges with respect to the number of supercells included in the training (Fig. S1a†). Average lattice thermal conductivity, κl, follows the same trend and it is aligned with previous values calculated using more computationally-demanding approaches.6 Cutoff-interaction distances of 9.75, 6.89, and 3.71 Å for the second-, third-, and fourth-order force constants were found to be sufficient for convergence of the ML-based method. These cutoffs were consistently modified for other materials based on coordination shells. Lattice thermal conductivity was also converged with respect to the q-points grid size (Fig. S1b†). Using a ML-model to extract IFCs and compute κl drastically reduces the computational cost without reducing the accuracy of the predictions. Small differences with previous calculated κl for BiOCuSe are due to the use of different exchange correlation functionals.41 Kumar et al. obtained slightly larger lattice parameters using a PBE + U functional which usually is connected to less rigid bonds and lower κl. Both, ML-model and full-DFT results, slightly overestimate experimental values,14 which can be justified because of the polycrystalinity of the samples (Fig. 1b). While calculated κl values correspond to single-crystal and free-defects solids, experimental measurements were obtained from polycrystalline samples and most likely in the presence of point defects. Both, grain boundaries and point defects act as scattering centers, reducing the life time of the phonons and κl, with respect to single crystal samples.
3.2 Effects of chalcogen substitution
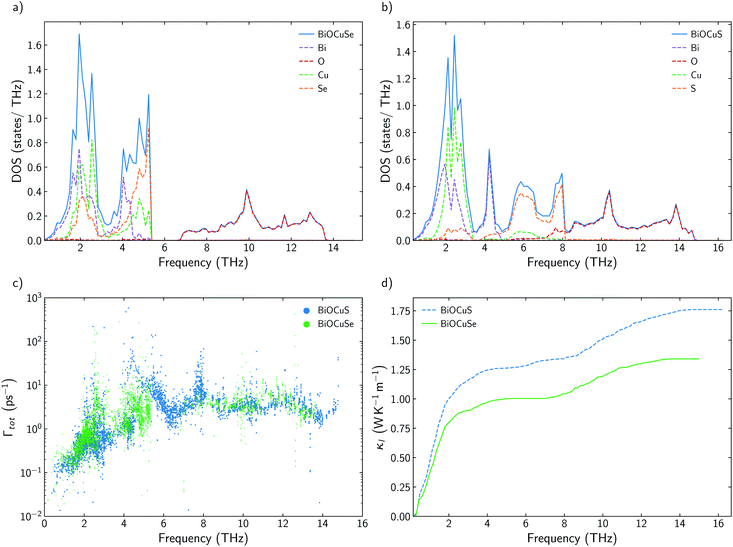
It has already been reported that κl follows a monotonous trend down the chalcogen group for BiOCQ (Q = S, Se, Te).17,42 Both, experimental measurements and calculations have reported that κl at 300 K is reduced around 25% when S is substituted by Se and between 30–40% when Se is substituted by Te.17,42 This is not always the case. For instance, I–III–VI2 chalcopyrite semiconductors follows a nonmonotonous variation of κl, with selenides being the materials with the lowest values.36 Substituting Se by S brings strong modifications in the phonon density of states, DOS (Fig. 2a and b). While vibrational modes of the [Cu2S2]2− slab are strongly localized on Cu at lower frequencies (around 2 THz) or S (around 6–8 THz), [Cu2Se2]2− slab presents more delocalized vibrations between Cu and Se, participating both atoms in vibrational modes at 2 and 4–5 THz. There are not significant differences between the group velocities (Fig. S2†) of BiOCuSe and BiOCuS. Although there is an important shift to lower energies in the vibrational modes in which the chalcogen atoms participate, when S is substituted by Se, the curvature of the dispersion curves is not strongly modified (Fig. S2a†). Thus, group velocities are not significantly changed either, and their differences in κl should be connected to the anharmonicity of the systems. Although they can look similar, there are important differences in the scattering rates of both compounds in the 2–5 THz region of the spectra, where acoustic-optical phonon scattering takes place (Fig. 2c). Increasing the atomic mass of the chalcogen delocalizes and reduces the frequencies of the vibrational modes at which the [Cu2Q2]2− slabs are vibrating. This shift maximized the overlap of these optical vibrational modes with the acoustic modes that are mainly localized at the Bi atoms, increasing their scattering rates and reducing κl. The same behavior can be extracted from the average accumulative κl where there are not big differences in κl between BiOCuSe and BiOCuS up to 2 THz approximately (acoustic region) (Fig. 2d). The lattice thermal conductivity of both compounds changes in the region where acoustic-optic scattering takes places.3.3 Effects of the trivalent cation
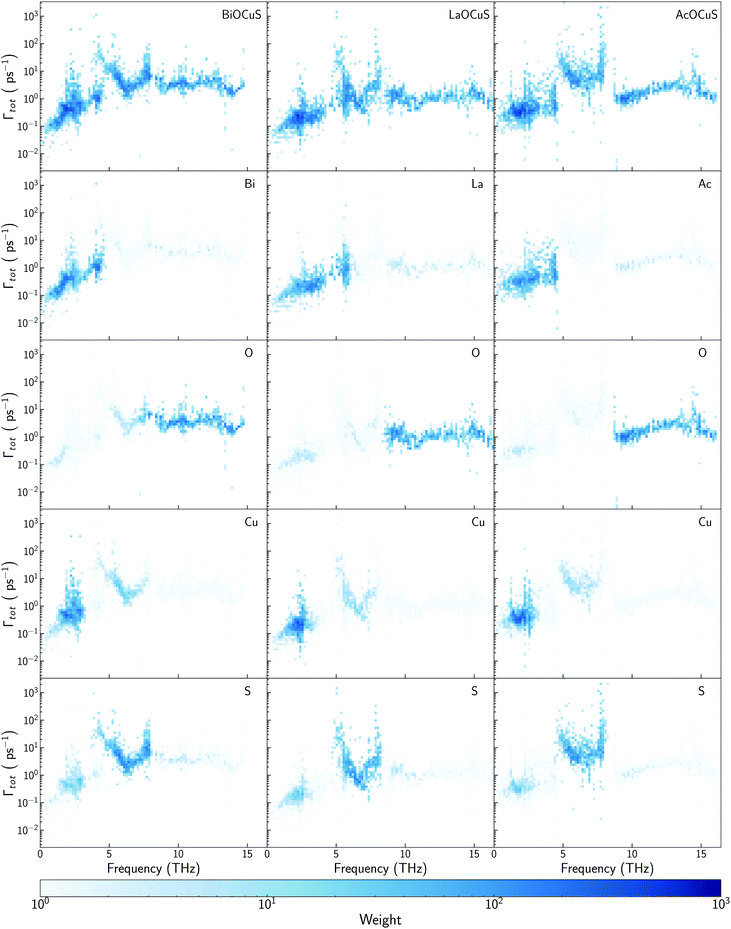
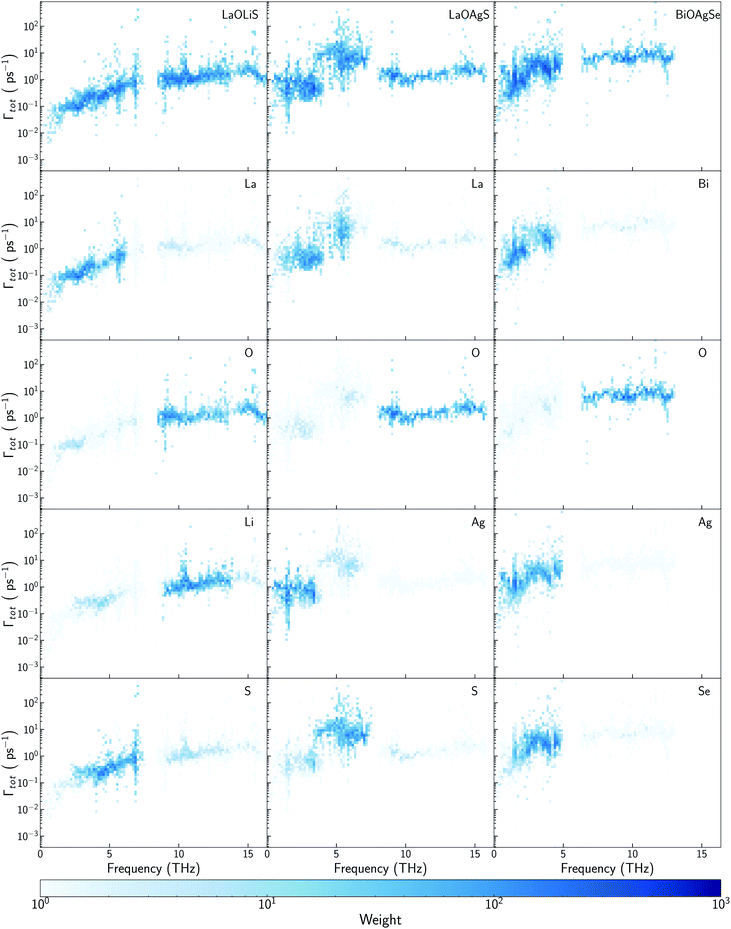
While there is consensus about the role of the chalcogen atom and how its chemical substitution can slightly modify κl for BiOCuQ (Q = S, Se, Te) compounds, the role of the Bi is certainly under debate. Some authors point to the Bi atom's lone pair electron as the main reason for the low thermal conductivity of BiOCuSe,15,43 but there are also studies that suggest that the Cu-Q vibrations are the ones which contribute to reduce κl.25 Partially, these discrepancies come from using only harmonic (phonon dispersion curves) or quasiharmonic (Gruneisen parameters) features to explore a property that is strongly coupled to the anharmonicity of the system. Analyzing the scattering rates is fundamental to understanding the origin of the low lattice thermal conductivity of oxychalcogenides. In order to understand the role of Bi, previous works have compared the vibrational, elastic and electronic properties of the BiOCuQ materials with their La counterparts.23,24 However, that substitution introduces more than one change in the system: (i) the lone pair is removed and (ii) the mass of the trivalent atom is drastically reduced. Here, the lattice thermal conductivity and anharmonicity of BiOCuS, LaOCoS and AcOCuS are compared in order to decouple the role of the mass and lone pair of the trivalent atom. Substituting Bi by Ac, lone pair electron is removed, but the atomic mass is increased, which complements the information that can be extracted from substituting Bi by La. In addition to the phonon DOS and the calculation of the cumulative κl (Fig. 3), scattering rates–frequencies heat maps have been built, including its projection over each element (Fig. 4). These representations not only connect phonon frequencies with a direct measurement of the anharmoncity of the system, but they also unravel the role of each species. Phonon density of states, DOS, of LaOCuS and AcOCuS present similarities with BiOCuSe DOS (Fig. 3a and b). All of them present a region around 2 THz where optics bands are overlapping with acoustic bands, participating Cu and the trivalent cation. However, DOS cannot explain the differences in the in-plane (xx) and perpendicular (zz) cumulative κl. Due to the layered nature of these materials, κzzl which is perpendicular to the slab stacking, is smaller than κxxl (Fig. 3c and d). Cumulative κzzl follows the same trend for all three materials, 100% of κzzl is stored up to 2 THz, approximately. The acoustic-optic scattering region around 2 THz includes atoms from both different layers which can be related to the interlayer off-phase vibrational modes described by Ding.22 Larger κzzl values are obtained for LaOCuS, then BiOCuS and finally AcOCuS which points to the atomic mass as the main responsible of this trend. However, the behavior is more complex for κxxl. Cumulative κxxl presents two main contributions, one in the 0–3 THz range and another one around 8–13 THz (Fig. 3c and d). First large contribution to κxxl follows the same trend than κzzl, ranking their values based on the atomic mass of the trivalent atom. In addition to larger group velocities, heat maps present lower scattering rates in the 0–3 THz range for LaOCuS, which is linked to a lower anharmonicity and larger κl (Fig. 4). Second contribution to κxxl is entirely due to optical phonons and it is slightly smaller than the first one, but still constitutes a 30–45% of the total value. While acoustic phonons with long mean free paths usually control κl, this is one of the few reported examples in which high-frequency optical modes strongly modify κl.44 Even more interestingly, optical modes contributions to κxxl are different for each material. BiOCuS presents the lowest κxxl because the optical mode contribution to κl is proportionally smaller than in LaOCuS and AcOCuS. Due to these high frequency contributions, κxxl is not ranked by the atomic mass of the trivalent atom. This behavior is directly connected to the scattering rates of the vibrational modes at high frequencies (Fig. 4). LaOCuS presents the lower scattering rates for frequencies larger than 7–8 THz, which is consistent with larger contributions to κl. On the other hand, BiOCuS exhibits the highest scattering rates at high frequencies, so their contributions to κl is reduced. Projected scattering rates show how this high-frequency contribution to κl is mainly localized on O atoms vibrations. Thus, the differences in the scattering rates of the high frequency phonons stem from the different nature of the M-O bonds (M = La, Ac, Bi). If BiOCuS is the material with the highest scattering rates at high frequencies, atomic mass cannot be the only variable to consider and its lone pair electron must play a role. It has been proven that the presence of stereochemically active lone pair electrons, LPEs, enhances the anharmonicity of a system and reduce κl.45 This reduction is due to nonlinear repulsive electrostatic force between LPEs and other neighboring bonds, which lowers the lattice symmetry and promote the appearance of more scattering processes.46,47 Following the revised lone pair model,48 it has been experimentally confirmed the presence of a LPE in BiOCuSe.49 Sallis et al. studied the electronic structure of BiOCuSe and LaOCuSe using K-edge X-ray emission spectroscopy, XES, X-ray absorption spectroscopy, XAS and density functional theory. They found that LPE in the BiOCuSe is the result of the formation of a Bi 6s–O 2p bonding state just below the valence band and the stabilization of the Bi 6s–O 2p anti-bonding state due to its hybridization with Bi 6p empty states. This hybridization has also been described through first principles calculations.50,51 Here, it is important to stress the relevance of the concept of LPE as a bonding state, in order to understand their role reducing κl. Although, optical phonons contributions to κxxl are mainly projected on O atoms, the scattering rates of these vibrational modes are larger than in LaOCuS and AcOCuS because of the Bi–O bond nature, which is singularly characterized by the presence of a LPE.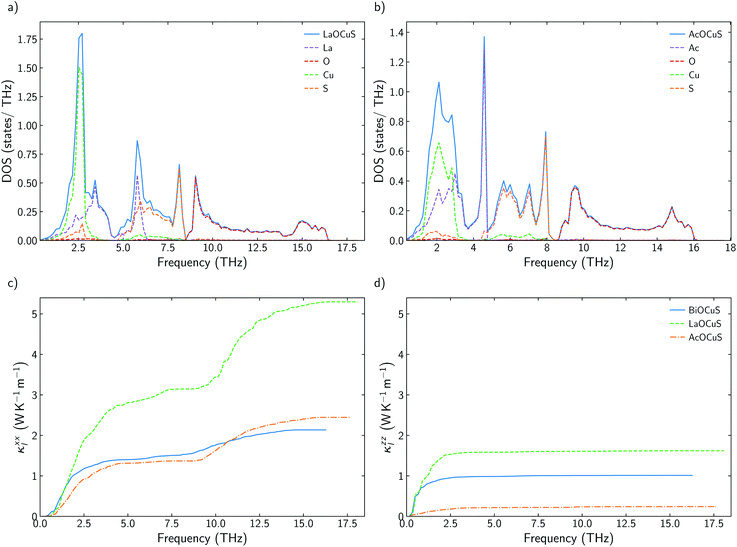 | ||
| Fig. 3 (a and b) Total and projected phonon density of states, DOS, of LaOCuS and AcOCuS. (c and d) Cumulative κxxl and κzzl for BiOCuSe, LaOCuS, and AcOCuS at 300 K. | ||
3.4 The role of Cu
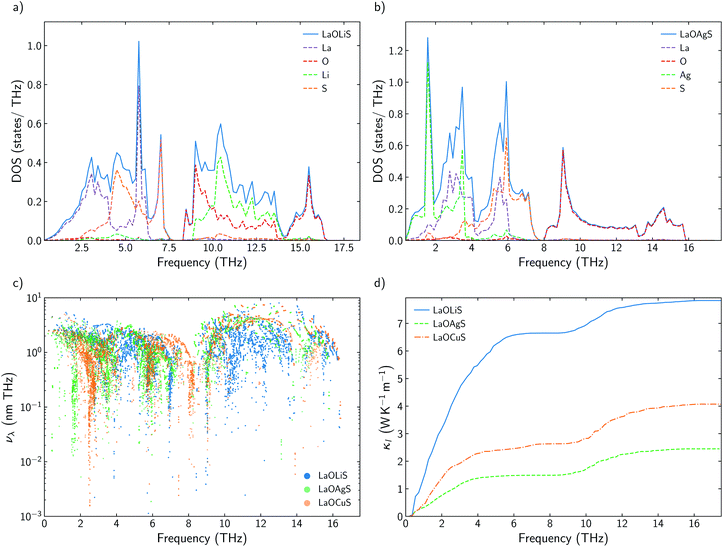
Some previous works have described Cu as the main contributor to the low lattice thermal conductivity of BiOCuQ family.25 Vaqueiro et al. used neutron diffraction experiments and DFT calculations to demonstrate that low-energy vibrational modes on Cu and its weak bonding with the chalcogen are essential to understand their low κl. However, is this a singular interaction between Cu and the chalcogens or is it possible to obtain similar results with other elements? Here, the vibrational properties and κl of LaOMS (M = Cu, Ag, Li) have been explored for a better understanding of the role of the monovalent cation. While the substitution of Bi by Ac or La do not produce large modification in the phonon DOS of the compounds, substituting Cu by Li or Ag lead to severe modifications of the vibrational structure (Fig. 5a and b).Li atoms contributions to the DOS are shifted more than 7 THz, if compared with the projection of Cu atoms in LaOCuS DOS. On the other hand, Ag substitution shift the monovalent contribution to the DOS to even lower frequencies, making it as the main contributor to the acoustic modes. The absence of a heavy monovalent atom such as Cu or Ag also increases the group velocities of the phonons at low frequencies for LaOLiS (Fig. 5c). This behaviour has a clear impact in the cumulative κl of LaOLiS which grows rapidly up to 6 W K−1 m−1 below 4 THz (Fig. 5d). Silver substitution produces the opposite effect on κl because acoustic-optical scattering region is pushed to even lower frequencies when compared to LaOCuS. That trend can be visualized in the scattering rates heat maps where LaOAgS scattering rates at low frequencies are higher than in LaOCuS and LaOLiS. As expected, La and Ag contributions dominates in this region so the anharmoncitiy comes from interlayer scattering (Fig. 6).
3.5 Designing new oxychalcogenides
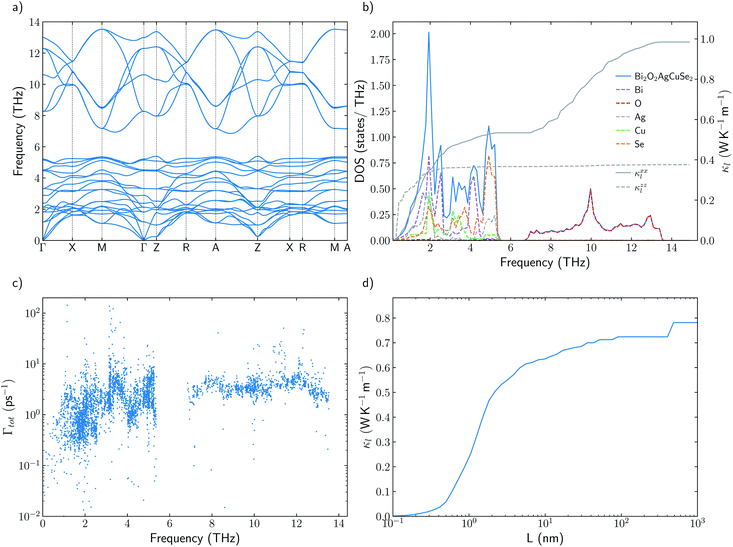
Understanding the mechanisms that governs κl in oxychalcogenides become fundamental for the design of new materials withe potential TE applications. Larger contribution to κl corresponds to scattering processes between acoustic and low frequency optical phonons. This scattering can be maximized with heavy monovalent and trivalent atoms and using Se or Te. In addition, second contribution to κl at higher frequencies can be minimized using trivalent atoms with LPE that increases the scattering rates of high frequency phonons, mainly localized on O atoms. Taking both considerations into account, BiOAgSe is proposed as an oxychalcogenide with potential ultra-low κl. To the best of our knowledge, there are very few recent reports in which BiOAgSe has been synthesized.35,52,53 Some of these works highlight their optoelectronic properties and potential photoconversion applications.35,52 Although BiOAgTe should present also a very low κ,54,55, selenides are usually preferred instead of tellurides because tellurium is a very volatile element which hampers the stability and durability of the material. BiOAgSe has been very recently reported as a promising candidate as TE materials due to its tunable electrical conductivity,56 and, during the preparation of this manuscript, its κl has been reported using the relaxation time approximation, RTA.53,57 However, very little has been described about the origin of its ultra-low κl. Phonon DOS already shows how there are some important differences with respect previous materials (Fig. 7a). BiOAgSe exhibits κl lower than 1.2 W K−1 m−1 at 300 K in both xx and zz directions and an average κl of 0.87 W K−1 m−1 (Fig. 7b and c). These values are slightly larger than the ones predicted by Li et al.57 because the RTA tends to underestimate κl and in very good agreement with recently calculated values obtained by Zhang et al.53 solving the BTE iteratively (Fig. 7b). These low values are due to the effective overlap between acoustic and optical modes mainly projected on the Bi and Ag atoms (Fig. 6 and 7a). Contribution to κl at high frequencies is also very small (around 0.3 W K−1 m−1) (Fig. 7c), and it is minimized with respect to other oxychalcogenides explored in this work due to the high scattering rates of the high frequency phonons (Fig. 6). In addition to the single-crystal lattice thermal conductivity calculated by Li et al. and the analysis of its origen presented in this work, lattice thermal conductivity for polycrystalline BiOAgSe is included (Fig. 7d). The effect of nanostructuring on the thermal conductivity is based on the decomposition of the contributions to κ by the phonon mean free path.58 In this approach, the value of κl corresponding to a particular particle size L is calculated as the cumulative contributions for all mean free paths up to L. Large scattering rates or very short lifetimes produces short mean-free-path so small grains are needed to major reductions of κl. However, some reduction can be achieved if the average grain size is reduced to 100 nm, where the value of κl is below 0.8 W K−1 m−1. These reduction of κl is in agreement with the experimental measurements of polycrystalline samples with an average size of few hundreds of nanometers (0.62 W K−1 m−1 at 300 K).53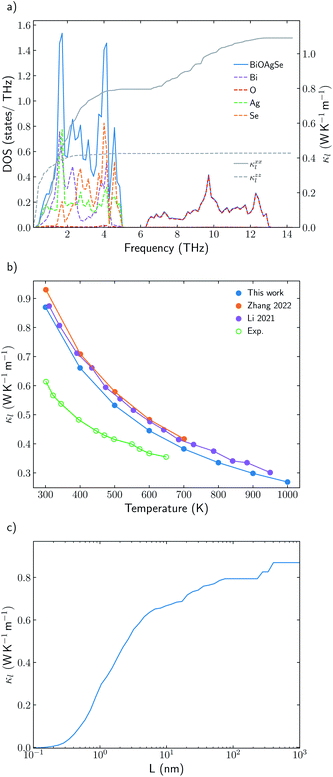 | ||
| Fig. 7 (a) Total and projected phonon density of states, DOS, of BiOAgSe and cumulative κxxl and κzzl at 300 K. (b) Average κl of BiOAgSe between 300 K and 1000 K. Open points are used for experimental data53 and filled points for calculated values. The predicted values of this work (blue) are compared with the results calculated by Li57 (red) and Zhang53 (purple). (d) Cumulative average lattice thermal conductivity at 300 K from mean-free path contributions up to distance L for BiOAgSe, indicating the effect that nanostructuring would have on their κl. | ||
Nanostructuring is not the only approach for reducing the lattice thermal conductivity of solids. Alloying also constitutes a common strategy to reduce κl.59 This strategy has been implemented in BiOAgSe replacing one of the two Ag atoms by a Cu atom in its unit cell. Here, the lattice thermal conductivity of BiOAg0.5Cu0.5Se has been calculated following a similar methodology. Phonon dispersion curves present strong imaginary frequencies which point out that this material is not dynamically stable at 0 K (Fig. S3†). Dynamical stability at finite temperatures has been analyzed using the self-consistent phonon, SCPH, approach implemented in the hiPhive code.8,9 Using this technique, it is possible to include the anharmonicity effects in the dynamical matrix, obtaining temperature dependent frequencies for each vibrational mode. It can be noticed that imaginary frequencies are completely removed between 200 and 300 K (Fig. 8a), demonstrating the dynamic stability of this material at least above 300 K. BiOAg0.5Cu0.5Se presents a κl of 0.78 W K−1 m−1 at 300 K which is a 10% smaller than κl for BiOAgSe (Fig. 8b). This reduction is mainly due to the alloying effect that promotes scattering process in the [AgCuSe2]2− layer. This behavior can be demonstrated analyzing cumulative κl and the scattering rates (Fig. 8b). First, there are very little changes between κzzl for BiOAgSe and BiOAg0.5Cu0.5Se, so the reduction of κl is not due a modification of the interaction between the layers. Moreover, the contribution of high frequency vibrational modes to κxxl, which are localized in the Bi–O bonds, is similar or both materials (Fig. 8b). Main differences between both materials comes from the contribution of optical acoustic modes and low energy optical modes to κxxl. This contribution is drastically reduced in BiOAg0.5Cu0.5Se because of the presence of an additional atom with a different mass, which increases the scattering rates of the vibrational modes between 0 and 5 THz (Fig. 8c). Similarly to BiOAgSe, polycrystalline samples present lower κl, with values around 0.7 W K−1 m−1 at 300 K for an average grains size between 100 and 500 nm. However, a reduction of the thermal conductivity is not the only benefit that is obtained when alloying is applied to thermoelectric materials. The other properties included in ZT, S and σ, can be also tuned by different synthetic variables and strategies such as doping, nanostructuring or alloying. For instance, Xie et al. have found that Cu1−xAgxGaTe2 alloys present an unusual non-parabolic band structure, which is crucial for obtaining a high Seebeck coefficient.60
Moreover, the substitution of Ag by Cu favors the presence of carriers, which is beneficial to obtaining higher power factors.61,62
Although the calculation of ZT is out of the scope of this work, it is possible to anticipate that BiOAg0.5Cu0.5Se is a potential candidate as thermoelectric material.
4 Conclusions
In this work, we have demonstrated how machine learning not only accelerates the prediction of the lattice thermal conductivity for large chemical spaces with high accuracy but also catalyzes the development of design principles to discover new thermoelectric materials. Lattice thermal conductivity of seven oxychalcogenides with very different compositions have been predicted and analyzed. While most previous theoretical work discussed the origin of the low κl of oxychalcogenides based on harmonic properties, we introduce a new approach based on the analysis of phonon DOS, cumulative κl, and most importantly scattering rates heat maps and their atomic projections. Chemical substitution for all sites have been considered in order to unravel the role of each chemical specie. Two main contributions to κl have been described. Low frequency phonons contribution to κl can be minimized with heavy trivalent and monovalent cations. Heavy atoms with similar vibrational frequencies promotes the scattering between acoustic and low-frequency optical modes. We also found that high-frequency optical modes have an important contribution to κxxl. Atomic projections of the scattering rates heat maps show that these modes are mainly localized on the O atoms. Although O atoms are the main contributors to these high-frequency phonons, their scattering rates are sensitive to the trivalent atom that is part of the [M2O2]2+ slab. It has been demonstrated that the atomic mass of the trivalent atom is not the driven force that modifies the scattering rates of these modes. However, it is the element with the LPE, the one that increases the scattering rates and reduces the contribution of these modes to κl. Finally, we have followed these design principles based on chemical composition to propose BiOAgSe and BiOAg0.5Cu0.5Se as two of the best oxychalcogenides for TE applications.Author contributions
The authors confirm contribution to the paper as follows: conceptualization: J. J. P. and A. M. M.; data curation: E. J. B and J. S.; investigation: E. J. B, J. S. and F. L. P.; visualisation: E. J. B.; writing – original draft: J. J. P. R., A. M. M. and J. F. S. All authors reviewed the results and approved the final version of the manuscript.Conflicts of interest
There are no conflicts to declare.Acknowledgements
This work was funded by the Ministerio de Ciencia e Innovación (PID2019-106871GB-I00). E. J. B., J. J. P., J. S., A. M. M., and J. F. S. thankfully acknowledge the computer resources at Lusitania and the technical support provided by Cénits COMPUTAEX and Red Española de Supercomputación, RES (QS-2021-1-0027). The authors thank Fredrik Eriksson, Petter Rosander and Erik Fransson for discussions on hiPhive self-consistent phonons routines.Notes and references
- H.-S. Kim, Z. Gibbs, Y. Tang, H. Wang and G. Snyder, APL Mater., 2015, 3, 041506 CrossRef.
- L. Xi, S. Pan, X. Li, Y. Xu, J. Ni, X. Sun, J. Yang, J. Luo, J. Xi, W. Zhu, X. Li, D. Jiang, R. Dronskowski, X. Shi, G. Snyder and W. Zhang, J. Am. Chem. Soc., 2018, 140, 10785–10793 CrossRef CAS PubMed.
- T. Zhu, Y. Liu, C. Fu, J. Heremans, J. Snyder and X. Zhao, Adv. Mater., 2017, 29, 1605884 CrossRef PubMed.
- P. Gorai, V. Stevanović and E. S. Toberer, Nat. Rev. Mater., 2017, 2, 17053 CrossRef CAS.
- C. Carbogno, R. Ramprasad and M. Scheffler, Phys. Rev. Lett., 2017, 118, 175901 CrossRef PubMed.
- J. J. Plata, P. Nath, D. Usanmaz, J. Carrete, C. Toher, M. de Jong, M. D. Asta, M. Fornari, M. Buongiorno Nardelli and S. Curtarolo, npj Comput. Mater., 2017, 3, 45 CrossRef.
- C. Verdi, F. Karsai, P. Liu, R. Jinnouchi and G. Kresse, npj Comput. Mater., 2021, 7, 156 CrossRef CAS.
- F. Eriksson, E. Fransson and P. Erhart, Adv. Theory Simul., 2019, 2, 1800184 CrossRef.
- E. Fransson, F. Eriksson and P. Erhart, npj Comput. Mater., 2020, 6, 135 CrossRef.
- Y. Iwasaki, I. Takeuchi, V. Stanev, A. Kusne, M. Ishida, A. Kirihara, K. Ihara, R. Sawada, K. Terashima, H. Someya, K.-I. Uchida, E. Saitoh and S. Yorozu, Sci. Rep., 2019, 9, 2751 CrossRef PubMed.
- H. Zhu, C. Xiao and Y. Xie, Adv. Mater., 2018, 30, 1802000 CrossRef PubMed.
- S. Luu and P. Vaqueiro, J. Materiomics, 2016, 2, 131–140 CrossRef.
- Y. Liu, L.-D. Zhao, Y. Liu, J. Lan, W. Xu, F. Li, B.-P. Zhang, D. Berardan, N. Dragoe, Y.-H. Lin, C.-W. Nan, J.-F. Li and H. Zhu, J. Am. Chem. Soc., 2011, 133, 20112–20115 CrossRef CAS PubMed.
- F. Li, J.-F. Li, L.-D. Zhao, K. Xiang, Y. Liu, B.-P. Zhang, Y.-H. Lin, C.-W. Nan and H.-M. Zhu, Energy Environ. Sci., 2012, 5, 7188–7195 RSC.
- Y.-L. Pei, J. He, J.-F. Li, F. Li, Q. Liu, W. Pan, C. Barreteau, D. Berardan, N. Dragoe and L.-D. Zhao, NPG Asia Mater., 2013, 5, e47 CrossRef CAS.
- M.-K. Han, Y.-S. Jin, B. Yu, W. Choi, T.-S. You and S.-J. Kim, J. Mater. Chem. A, 2016, 4, 13859–13865 RSC.
- H. Zhu, T. Su, H. Li, C. Pu, D. Zhou, P. Zhu and X. Wang, J. Eur. Ceram. Soc., 2017, 37, 1541–1546 CrossRef CAS.
- T.-L. Chou, G. Tewari, D. Srivastava, A. Yamamoto, T.-S. Chan, Y.-Y. Hsu, J.-M. Chen, H. Yamauchi and M. Karppinen, Mater. Chem. Phys., 2016, 177, 73–78 CrossRef CAS.
- C. Barreteau, D. Bérardan, L. Zhao and N. Dragoe, J. Mater. Chem. A, 2013, 1, 2921–2926 RSC.
- G. Li, S. Hao, S. Morozov, P. Zhai, Q. Zhang, W. Goddard and G. Snyder, ACS Appl. Mater. Interfaces, 2018, 10, 6772–6777 CrossRef CAS PubMed.
- M. Toriyama, J. Qu, G. Snyder and P. Gorai, J. Mater. Chem. A, 2021, 9, 20685–20694 RSC.
- J. Ding, B. Xu, Y. Lin, C. Nan and W. Liu, New J. Phys., 2015, 17, 083012 CrossRef.
- S. Saha, Phys. Rev. B: Condens. Matter Mater. Phys., 2015, 92, 041202 CrossRef.
- S. Saha and G. Dutta, Phys. Rev. B, 2016, 94, 125209 CrossRef.
- P. Vaqueiro, R. Al Orabi, S. Luu, G. Guélou, A. Powell, R. Smith, J.-P. Song, D. Wee and M. Fornari, Phys. Chem. Chem. Phys., 2015, 17, 31735–31740 RSC.
- G. Kresse and J. Hafner, Phys. Rev. B: Condens. Matter Mater. Phys., 1993, 47, 558–561 CrossRef CAS PubMed.
- G. Kresse and J. Furthmüller, Phys. Rev. B: Condens. Matter Mater. Phys., 1996, 54, 11169–11186 CrossRef CAS PubMed.
- P. E. Blöchl, Phys. Rev. B: Condens. Matter Mater. Phys., 1994, 50, 17953–17979 CrossRef PubMed.
- J. P. Perdew, K. Burke and M. Ernzerhof, Phys. Rev. Lett., 1996, 77, 3865–3868 CrossRef CAS PubMed.
- S. Grimme, J. Antony, S. Ehrlich and H. Krieg, J. Chem. Phys., 2010, 132, 154104 CrossRef PubMed.
- C. E. Calderon, J. J. Plata, C. Toher, C. Oses, O. Levy, M. Fornari, A. Natan, M. J. Mehl, G. L. W. Hart, M. Buongiorno Nardelli and S. Curtarolo, Comput. Mater. Sci., 2015, 108, 233–238 CrossRef CAS.
- A. Kusainova, P. Berdonosov, L. Akselrud, L. Kholodkovskaya, V. Dolgikh and B. Popovkin, J. Solid State Chem., 1994, 112, 189–191 CrossRef CAS.
- Y. Takano, C. Ogawa, Y. Miyahara, H. Ozaki and K. Sekizawa, J. Alloys Compd., 1997, 249, 221–223 CrossRef CAS.
- M. Palazzi, C. C. P. Laruelle and J. Flahaut, The Rare Earths in Modern Science and Technology, Boston, MA, 1982, pp. 347–350 Search PubMed.
- J. Gamon, D. Giaume, G. Wallez, J.-B. Labégorre, O. Lebedev, R. Al Rahal Al Orabi, S. Haller, T. Le Mercier, E. Guilmeau, A. Maignan and P. Barboux, Chem. Mater., 2018, 30, 549–558 CrossRef CAS.
- J. J. Plata, V. Posligua, A. M. Márquez, J. F. Sanz and R. Grau-Crespo, Chem. Mater., 2022, 34, 2833–2841 CrossRef CAS.
- J. J. Plata, V. Posligua, A. M. Márquez, J. Fdez Sanz and R. Grau-Crespo, hiPhive Wrapper, 2021, https://github.com/NewMaterialsLab/hiPhive_wrapper_NML Search PubMed.
- W. Li, J. Carrete, N. A. Katcho and N. Mingo, Comput. Phys. Commun., 2014, 185, 1747–1758 CrossRef CAS.
- A. Togo and I. Tanaka, Scr. Mater., 2015, 108, 1–5 CrossRef CAS.
- E. J. Blancas, J. J. Plata, A. M. Márquez and J. Fdez Sanz, Scattering Rates Heat Map Plotter, 2022, https://github.com/ErnstBlancas/PRmaps Search PubMed.
- S. Kumar and U. Schwingenschlögl, Phys. Chem. Chem. Phys., 2016, 18, 19158–19164 RSC.
- H. S. Ji, A. Togo, M. Kaviany, I. Tanaka and J. H. Shim, Phys. Rev. B, 2016, 94, 115203 CrossRef.
- M. Nielsen, V. Ozolins and J. Heremans, Energy Environ. Sci., 2013, 6, 570–578 RSC.
- Z. Li, H. Xie, S. Hao, Y. Xia, X. Su, M. G. Kanatzidis, C. Wolverton and X. Tang, Phys. Rev. B, 2021, 104, 245209 CrossRef CAS.
- C. Chang and L.-D. Zhao, Mater. Today Phys., 2018, 4, 50–57 CrossRef.
- D. Morelli, V. Jovovic and J. Heremans, Phys. Rev. Lett., 2008, 101, 035901 CrossRef CAS PubMed.
- E. Skoug and D. Morelli, Phys. Rev. Lett., 2011, 107, 235901 CrossRef PubMed.
- A. Walsh, D. Payne, R. Egdell and G. Watson, Chem. Soc. Rev., 2011, 40, 4455–4463 RSC.
- S. Sallis, L. Piper, J. Francis, J. Tate, H. Hiramatsu, T. Kamiya and H. Hosono, Phys. Rev. B: Condens. Matter Mater. Phys., 2012, 85, 085207 CrossRef.
- E. Stampler, W. Sheets, M. Bertoni, W. Prellier, T. Mason and K. Poeppelmeier, Inorg. Chem., 2008, 47, 10009–10016 CrossRef CAS PubMed.
- H. Hiramatsu, H. Yanagi, T. Kamiya, K. Ueda, M. Hirano and H. Hosono, Chem. Mater., 2008, 20, 326–334 CrossRef CAS.
- A. Baqais, A. Curutchet, A. Ziani, H. Ait Ahsaine, P. Sautet, K. Takanabe and T. Le Bahers, Chem. Mater., 2017, 29, 8679–8689 CrossRef CAS.
- C. Zhang, J. He, R. McClain, H. Xie, S. Cai, L. Walters, J. Shen, F. Ding, X. Zhou, C. Malliakas, J. Rondinelli, M. Kanatzidis, C. Wolverton, V. Dravid and K. Poeppelmeier, J. Am. Chem. Soc., 2022, 144, 2569–2579 CrossRef CAS PubMed.
- M. Mukherjee and A. Singh, ACS Appl. Mater. Interfaces, 2020, 12, 8280–8287 CrossRef CAS PubMed.
- J. He, Z. Yao, V. Hegde, S. Naghavi, J. Shen, K. Bushick and C. Wolverton, Chem. Mater., 2020, 32, 8229–8242 CrossRef CAS.
- J. Li, C. Zhang, Y. Yan, J. Yang, B. Shi, Y. Wang and Z. Cheng, Comp. Mater. Sci., 2020, 171, 109273 CrossRef.
- J. Li, W. Zhai, C. Zhang, Y. Yan, P.-F. Liu and G. Yang, Mater. Adv., 2021, 2, 4876–4882 RSC.
- C. Dames and G. Chen, Thermoelectrics Handbook: Macro to Nano, Boca Raton, FL, 2006, p. 421 Search PubMed.
- H. Xie, H. Wang, Y. Pei, C. Fu, X. Liu, G. Snyder, X. Zhao and T. Zhu, Adv. Funct. Mater., 2013, 23, 5123–5130 CrossRef CAS.
- H. Xie, Y. Liu, Y. Zhang, S. Hao, Z. Li, M. Cheng, S. Cai, G. Snyder, C. Wolverton, C. Uher, V. Dravid and M. Kanatzidis, J. Am. Chem. Soc., 2022, 144, 9113–9125 CrossRef CAS PubMed.
- C. Wang, Q. Ma, H. Xue, Q. Wang, P. Luo, J. Yang, W. Zhang and J. Luo, ACS Appl. Energy Mater., 2020, 3, 11015–11023 CrossRef CAS.
- Y. Cao, X. Su, F. Meng, T. Bailey, J. Zhao, H. Xie, J. He, C. Uher and X. Tang, Adv. Funct. Mater., 2020, 30, 2005861 CrossRef CAS.
Footnote |
| † Electronic supplementary information (ESI) available. See https://doi.org/10.1039/d2ta02180c |
| This journal is © The Royal Society of Chemistry 2022 |

