A molybdenum sulfo-oxide/cobalt oxysulfide Z-scheme heterojunction catalyst for efficient photocatalytic hydrogen production and pollutant reduction†
Qinhan
Wu
a,
Adugna Boke
Abdeta
a,
Dong-Hau
Kuo
 *b,
Hanya
Zhang
a,
Qingxin
Lu
a,
Jubin
Zhang
*a,
Osman Ahmed
Zelekew
 c,
Mengistu Tadesse
Mosisa
a,
Jinguo
Lin
*a and
Xiaoyun
Chen
 *a
*a
aCollege of Materials Engineering, Fujian Agriculture and Forestry University, Fuzhou 350002, China. E-mail: zhangjubinfzu@163.com; fjlinjg@126.com; fjchenxy@126.com
bDepartment of Materials Science and Engineering, National Taiwan University of Science and Technology, Taipei 10607, Taiwan. E-mail: dhkuo@mail.ntust.edu.tw
cDepartment of Materials Science and Engineering, Adama Science and Technology University, Adama, Ethiopia
First published on 28th January 2022
Abstract
The existence of a heterojunction in the catalyst structure improves the efficiency of photocatalytic hydrogen production. The two phases of the heterojunction can be adjusted simultaneously by doping sulfur and oxygen to achieve a suitable energy band structure. Herein, we demonstrated a Mo(S,O)/Co(O,S) Z-scheme heterojunction catalyst system (abbreviated as MoCoOS) with different Co(O,S) doping amounts by a simple one-step method. Doping of different atoms in the crystal changes the energy band structure which tunes the optical, electrical, and electrochemical properties of MoCoOS. MoCoOS-2 prepared at a Co precursor content of 20 mmol performed the best at a rate of 153.4 μmol h−1 in photocatalytic hydrogen evolution, and it also showed excellent catalytic activities and good stability in reducing MO, MB, RhB, 4-NP and Cr6+. This efficient MoCoOS-2 catalyst can have practical applications in photocatalytic hydrogen production and catalytic reduction of chemical pollutants.
1. Introduction
For decades, the consumption of conventional sources of energy like fossil energy in industrial production and human life has been increasing while their reserves are decreasing, and the problems of energy depletion and environmental pollution are becoming more and more obvious. Carbon dioxide emissions from the combustion of oil and coal have aggravated global warming to a certain extent, and the emission of sulfur dioxide causes acid rain and other problems. Floating fine particles have polluted the air and cause respiratory diseases. In the process of fossil energy exploitation, the damage to the local geological environment and surface environment is deep and difficult to recover. These problems have forced people to have a strong demand for the development of new energy. Since the new century, researchers' exploration of new energy has entered a new stage. Clean, environment-friendly and efficient energy is the focus of researchers. Solar energy, hydropower, geothermal energy, wind energy, biomass energy and hydrogen energy, as new industries, have become supplementary means of energy supply sources and important measures of environmental protection and governance. Among them, hydrogen, as the most common element in nature, mainly exists as water. Hydrogen is one of the best energy carriers because of its high energy density. The calorific value of hydrogen is 142![[thin space (1/6-em)]](https://www.rsc.org/images/entities/char_2009.gif) 351 kJ kg−1, which is three times that of gasoline. Thus, it has very high conversion efficiency for both heat energy and electric energy. Hydrogen can also meet the needs of storage and application environments in the form of gas, liquid and solid hydrides. Therefore, as an excellent clean and renewable energy, hydrogen has become one of the most widely used energy sources. Methods such as steam reforming, thermo catalytic cracking, electro catalysis, and photocatalysis were developed to produce hydrogen.1–4 But, photocatalysis has attracted much attention because of its simple hydrogen production process and low cost. Different catalytic materials such as metal sulfur oxides,5,6 solid solutions of sulfur oxides7 and phosphides,8 semiconductor polymers,9 g-C3N4,10 graphene,11 and the like were commonly used for photo catalytic hydrogen production. However, the two metals in metallic sulfur oxide catalysts often have unique synergistic effects, such as doping of the crystal lattice or the formation of a porous and large specific surface area leads to high efficiency for photo-catalytic hydrogen production. Poornaprakash et al.12 synthesized CdS, CdS
351 kJ kg−1, which is three times that of gasoline. Thus, it has very high conversion efficiency for both heat energy and electric energy. Hydrogen can also meet the needs of storage and application environments in the form of gas, liquid and solid hydrides. Therefore, as an excellent clean and renewable energy, hydrogen has become one of the most widely used energy sources. Methods such as steam reforming, thermo catalytic cracking, electro catalysis, and photocatalysis were developed to produce hydrogen.1–4 But, photocatalysis has attracted much attention because of its simple hydrogen production process and low cost. Different catalytic materials such as metal sulfur oxides,5,6 solid solutions of sulfur oxides7 and phosphides,8 semiconductor polymers,9 g-C3N4,10 graphene,11 and the like were commonly used for photo catalytic hydrogen production. However, the two metals in metallic sulfur oxide catalysts often have unique synergistic effects, such as doping of the crystal lattice or the formation of a porous and large specific surface area leads to high efficiency for photo-catalytic hydrogen production. Poornaprakash et al.12 synthesized CdS, CdS![[thin space (1/6-em)]](https://www.rsc.org/images/entities/char_2009.gif) :
:![[thin space (1/6-em)]](https://www.rsc.org/images/entities/char_2009.gif) Er (2 at%), and CdS
Er (2 at%), and CdS![[thin space (1/6-em)]](https://www.rsc.org/images/entities/char_2009.gif) :
:![[thin space (1/6-em)]](https://www.rsc.org/images/entities/char_2009.gif) Er (4 at%) catalysts through a simple reflux route, and found that CDs
Er (4 at%) catalysts through a simple reflux route, and found that CDs![[thin space (1/6-em)]](https://www.rsc.org/images/entities/char_2009.gif) :
:![[thin space (1/6-em)]](https://www.rsc.org/images/entities/char_2009.gif) Er (2 at%) has excellent photocatalytic hydrogen production performance. Niu et al.13 synthesized and studied catalysts loaded with ZnS, Bi2S3 and CoS by a hydrothermal method, and found that CoS has excellent photocatalytic performance. Ghiat synthesized a high activity and durability SiO2@NiCuPS photocatalyst by a hydrothermal method, which was a highly stable phyllosilicate material with a core@shell structure and high catalytic activity and stability.14 Chen et al.15 prepared a low-cost and high-efficiency catalyst for hydrogen production by photocatalytic decomposition of water with CuO/TiO2.
Er (2 at%) has excellent photocatalytic hydrogen production performance. Niu et al.13 synthesized and studied catalysts loaded with ZnS, Bi2S3 and CoS by a hydrothermal method, and found that CoS has excellent photocatalytic performance. Ghiat synthesized a high activity and durability SiO2@NiCuPS photocatalyst by a hydrothermal method, which was a highly stable phyllosilicate material with a core@shell structure and high catalytic activity and stability.14 Chen et al.15 prepared a low-cost and high-efficiency catalyst for hydrogen production by photocatalytic decomposition of water with CuO/TiO2.
The existence of a heterojunction in the heterogeneous catalyst structure greatly improves the efficiency of catalytic hydrogen production. Electrons are excited from the valence band to jump into the conduction band under the illumination of radiation with the appropriate wavelength, in which different types of heterojunction structures play different roles and have different characteristics.16–19 Z-scheme heterojunctions are widely investigated for their enhanced photocatalytic properties. By combining two semiconductors with suitable energy band structures, reducing holes and electron–hole recombination by transferring electrons of another semiconductor to a hydrogen-producing semiconductor, the hydrogen-producing ability is improved. This kind of heterojunction often forms between two phases that load sulfide or oxide of metal on CdS. Molybdenum is one kind of metal with rich mineral resources and low cost, and its sulfur oxides are often used in the study of heterojunction photocatalytic decomposition of water.20–23 The research of molybdenum-based metallic doping catalysts is one of the focuses of the hydrogen energy research field. The ultra-small MoO3/amine-CdS catalyst was obtained by electrostatic-assisted ultrasonic exfoliation of its bulk counterpart with the help of dissolved amine-based polymers in Wang's work.24 Sharma et al.25 fabricated multifunctional composite photocatalysts by coupling sea urchin shaped ZnO with MoS2 and polyaniline sheets and a significant improvement of photocatalysis was obtained. Han et al.26 synthesized CdS@MoS2 with high photocatalytic performance. Goud et al.27 prepared an oxygen-vacancy rich, Bi2O3 based MoS2/Bi2O3 Z-scheme heterojunction catalyst by an autoclave hydrothermal method using ethanol and water.
Likewise, the fast growth of industrialization has brought about environmental pollution which has currently become more serious. Factories such as leather factories, pharmaceutical factories, petroleum processing factories and metal smelting factories discharge various environmental pollutants into water bodies, causing damage to the water environment and having an adverse impact on human beings and animals. Organic dyes and nitro-aromatic compounds have high stability, low biodegradability, and hydrophilic nature that lead to their persistence in environmental compartments for a long time, cause the change of color and affect the normal function of water, affect human perception, hinder the photosynthesis of aquatic plants, and also lead to the destruction of the aquatic ecosystem. Pollution caused by nitroaromatic compounds is the most typical and extremely harmful organic pollution, not only because of their toxicity and mutagenicity, but also because of their chemical stability and wide use in various industries such as polymers, drugs, dyes, rubber chemicals, pesticides, etc.28–32 Some heavy metal ions have extremely high toxicity, such as typical metal mercury, cadmium, lead, chromium and so on. Among them, the hexavalent chromium ion is extremely toxic to swallow/inhale, is easily absorbed by the human body, and enters the human body through the digestive tract, respiratory tract, skin and mucous membrane, causing damage to stomach, kidney and liver function, damaging eyes, causing retinal hemorrhage and optic atrophy, and causing cancer risk after long-term contact.33–37
Researchers have developed various methods like membrane flocculation, catalytic degradation, desorption and filtration to degrade or reduce pollutants in water.38–41 But, detoxifying or removing toxic chemical pollutants in water by using bimetallic catalysts is an efficient and comparatively cheap method. Kebede et al.42 prepared a Sb-doped Mo(S,O)3−x catalyst at 95 °C in a facile way, which showed high reduction efficiency towards MB. Ecer prepared a magnetic pumice (Fe3O4@PMC) composite catalyst with high reduction efficiency towards MO by a chemical co-precipitation method.43 Li et al.44 prepared MoS2@TiO2@poly(methyl methacrylate) by freeze drying hydrothermally treated electrospun PMMA nanofibers containing titanium n-butoxide and MoS2 nanosheets and degraded MO (10 mg L−1, 100 mL) completely in 40 min under UV light irradiation. Li et al.45 reported a general approach for the synthesis of ultrafine NiMoOx NPs confined in mesoporous carbon with different morphologies and compositions using the replication method with SBA-15 as a hard template and studied their reduction efficiency towards 4-NP. Our research group synthesized Cu-based oxysulfide catalysts (CuBiOS, CuVOS, CuSbOS, etc.) via a feasible method, and they exhibited excellent catalytic reduction activity towards MB, MO, RhB, 4-NP and Cr(VI).46–51 For those bimetal oxysulfide compounds, they are mainly single phase compounds in the form of a solid solution of (M1, M2)(O,S) or together with a second non-oxysulfide to form the composite.52–54 Composites of sulfur-doped oxide (oxysulfide)/oxygen-doped sulfide (sulfo-oxide) with a heterogeneous interface are a novel topic in terms of physical properties and the way of synthesis.
Because each semiconductor has its advantages and disadvantages when used as a hydrogen-producing catalyst, the energy band arrangement is particularly important. In order to improve the preparation of heterojunction photocatalysts, it is of great significance to design a heterojunction photocatalyst which can adjust the heterojunction two-phase energy band structure. On the basis of research by the same research group,55,56 MoCoOS, a Z-scheme heterojunction catalyst prepared by simple hydrolysis of molybdenum and cobalt, has better hydrogen production capacity and excellent pollutant reduction capacity compared with other catalysts.
In this study we designed an oxysulfide heterojunction catalyst that can adjust the heterojunction dual-phase energy band structure. This MoCoOS catalyst is a Z-scheme catalyst in a composite form with sulfur-doped Mo4O11 and oxygen-doped Co9S8. The hydrogen production capacity and the reduction capacities of MO, MB, RhB, 4-NP, and Cr(VI) were studied. Meanwhile, the possible mechanisms of oxysulfide heterojunction catalysts with excellent activity were demonstrated.
2. Experiments
2.1. Preparation of Mo(S,O)/Co(O,S) catalysts
The synthesis of Mo(S,O)/Co(O,S) catalysts is as follows: 20 mmol ammonium molybdate tetrahydrate ((NH4)6Mo7O24·4H2O, A.R., Tianjin Fuchen Chemical Reagents Factory) was dissolved in 800 mL of deionized water. After stirring for 20 min, 20 mmol cobalt chloride hexahydrate (CoCl2·6H2O, A.R., Aladdin Industrial Corporation) was added into the mixture solution and continuously stirred for 20 min. Then, 20 mmol thioacetamide (CH3CSNH2, A.R., Aladdin Industrial Corporation) was added into the mixture solution. After stirring for 30 min, the mixture solution was heated at 95 °C and kept for 2 h. Finally, the obtained solid was washed with deionized water and ethanol and dried, and it was labeled MoCoOS-3. In the same manner 5, 10, and 30 mmol CoCl2·6H2O were used to synthesize MoCoOS-1, MoCoOS-2 and MoCoOS-4 catalysts, respectively. For comparison, samples without adding (NH4)6Mo7O24·4H2O and CoCl2·6H2O were also prepared and labeled Co(O,S) and Mo(S,O), respectively.2.2. Characterization of Mo(S,O)/Co(O,S) catalysts
Photoelectron spectroscopy (XPS) was conducted with a VG Scientific ESCALAB 250 XPS under Al Kα X-rays radiation, and carbon C 1s (Ea = 284.6 eV) was used for calibration. The X-ray diffraction spectrum was obtained using a Rigaku X-ray diffractometer with a Cu Kα radiation (λ = 1.5406°) source. Field emission scanning electron microscopy (HITACHI SU-8010 microscope) and transmission electron microscopy (TECNAI G2 F20) were used to obtain morphologies. Ultraviolet-visible absorption spectra were obtained on a TU1901 spectrophotometer. The infrared spectrum was obtained by the KBr tableting method on a Fourier infrared spectrometer (Bruker VERTEX 70). An ASAP 2020 porosity and specific surface area analyzer was used to carry out N2 adsorption–desorption experiments. UPS and VB-XPS data were obtained by Ultraviolet Photoelectron Spectroscopy (RESOLVE120MCD5). A fluorescence spectrophotometer (F-380) was used to compare the photoluminescence effect of the catalyst. A Bruker A300 spectrometer was used to collect EPR signals from DMPO. The electron transfer pathway in the heterostructure was studied using an electronic paramagnetic spectrometer (Bruker A300). Solar power was measured using a full spectrum optical power meter (CEL-NP2000).2.3. Electrochemical measurements
Electrochemical impedance spectra (EIS), transient photocurrent, cyclic voltammetry curves (CV), Mott–Schottky curves (MS) and linear sweep voltammetry (LSV) curves were obtained on an electrochemical workstation (Squid Stat Plus). An Ag/AgCl electrode, platinum sheet electrode and glassy carbon electrode were used as the reference electrode, counter electrode and working electrode to construct a three-electrode system. MoCoOS catalyst, acetylene black and polytetrafluoroethylene were mixed in a mass ratio of 8![[thin space (1/6-em)]](https://www.rsc.org/images/entities/char_2009.gif) :
:![[thin space (1/6-em)]](https://www.rsc.org/images/entities/char_2009.gif) 1
1![[thin space (1/6-em)]](https://www.rsc.org/images/entities/char_2009.gif) :
:![[thin space (1/6-em)]](https://www.rsc.org/images/entities/char_2009.gif) 1 and a small amount of absolute ethyl alcohol was added, followed by grinding for 5 min to mix them fully. Then they were uniformly loaded onto a titanium mesh to obtain a sample with an area of 1.0 cm2, which was kept in a drying oven at 85 °C for 4 h to be fully dried. Then, the prepared sample was connected with the working electrode and the measurement was carried out in 1.0 mol L−1 KCl electrolyte at pH = 6.8. The frequency range of AC impedance measurements was set at 0.001 kHz to 1000 kHz with a potential amplitude of 10 mV. The Mott–Schottky test was carried out in the frequency range of 0.001 kHz to 200 kHz. In the photocurrent response experiment, chronoamperometry was used to measure the photocurrent under the condition of stable current, and a 150 W xenon lamp was used as the light source.
1 and a small amount of absolute ethyl alcohol was added, followed by grinding for 5 min to mix them fully. Then they were uniformly loaded onto a titanium mesh to obtain a sample with an area of 1.0 cm2, which was kept in a drying oven at 85 °C for 4 h to be fully dried. Then, the prepared sample was connected with the working electrode and the measurement was carried out in 1.0 mol L−1 KCl electrolyte at pH = 6.8. The frequency range of AC impedance measurements was set at 0.001 kHz to 1000 kHz with a potential amplitude of 10 mV. The Mott–Schottky test was carried out in the frequency range of 0.001 kHz to 200 kHz. In the photocurrent response experiment, chronoamperometry was used to measure the photocurrent under the condition of stable current, and a 150 W xenon lamp was used as the light source.
2.4. Catalyst activity test
3. Results and discussion
3.1. Structure analysis
The surface chemistry and chemical state of each atom in the MoCoOS-2 catalyst and their atomic fraction were studied and analyzed by XPS. Fig. 1 shows the XPS fittings of Mo 3d, Co 2p, O 1s, and S 2p spectra of the MoCoOS-2 catalyst. Fig. 1a shows the survey XPS spectrum of MoCoOS-2. The Mo, Co, O, S, and C elements were observed in the spectrum with a trace amount of C 1s from foreign carbon. Fig. 1b shows the Mo 3d XPS spectra of MoCoOS-2 and the peaks located at binding energies of 232.2 eV and 235.3 eV correspond to the Mo 3d5/2 and Mo 3d3/2 of Mo(VI), respectively, with a spin–orbit splitting of 3.1 eV.57,58 Similarly, the peaks located at 231.1 eV and 234.2 eV are assigned to Mo 3d5/2 and Mo 3d3/2 of Mo(IV), which indicates that Mo exists in the form of Mo(VI) and Mo(IV) in the catalyst.59,60 For Co 2p of MoCoOS-2 shown in Fig. 1c, the peaks positioned at 780.1 eV and 796.0 eV belong to Co 2p3/2 and Co 2p1/2 of Co(II), respectively, whereas the peaks at 785.8 eV and 802.4 eV are attributed to Co 2p3/2 and Co 2p1/2 satellite peaks.61Fig. 1d shows the O 1s XPS spectra of MoCoOS-2 and the asymmetric shape of the O 1s peak indicates the existence of different chemical states of oxygen in the catalyst. The peaks located at 530.3 eV, 531.3 eV, and 532.2 eV are attributed to lattice oxygen, vacancy oxygen, and hydroxyl oxygen, respectively.52,62–64 According to the fitting peak area, the ratios of lattice oxygen, oxygen vacancies, and hydroxyl oxygen were calculated and the results are given in Table S1.† As observed from Fig. 1e, the S 2p peaks at binding energies of 162.4 eV and 163.5 eV correspond to S 2p1/2 and S 2p3/2 of S2− states,65–67 respectively, without other sulfur forms. The proportion of each element in the MoCoOS-2 catalyst is calculated from their peak area and listed in Table S1.† As shown in Table S1,† the MoCoOS-2 catalyst has the highest proportion of oxygen vacancies, which may be related to the activity of the catalyst.68–71 For comparison, the XPS spectra of Mo(S,O) and Co(O,S) are displayed in Fig. S1 and S2,† respectively. All the XPS results after peak deconvolution for composition analysis are shown in Table S1.† In order to further verify the existence of oxygen vacancy defects for the MoCoOS-2 catalyst, the EPR was employed and the result is presented in Fig. 1f. It is clear that MoCoOS-2 shows a strong characteristic signal at g = 2.003, which confirms the existence of oxygen vacancy defects in the MoCoOS-2 catalyst. However, the EPR intensities of the characteristic signals of Mo(S,O) and Co(O,S) catalysts are quiet lower than that of the MoCoOS-2 catalyst. From previous studies, it was found that oxygen vacancies can reduce the band gap by forming a defect state below the conduction band or act as photogenerated electron capture centers, thereby inhibiting electron–hole recombination, promoting the transfer of electrons trapped at the defect sites, and improving the catalytic efficiency.53,72–74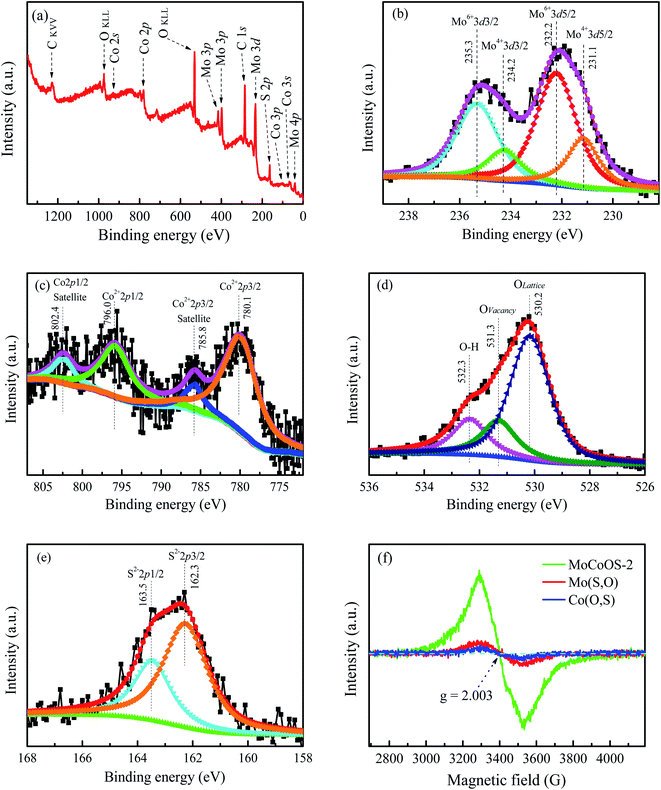 | ||
| Fig. 1 (a) Survey spectrum and high resolution (b) Mo 3d, (c) Co 2p, (d) O 1s, and (e) S 2p XPS spectra of the MoCoOS-2 catalyst. (f) EPR spectra of the MoCoOS-2 catalyst, Mo(S,O), and Co(O,S). | ||
Fig. 2 shows the X-ray diffraction pattern of MoCoOS. The main 2θ peak positions at 22.387°, 24.419°, and 26.048° correspond to the (112), (−106), and (104) crystal planes of Mo4O11 (#86-1269) while the peaks at 29.532°, 30.968°, 57.624° and 52.145° correspond to Co9S8 (#73-1442). The peaks of Co9S8 were not observed in MoCoOS-1 when the smallest amount of CoCl2·6H2O was added. When the added amount of CoCl2·6H2O increased, the diffraction peaks appeared at 29.532°, 30.968°, 57.624° and 52.145° and their intensity also gradually increased. However, the peaks at 22.387°, 24.419°, and 26.048° have lower intensity due to the decreased amount of the Mo4O11 phase in the MoCoOS catalyst. The average crystallite size of the synthesized MoCoOS catalysts is calculated using the Scherrer equation with JADE software and is given in Table S1.† Using the peak at 30.968°, the crystallinity was calculated to be 78.93%, 82.41%, 90.68% and 87.26% for MoCoOS-1 to MoCoOS-4. Fig. S3† shows the XRD diffraction patterns of (a) Mo(S,O) and the Mo4O11 standard of PDF 86-1269 and (b) Co(O,S) and the Co9S8 standard of PDF 73-1442.
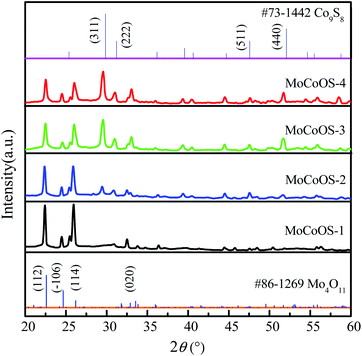 | ||
| Fig. 2 XRD diffraction patterns of MoCoOS, the Mo4O11 standard of PDF 86-1269, and the Co9S8 standard of PDF 73-1442. | ||
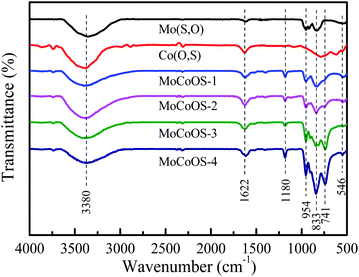
Fig. 3 shows the Fourier infrared spectra of MoCoOS. The higher intensity peak located at 833 cm−1 was attributed to the stretching of Mo–O.75 The peak at 958 cm−1 could be assigned to Mo![[double bond, length as m-dash]](https://www.rsc.org/images/entities/char_e001.gif) O.76 The peaks at 833 and 958 cm−1 were from the crystalline structure of Mo4O11, whereas 546 and 741 cm−1 were obviously the metal sulfide peaks from the Co9S8 phase.77 The broad absorption band situated at 3380 cm−1 and the peak at 1622 cm−1 belong to the stretching vibration and bending vibration of the hydroxyl group, respectively.78,79 The higher intensity peak located at 1180 cm−1 was attributed to S
O.76 The peaks at 833 and 958 cm−1 were from the crystalline structure of Mo4O11, whereas 546 and 741 cm−1 were obviously the metal sulfide peaks from the Co9S8 phase.77 The broad absorption band situated at 3380 cm−1 and the peak at 1622 cm−1 belong to the stretching vibration and bending vibration of the hydroxyl group, respectively.78,79 The higher intensity peak located at 1180 cm−1 was attributed to S![[double bond, length as m-dash]](https://www.rsc.org/images/entities/char_e001.gif) O. The peaks of Mo(S,O) are consistent with the peaks of MoCoOS in the spectrum. The Co(O,S) phase is expected to be dissolved in Mo(S,O) to form the (Mo,Co)(S,O) solid solution. It can be clearly seen from the pattern that the overall intensity of the peaks tends to increase with the increase of CoCl2·6H2O dosage.
O. The peaks of Mo(S,O) are consistent with the peaks of MoCoOS in the spectrum. The Co(O,S) phase is expected to be dissolved in Mo(S,O) to form the (Mo,Co)(S,O) solid solution. It can be clearly seen from the pattern that the overall intensity of the peaks tends to increase with the increase of CoCl2·6H2O dosage.
3.2. Morphology and BET analyses
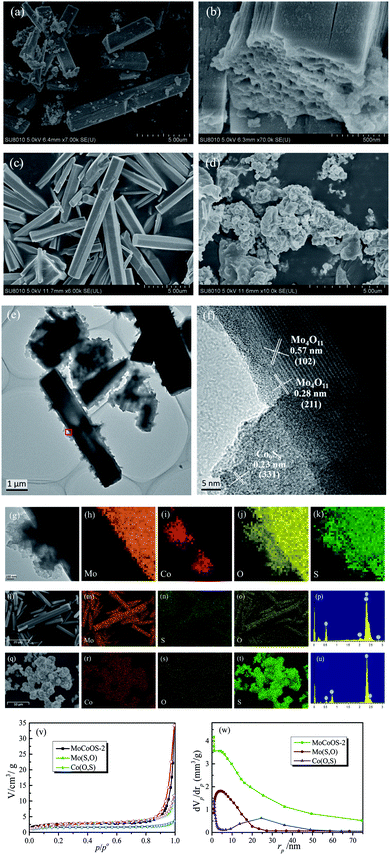
The microstructure and morphology of the MoCoOS catalyst were examined by SEM. As observed from the SEM images of MoCoOS-2 shown in Fig. 4a and b, the rod-shaped Mo4O11 phase formed by crystal stacking has the decorated Co(O,S) covered on its surface. Fig. 4b shows one end of the Mo4O11-phase nanorods to demonstrate the stacking of uniform rectangular sheet structures layer by layer into rectangular nanorods. The thickness of the nanosheets is about 15–20 nm and the thickness of the nanorods after stacking varies from 500 nm to 1000 nm. To further study the microstructure of the catalyst, the MoCoOS-2 catalyst was analyzed by transmission electron microscopy (TEM). Fig. 4c and d present the microstructural morphology of Mo(S,O) and Co(O,S), respectively. It is obvious that the rod-shaped Mo(S,O) and nanoparticle-type Co(O,S) are consistent with the SEM image of MoCoOS. Fig. 4e shows the low magnification transmission electron microscopy image of the MoCoOS-2 catalyst, which is consistent with the SEM image. Under high magnification, many stacked nanosheets can be displayed with a stripe dimension of about 0.8 nm, which is not the lattice spacing but the size of nanosheets. As shown in the HR-TEM image in Fig. 4f, 0.57 nm and 0.28 nm of lattice fringe values correspond to the (102) and (211) crystal orientations of the Mo4O11 phase, respectively. But, the lattice space of 0.23 nm corresponds to the (331) crystal orientation of the Co9S8 phase. These results confirm the existence of interfacial contact between Mo(S,O) and Co(O,S). In addition, the EDX elemental maps of the MoCoOS-2 catalyst demonstrate the homogeneous dispersion of Mo, Co, O, and S elements (Fig. 4g–k), which further confirms the incorporation of S into the Mo4O11 phase to form Mo4(S,O)11 or Mo(S,O) in an abbreviated form, and O into the Co9S8 phase to form Co9(O,S)8 symbolized as Co(O,S).The elemental percentages of the MoCoOS catalysts were measured by XPS, XRF and EDX, and the results are listed in Tables S1–S7.† The results of XPS element ratio analysis are not accurate due to its small sampling area. So the EDX element ratio analysis data with a larger sampling area are used as the supporting data of element proportion. The proportion of Co in the sample increased significantly with the increased amount of CoCl2·6H2O precursor, and the values of Mo/Co in MoCoOS-1, MoCoOS-2, MoCoOS-3, and MoCoOS-4 are about 1.53, 1.37, 1.24 and 0.93, respectively. Therefore, when the amount of Co is excessive, it is easy to phase separate it from the composite state. The EDX elemental mapping images of Mo(S,O) and Co(O,S) are displayed in Fig. 4l–u. The morphological images of rod-like Mo(S,O) and nanoparticle-type Co(O,S) are consistent with that of the MoCoOS-2 catalyst. In order to further prove the influence of oxygen vacancies on photocatalysis, the element contents of Mo(S,O) and Co(O,S) in MoCoOS-1, MoCoOS-2, MoCoOS-3, and MoCoOS-4 were measured by EDX, as shown in Fig. S4 and Tables S4, S5, S6, and S7,† respectively. Five locations were checked on Mo(S,O) and Co(O,S) to measure the element content and the average values at each location were calculated with A, B, C, D, and E data points from Mo(S,O) and F, G, H, I, and J data points from Co(O,S). The molar ratios of S doping in Mo(S,O) for MoCoOS-1, 2, 3 and 4 are 11.75%, 9.58%, 11.38% and 12.39%. The molar ratios of O doping in Co(O,S) for MoCoOS-1, 2, 3 and 4 are 4.77%, 5.94%, 4.40%, and 4.94%. The molar ratios of Co(O,S) or n[Co(O,S)]/{n[Co(O,S)] + n[Mo(S,O)]} in MoCoOS-1, 2, 3 and 4 are about 0.281, 0.394, 0.448 and 0.585, respectively. EPR analysis in Fig. 1f shows that MoCoOS exhibits abundant oxygen vacancies. The existence of sulfur on molybdenum oxide rods might promote the generation of O vacancies. The oxygen vacancies present on the surface of the photocatalyst can activate water molecules and exist as active sites.52,53
The nitrogen adsorption–desorption isotherm of the MoCoOS-2 catalyst is displayed in Fig. 4l and the curve is consistent with the type IV isotherm of the hysteresis loop at relative pressure (p/po) between 0.7 and 1.0. Fig. 4m displays the BJH pore size distribution of MoCoOS-2, Mo(S,O) and Co(O,S). The SBET, total pore volume, and average pore diameter of MoCoOS-2 are 8.5 m2 g−1, 0.053 cm3 g−1, and 24.98 nm, respectively. SBET values of MoCoOS, Mo(S,O) and Co(O,S) are listed in Table S1.† Both the average particle size and specific surface area decreased for samples prepared with a high CoCl2·6H2O content. Therefore, MoCoOS-1 has shown a larger specific surface area.
3.3. Bandgap structure analysis
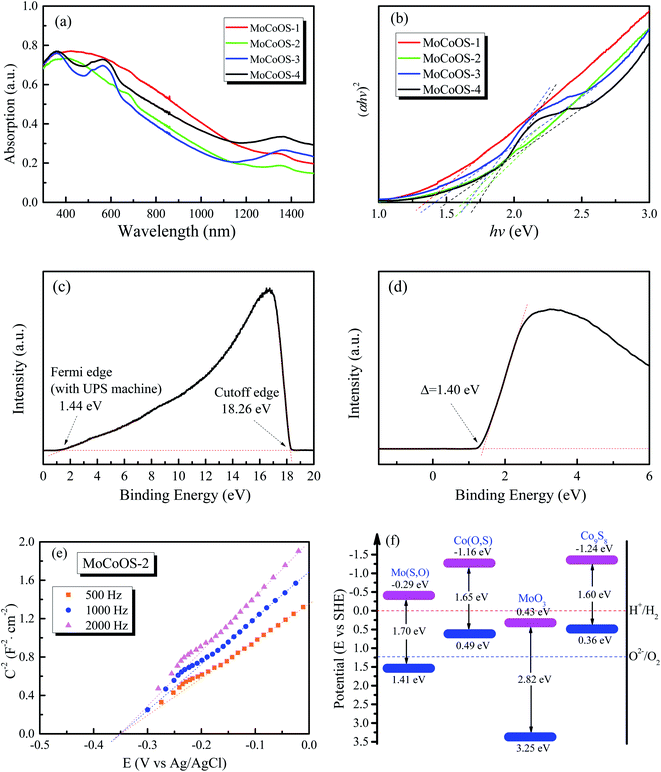
The absorption and optical properties of the MoCoOS catalysts were studied using the UV-vis spectroscopic technique in the wavelength range of 200–2000 nm. Fig. 5a shows the ultraviolet and near infrared absorption spectra of MoCoOS-1, 2, 3, and 4. The bandgaps of the samples were calculated with the formula of in the classic Tauc approach,80,81 where α, h, k, hv, and Eg are the absorption coefficient, Planck constant, absorption constant of direct transition, absorption energy, and bandgap energy, respectively. α can be replaced by absorbance here. When the indirect band gap formula with n = 2 is used, the bandgap of Co(O,S) in MoCoOS is 0.48 eV (Fig. S5†), which is quite different from the bandgaps in previous studies and is not in line with Co9S8.82–84 Therefore, n = 1/2 was adopted in the equation.
It can be seen from Fig. 5b that the band gap of MoCoOS-2 is 1.68 eV. Two bandgap values observed in the UV-vis absorption curves of MoCoOS-3 and MoCoOS-4 support the co-existence of MoCoOS and Co(O,S), which were formed due to partial phase separation from the precipitates leading to the appearance of absorption peaks. The bandgap values of Co(O,S) in MoCoOS-3 and MoCoOS-4 are 1.66 and 1.73 eV, respectively. The change of bandgap width may be caused by the doping amount of oxygen, as shown in Fig. 4j. For comparison, the UV-vis absorption spectra of Mo(S,O) and Co(O,S) and the (αhv)2–hv plots from the UV-vis absorption measurements are displayed in Fig. S5.† The bandgap values of Co(O,S) are close to those in MoCoOS-3 and MoCoOS-4. The slightly different bandgap values of Co(O,S) from the Co9S8 phase in MoCoOS can be related to the doping of O atoms into the Co9S8 lattice, as evidenced by the graph in Fig. 4i. The excess Co(O,S) second phase in MoCoOS can't play a good role in photocatalytic hydrogen production because it alone is not an effective catalyst for hydrogen evolution, which is also in accordance with our experimental data. The hydrogen production of the catalyst begins to decrease when superfluous CoCl2·6H2O is added during the catalyst synthesis. When the amount of CoCl2·6H2O added in the synthesis process is appropriate, the best combination of MoCoOS composite catalysts can be reached with the best match in the band level position of two compounds, which is beneficial for the electron transfer and its lifetime. The Co(O,S) in the composite catalyst also extends the light absorption to a wide wavelength range to benefit photocatalysis (Fig. 5a).
The main content of Mo(S,O) has a Mo4O11 phase as described in the previous XRD pattern. As the band gap of 1.70 eV for Mo(S,O) is much lower than that of ∼2.8 eV for the MoO3 structure,82 it is speculated that the doping of sulfur atoms into the Mo4O11 lattice leads to the reduction of the band gap. The band gap of Co(O,S) in MoCoOS-2 is ∼1.65 eV, which is slightly higher than the reported value of 1.49–1.6 eV in the literature.83,84 The slightly higher value can also be related to the limited doping of oxygen atoms in Co9S8. To establish the band diagram of the composite catalyst systems, the MS tests were conducted for each catalyst, as shown in Fig. S7.† From the MS test, the flat band potential (VFB) values adding to the gap value between the SHE and Ag/AgCl electrode are −1.16 eV for Co(O,S) and −0.29 eV for Mo(S,O), respectively. Due to the fact that the gap value between the SHE and Ag/AgCl electrode is around 0.20 eV: V (vs. SHE) = V (vs. Ag/AgCl) + 0.197 eV + 0.0591 pH. This value is similar to the value (0.20 eV) of the gap between VFB and the conduction band minimum potential (ECB) for the n-type semiconductor, so the equation is written as: VCB = VFB − 0.20 eV + 0.20 eV. Therefore, the CBM values of Mo(S,O) and Co(O,S) are around −1.16 and −0.29 eV. Co(O,S) not only shows a value of −1.16 eV close to −1.24 eV for Co9S8 but also has a similar band gap width. Co(O,S) is expected to be similar to Co9S8 with a limited amount of substituted oxygen.83,84 The Mott–Schottky curve of MoCoOS-2 is also presented in Fig. 5e, and the ECB is obtained as −0.35 eV. Furthermore, UPS was used to determine the work functions of MoCoOS, Mo(S,O), and Co(O,S), and helium Iα was applied as the ultraviolet source (hv = 21.22 eV). As shown in Fig. 5c and d, the binding energies of the secondary electron cutoff edge (EC) and Fermi level edge (EF) are 18.26 eV and 1.44 eV. The equation used to calculate the work function is expressed as Φ = hv − EC + EF. The work function of MoCoOS-2 was determined to be 4.40 eV. The XPS-VB spectrum of MoCoOS-2 was conducted to further verify the valence band maximum (VBM). As presented in Fig. 5d, the gap between the Fermi level and VBM is 4.80 eV. Therefore, the energy level of VBM in MoCoOS-2 is 5.80 eV. As shown in Fig. S7,† the VBM of Mo(S,O) and Co(O,S) is calculated using the same approach and the values are 5.87 eV and 4.89 eV, respectively. The EVB values of MoCoOS, Mo(S,O) and Co(O,S) in a vacuum are converted into the standard hydrogen electrode (SHE) scale according to the standard: 0 eV vs. −4.44 eV. Therefore, the ECB values of MoCoOS, Mo(S,O) and Co(O,S) are 1.36, 1.43, and 0.45 eV. The results are consistent with those of UV and MS tests. The aligned band structure of the catalysts is shown in Fig. 5f.
3.4. Electrochemical analysis
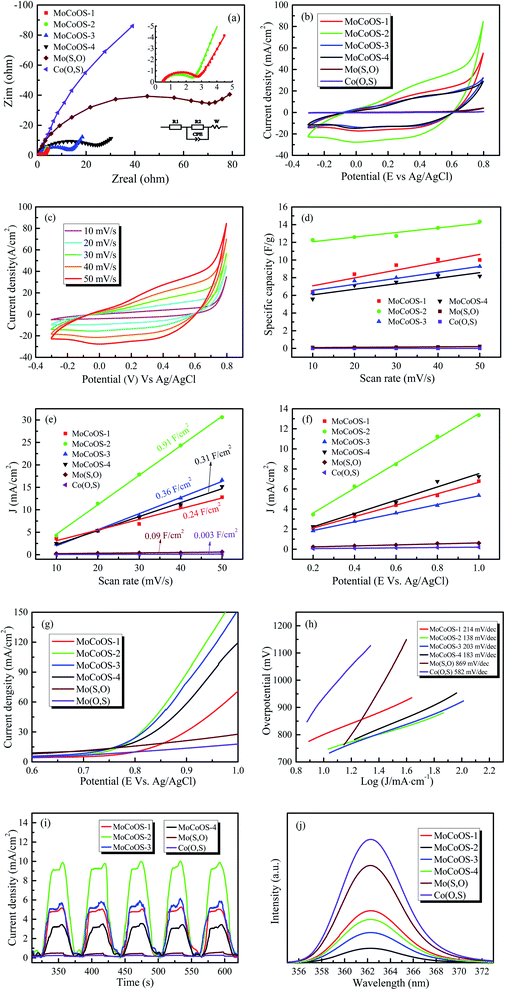
In order to further study the electrochemical characteristics of the MoCoOS catalyst, electrical impedance spectroscopy (EIS), cyclic voltammetry (CV), and multi-frequency Mott–Schottky (MS) and transient photocurrent (TPC) tests were used to study the charge transfer kinetics in the three-electrode system. The diameter of the semicircle in the Nyquist diagram is a useful feature for evaluating charge transfer kinetics in EIS analysis. After installing a simple Randle circuit composed of charge transfer resistance (Rct), electrolyte resistance (Rs), constant phase element (CPE) and diffusion impedance (W), Z-View was used to fit EIS data, and the fitted graph is shown in the pattern. As observed from Fig. 6a with the amount of Co9S8 phase increased with the Co precursor, the semicircle in the Nyquist diagram shows an overall increasing trend which indicates that MoCoOS with a higher Co content leads to higher charge transfer resistance except for MoCoOS-1 due to an undetectable amount of Co(O,S). The resistance values of Mo(S,O), Co(O,S), MoCoOS-1, MoCoOS-2, MoCoOS-3 and MoCoOS-4 are 96.3 Ω, 584.6 Ω, 2.30 Ω, 1.62 Ω, 12.57 Ω and 21.46 Ω, respectively. MoCoOS-2 has the lowest resistance value, which can be beneficial to photocatalysis. The huge difference in resistance between MoCoOS and the control group proves that the formation of the heterostructure not only reduces the electron–hole recombination rate, but also greatly reduces the electron transfer resistance, which is beneficial for the electrons to reach the surface. Fitting parameters of MoCoOS, Mo(S,O), and Co(O,S) are listed in Table S2.†
Fig. 6b shows the current densities of MoCoOS catalysts, Mo(S,O) and Co(O,S) at a scan rate of 50 mV s−1. It is obvious that the MoCoOS-2 catalyst has a highest current density. Current densities of MoCoOS are much higher than those of Mo(S,O) and Co(O,S). Fig. 6c shows the current density of the MoCoOS-2 catalyst at scan rates of 10–50 mV s−1, and the peak specific current increases slightly with the increase of scan rate, which indicates that the MoCoOS nanoparticle electrode shows good rate performance.85 The current density plots of Mo(S,O) and Co(O,S) at scan rates of 10–50 mV s−1 are shown in Fig. S8.†Fig. 6d shows the specific capacitance of the MoCoOS catalyst with the value calculated by the following equation:
 is determined by the integral area under the CV curve, I is the current, V is the voltage, S is the scan rate, and A is the active area of the MoCoOS electrode. When the scan rate is 50 mV s−1, the specific capacitances of Mo(S,O), Co(O,S), MoCoOS-1, MoCoOS-2, MoCoOS-3 and MoCoOS-4 are 0.366, 0.204, 12.0, 13.3, 10.3 and 9.18 F g−1, respectively.86 It can be seen from the figure that with the increase of scan rate, the capacitance slightly increases due to the fact that the number of ions contained in the electrolyte transmitted to the electrode increases. As shown in Fig. 6e, MoCoOS-2 exhibits a much larger Cdl of 0.91 F cm−2 than the others, indicating the formation of active sites by creating surface oxygen vacancies in the MoCoOS-2 catalyst (Table S1†). Fig. 6f shows the current density of the catalyst under different voltages recorded by chronoamperometry. It can be seen from Fig. 6f that the catalyst has good stability when different voltages are applied.
Linear sweep voltammetry (LSV) is also an effective method to characterize the water decomposition ability of catalysts. The LSV curve of the catalyst is presented in Fig. 6g and it can be clearly seen from the figure that the MoCoOS-2 catalyst shows a higher current density at the same potential. Furthermore, Tafel slopes of MoCoOS-1, MoCoOS-2, MoCoOS-3, MoCoOS-4, Mo(S,O) and Co(O,S) obtained from the LSV diagram (Fig. 6h) are 214, 138, 203, 183, 869, and 582 mV dec−1, respectively. MoCoOS-2 has the lowest overpotential of 138 mV dec−1.
Illumination is the main driving force for the catalyst to generate holes and electrons in photocatalytic reaction. Fig. 6i shows the transient photocurrent (TPC) generated by Mo(S,O), Co(O,S), and MoCoOS catalysts prepared with different amounts of CoCl2·6H2O, under the illumination of incident photons. Chronoamperometry was used to record the response of MoCoOS to visible light. Under the voltage of 0.8 V, MoCoOS-2 showed the highest current density of 9.99 mA cm−2. MoCoOS-1, MoCoOS-3, and MoCoOS-4 had relatively low current densities at 7.63, 7.33 and 7.24 mA cm−2, respectively. The TPC values of Mo(S,O) and Co(O,S) are 0.49 and 0.24 mA cm−2, respectively, which are much lower than those of the MoCoOS catalysts. TPC data are consistent with those with the EIS test, indicating that photoelectron–hole pairs can be effectively separated for the MoCoOS-2 catalyst. Fig. 6j shows the photoluminescence spectrum of the MoCoOS catalysts. The photoluminescence spectrum of the catalyst was obtained under excitation at 362 nm with a laser beam at a wavelength of 310 nm. MoCoOS-2 shows the lowest excitation intensity. The PL test indicates that the electron–hole coincidence efficiency of the MoCoOS-2 catalyst is the worst. Of all MoCoOS catalysts, MoCoOS-2 shows the best properties of carrier migration and photocurrent response, and thus an improved photocatalytic reaction can be expected.
3.5. Photocatalytic hydrogen evolution activity and stability
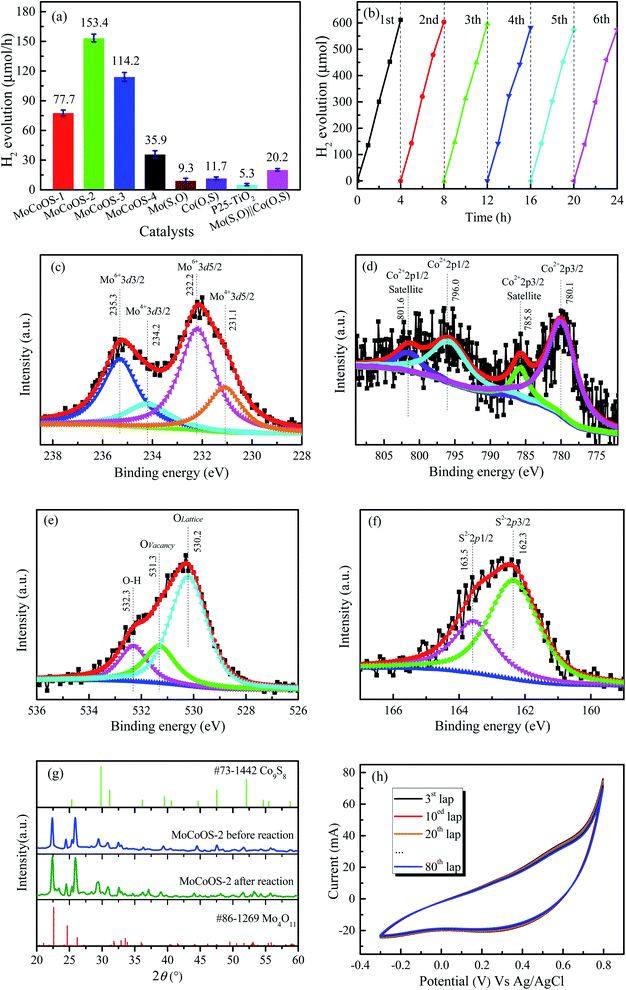
The photocatalytic performance of the prepared catalysts was evaluated under irradiation by 150 W filtered ultraviolet light. To ensure the reproducibility of the catalysts, each catalyst was prepared three times and tested for hydrogen production under the same conditions. Then the average value of hydrogen production was obtained. Fig. 7a shows the hydrogen evolution performance of the MoCoOS, MoSO, and CoOS catalysts. As all catalysts have a certain degree of catalytic hydrogen production, MoCoOS-2 shows the highest hydrogen rate of 153.4 μmol h−1 which is 16 and 12 times higher than that of MoSO and CoOS, respectively. MoCoOS-2 had the strongest current response and the lowest electric resistance in electrochemical impedance testing. Therefore, MoCoOS with a suitable doping amount with the CoCl2·6H2O precursor can effectively improve the hydrogen production efficiency. As the maximum hydrogen production rate of MoCoOS-2 can reach 153.4 μmol h−1, the apparent quantum yield under visible light can reach 14.42%. The solar-to-hydrogen (STH) values were calculated according to the equation:
P
sun of solar light was tested using a full spectrum optical power meter (CEL-NP2000) and calculated to be 920 W m−2. The reaction was performed under irradiation and the area of the reactor was 12 cm2. The rate of H2 evolution is about 42.03 μmol h−1. Based on this, the STH energy conversion efficiency of this system can be calculated as 0.25%. Moreover, the commercial P25–TiO2 and the physical mixture of Co(O,S) and Mo(S,O) were used for photocatalytic hydrogen production to compare with the Z-scheme Mo(S,O)/Co(O,S). Mo(S,O) and Co(O,S) were ground and mixed in a molar ratio of 2![[thin space (1/6-em)]](https://www.rsc.org/images/entities/char_2009.gif) :
:![[thin space (1/6-em)]](https://www.rsc.org/images/entities/char_2009.gif) 1 for 30 min, and the obtained mixture powder was abbreviated as Mo(S,O)‖Co(O,S). After a 4 h hydrogen production test under the same conditions, the Mo(S,O)‖Co(O,S) and commercial P25–TiO2 catalysts produced 20.2 and 5.2 μmol h−1 of hydrogen gas, respectively. The graph of hydrogen generation with time is also shown in Fig. S10.† Table S8† shows the comparison of the photocatalytic activities of hydrogen evolution for various catalysts containing oxides and sulfides of cobalt and molybdenum, as reported in the literature. The MoCoOS-2 catalyst shows superior activity under visible light. Six test cycles every four hours were performed to prove the excellent stability of hydrogen evolution reaction, as shown in Fig. 7b. After each round of reaction, the activity of the catalyst decreased slightly. To eliminate the influence of sulfate and thiosulfate ions, we centrifuged the mixed solution to retain the precipitated catalyst after the end of each reaction cycle. The catalyst after the reaction was added into a new solution with sacrificial agents (10 mmol Na2S and 10 mmol Na2SO3) for a new test cycle. Fig. 7c–f display the XPS spectra of the MoCoOS-2 catalyst after the hydrogen production reaction. Comparing the spectra of each element in Fig. 1a–d, it can be seen that are no obvious changes. The XRD pattern of MoCoOS-2 after hydrogen evolution tests of 12 h shown in Fig. 7g also explains its stability. The redox reaction was measured by cyclic voltammetry for 80 cycles under the scan rate of 50 mV s−1 and the potential window of −0.3 to +0.8 V. As shown in Fig. 7h the small oxidation and reduction peaks remain basically unchanged after 80 cycles. To sum up, MoCoOS-2 with excellent hydrogen evolution performance has good photocatalytic stability.
1 for 30 min, and the obtained mixture powder was abbreviated as Mo(S,O)‖Co(O,S). After a 4 h hydrogen production test under the same conditions, the Mo(S,O)‖Co(O,S) and commercial P25–TiO2 catalysts produced 20.2 and 5.2 μmol h−1 of hydrogen gas, respectively. The graph of hydrogen generation with time is also shown in Fig. S10.† Table S8† shows the comparison of the photocatalytic activities of hydrogen evolution for various catalysts containing oxides and sulfides of cobalt and molybdenum, as reported in the literature. The MoCoOS-2 catalyst shows superior activity under visible light. Six test cycles every four hours were performed to prove the excellent stability of hydrogen evolution reaction, as shown in Fig. 7b. After each round of reaction, the activity of the catalyst decreased slightly. To eliminate the influence of sulfate and thiosulfate ions, we centrifuged the mixed solution to retain the precipitated catalyst after the end of each reaction cycle. The catalyst after the reaction was added into a new solution with sacrificial agents (10 mmol Na2S and 10 mmol Na2SO3) for a new test cycle. Fig. 7c–f display the XPS spectra of the MoCoOS-2 catalyst after the hydrogen production reaction. Comparing the spectra of each element in Fig. 1a–d, it can be seen that are no obvious changes. The XRD pattern of MoCoOS-2 after hydrogen evolution tests of 12 h shown in Fig. 7g also explains its stability. The redox reaction was measured by cyclic voltammetry for 80 cycles under the scan rate of 50 mV s−1 and the potential window of −0.3 to +0.8 V. As shown in Fig. 7h the small oxidation and reduction peaks remain basically unchanged after 80 cycles. To sum up, MoCoOS-2 with excellent hydrogen evolution performance has good photocatalytic stability.
3.6. Reduction of 4-NP
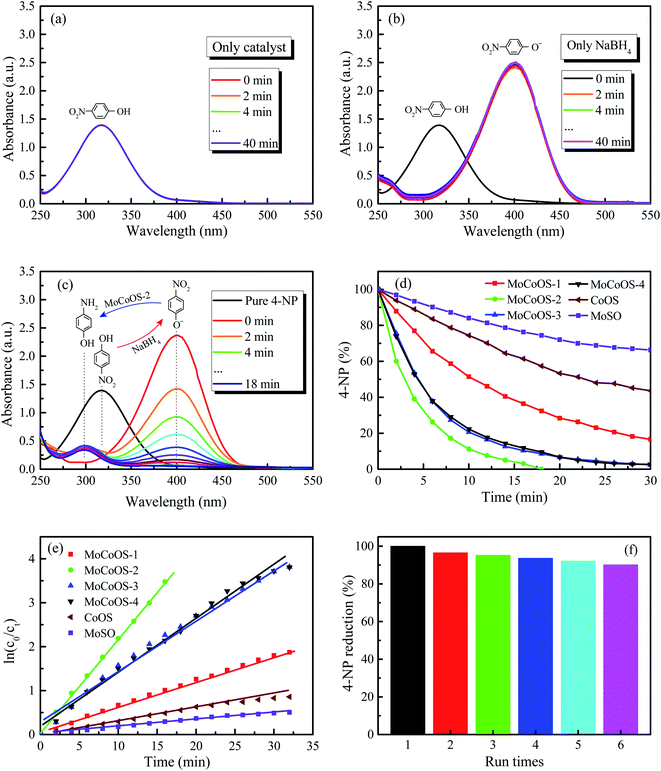
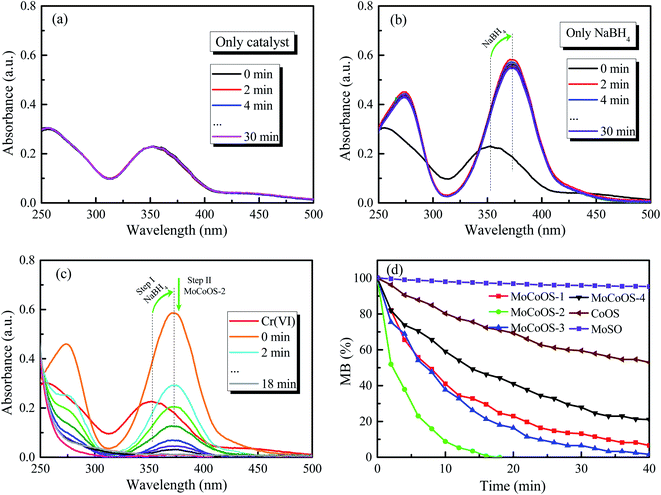
Before conducting heterogeneous catalytic reduction of 4-NP with NaBH4, the results of the NaBH4-free and the catalyst-free tests were evaluated. Fig. 8a and b show the catalytic inability of MoCoOS-2 in reducing 4-NP under dark conditions. Fig. 8c shows the reduction of 4-NP in the presence of MoCoOS-2 and NaBH4 together. As shown in the pattern, 100 mL of 20 ppm 4-NP solution has almost completely reacted within 18 min in the presence of 5 mg of MoCoOS-3 catalyst and 50 mg of NaBH4. During the experiment, the color of the solution changed from yellow to deep yellow with the NaBH4 dissolved gradually. Meanwhile, the original peak position of the ultraviolet spectrum at 317 nm shifted to 400 nm for the ionic state, and then shifted to 300 nm after conversion to 4-AP. With the hydrogenation proceeding, the intensity of the peak at 300 nm increased. Fig. 8d shows the conversion performance for all the MoCoOS catalysts. The MoCoOS-2 catalyst has the best catalytic effect. The first-order reaction kinetics data of reduction reaction can be calculated by using the data of Fig. 8d and the following formula:ln![[thin space (1/6-em)]](https://www.rsc.org/images/entities/char_2009.gif) C0/Ct = kt C0/Ct = kt |
3.7. Reduction activity for MO, MB, and RhB
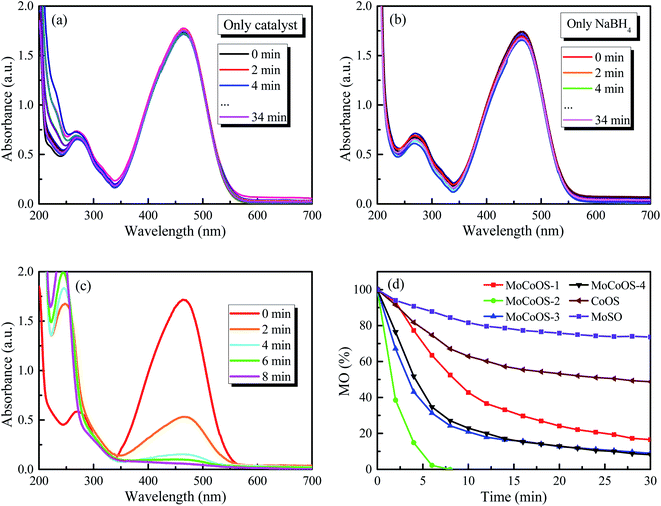
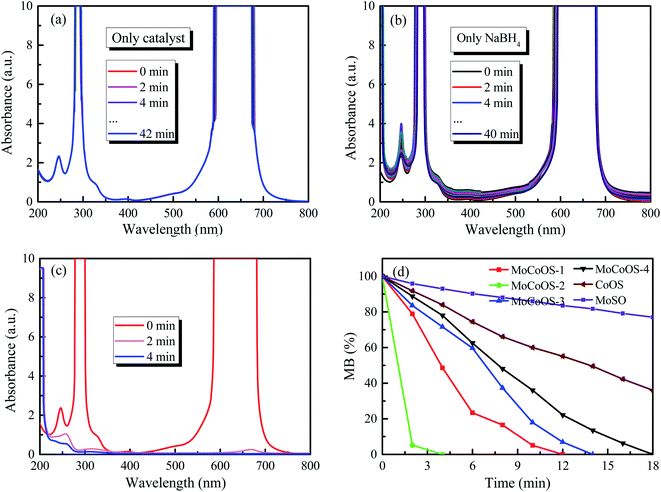
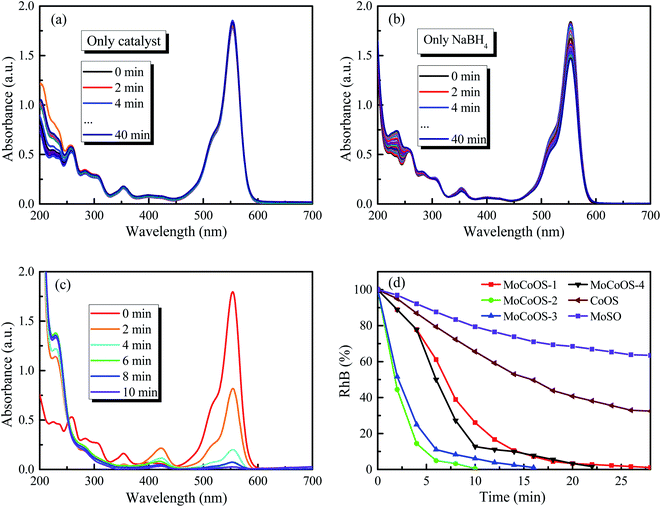
The UV-vis absorption patterns of the reduction of MO, MB and RhB by MoCoOS catalysts are shown in Fig. 9, 10 and 11, respectively. Throughout the reaction, 5 mg of MoCoOS catalyst was used to reduce 100 mL of 50 ppm organic dyes in the presence of 50 mg NaBH4 as the reducing agent. Fig. 9a, 10a and 11a show the reduction of dye solutions in the presence of only the MoCoOS-2 catalyst for the reduction of dyes MO, MB, and RhB, respectively. The reduction reaction without the aid of NaBH4 did not occur. Fig. 9b, 10b and 11b show the catalyst-free reduction reaction in the presence of NaBH4. There are no noticeable changes for reactions without heterogeneous catalysts. According to Fig. 11b, the reaction rate is calculated to be 0.0086 ppm min−1 per mg of NaBH4. Fig. 9c, 10c, and 11c shows the reduction reaction of the three dyes with the MoCoOS-2 catalyst in the presence of NaBH4. Fig. 9d, 10d and 11d show the reduction effects of MoCoOS catalysts for MO, MB and RhB, respectively. The MoCoOS-2 catalyst shows better reducibility than other samples under dark conditions. In the presence of both MoCoOS-2 catalyst and NaBH4, almost complete reduction of MO, MB, and RhB was achieved within 8, 4, and 10 min, respectively. The first-order reaction rate constants of reduction reactions of MO with MoCoOS-1, MoCoOS-2, MoCoOS-3, and MoCoOS-4 catalysts are 0.066, 0.608, 0.102, and 0.095 min−1; reduction rate constants of MB with MoCoOS catalysts are 0.250, 1.478, 0.176, and 0.118 min−1; and reduction rate constants of RhB with MoCoOS catalysts are 0.159, 0.482, 0.280, and 0.180 min−1, respectively. The reduction performance of the MoCoOS-2 catalyst for the dyes is obviously better than those of other catalysts.3.8. Reduction of Cr(VI)
For the Cr(VI) reduction test, 5 mg of MoCoOS catalyst was used to reduce 100 mL of 20 ppm Cr(VI) in the presence of 50 mg NaBH4 as the reducing agent. Fig. 12a and b show the reduction of Cr(VI) under the NaBH4-free and the catalyst-free conditions, respectively. The results show that the use of either NaBH4 or MoCoOS catalyst alone does not cause the reduction of Cr(VI) within 30 min. Fig. 12c shows that the peak intensity at 250 nm and 300 nm decreases for the catalytic reduction of Cr(VI) with the co-existence of the 5 mg MoCoOS-2 catalyst and 50 mg NaBH4. Fig. 12d shows the catalytic reduction of Cr(VI) by four MoCoOS catalysts, which have the first-order reaction kinetic rate constants of 0.069, 0.267, 0.098, and 0.047 min−1. The first-order kinetic constant of the MoCoOS-2 catalyst is 3.83, 2.73 and 5.72 times higher than those of MoCoOS-1, MoCoOS-3 and MoCoOS-4 catalysts, respectively. Table S10† illustrates the comparison between some previous studies and MoCoOS-2 catalytic reduction performance for Cr(VI).For all the reduction reactions, the MoCoOS catalyst has shown an excellent catalytic effect for several typical water pollutants such as 4-NP, MO, MB, RhB, and Cr(VI). Compared with Ni@carbon,87 the reduction efficiency of hexavalent chromium is enhanced 4 times. In addition to the excellent catalytic activity, the prepared MoCoOS catalyst also shows high stability for repeated runs. To further study the influence of pH change in the reaction environment, we tested the reaction of 4-NP, MO, MB, RhB, and Cr(VI) with MoCoOS-2 under different pH conditions with the results shown in Fig. S11.† The reduction of pollutants can be enhanced at pH < 7. The photocatalytic reduction can be completed within 20 min even under the most difficult conditions at pH = 9.
3.9. Mechanism of hydrogen evolution
Under the illumination of light at the appropriate wavelength, the photocatalyst could induce the formation of photogenerated electrons and holes in the conduction band and valence band, and then hydrogen can be produced. In this study, a filtered xenon lamp with ultraviolet light below 400 nm was used as a light source. The band widths of MoCoOS-1, MoCoOS-3 and MoCoOS-4 catalysts are about 1.7 eV. The reasons for the different PHER rates of MoCoOS are related to the change in the Co precursor content to lead to the different amounts of Mo(S,O) and Co(O,S) in MoCoOS and different S contents in each Mo(S,O) and Co(O,S). With the optimal Co precursor content, the formed MoCoOS-2 catalyst displayed the best charge separation ability, longer charge lifetime, lower transport resistance and the best PHER rate. For Z-scheme photocatalytic water splitting, the reaction kinetics with the reaction steps listed below are explained. At the initial stage, both Mo(S,O) and Co(O,S) in MoCoOS with a bandgap less than 2.0 eV are excited by visible light to generate electron–hole pairs (eqn (1)). The electrons excited in MoCoOS lead to H2 evolution as shown in eqn (2).| Mo(S,O)/Co(O,S) + hν → Mo(S,O)/C(O,S)(e− + h+) | (1) |
| 2H2O + 2e− → H2 + OH− | (2) |
| SO32− + 2OH− + 2h+ → SO42− + H2O | (3) |
| 2S2− + 2h+ → S22− | (4) |
| S22− + SO32− → S2O32− + S2− | (5) |
| SO32− + S2− + 2h+ → S2O32− | (6) |
| S2− + 2SO32− + 2OH− + 4h+ → S2O32− + SO42− + H2O | (7) |
During the photocatalytic water splitting, Mo(IV) can be viewed as Mo(VI) with two attached electrons to form a local plasmon. With the plasmonic interaction, the slightly bound electrons can hop through the catalyst with lower resistance for easy charge separation. The surface oxygen vacancy defects facilitate the effective separation of photogenerated carriers,88,89 and as they trap oxygen from water and make the O–H bond of the H2O molecule weaker.53,62,90,91 As for the added Na2S and Na2SO3, they not only avoid the photocorrosion of sulfide but also go through eqn (3)–(7) for the prevention of the excitation of electrons and holes.
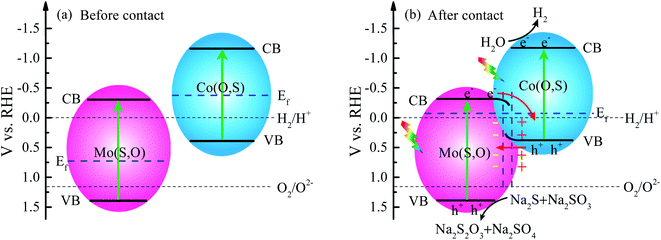
As shown in UPS and XPS-VB spectra, the energy band structure is rearranged to form a new Fermi level after hybridization due to the different Fermi levels. The rearrangement leads to downward band bending of Mo(S,O) and upward band bending of Co(O,S) at the heterojunction. The electrons transfer from Mo(S,O) to Co(O,S) with accumulation of electrons on Co(O,S) and negative charge on Mo(S,O), while the excited holes transfer upward at the junction. A depletion region and an internal electrical field are created at the interface of the heterojunction in this process. The directed migration of photogenerated charges is increased. Conclusively, the electrons in the conduction band of Mo(S,O) transfer to the VB of Co(O,S) and quickly annihilate the holes. The mechanism of transfer leads to a higher separation efficiency. Energy band arrangements in the Z-scheme MoCoOS heterojunction are shown in Fig. 13a and b.
To further ascertain the mechanism of hydrogen production, production of ˙OH and ˙O2− radicals was investigated by the EPR signal spin-trap with DMPO under visible light irradiation. Because the EVB values of Mo(S,O) and Co(O,S) are higher than the reduction potential of DMPO–˙OH, no peak appears under both darkness and illumination. As shown in Fig. 14a, no signals of DMPO–˙O2− can be observed under darkness. After illumination for 10 min, the obvious characteristic DMPO–˙O2− radical peaks of MoCoOS-2 and Co(O,S) arose, and the DMPO–˙O2− characteristic peaks of MoCoOS-2 are higher than those of Co(O,S), which indicates that MoCoOS-2 produces more ˙O2− radicals under illumination (Fig. 14b).92–95 In addition, in Mo(S,O) no DMPO–˙O2− signals appeared under illumination. Because the ECB of Mo(S,O) is positive than −0.33 eV, ˙O2− can't be produced. Thus, if MoCoOS-2 has the type I Z-scheme heterojunction (Fig. 14c), the DMPO–˙O2 signal intensity of MoCoOS-2 should be weaker than that of Co(O,S) due to the electrons transferred to the CB of Mo(S,O). Generation of fewer ˙O2− radicals from Co(O,S) can be related to the pathway for electron transfer, which involves electron transfer from the CB of Mo(S,O) to electronic hole vacancies in the VB of Co(O,S) and then excitation by illumination. Therefore, the path of e− transfer in the MoCoOS-2 photocatalytic system supports the type II Z-scheme heterojunction (Fig. 14d), and the kinetic mechanism diagram of photocatalytic hydrogen evolution of the MoCoOS catalyst is shown in Fig. 15.
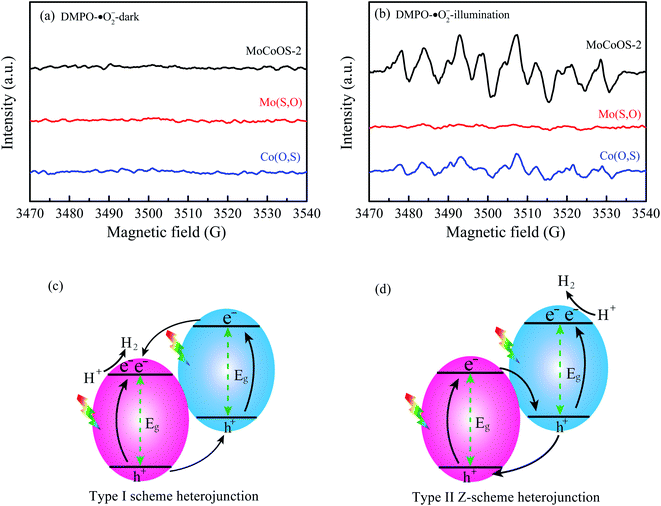 | ||
| Fig. 14 EPR spectra of (a) DMPO–˙O and (b) DMPO–˙O2− for Mo(S,O), Co(O,S), and MoCoOS catalysts under darkness and illumination for 10 min. (c and d) The two types of heterojunction. | ||
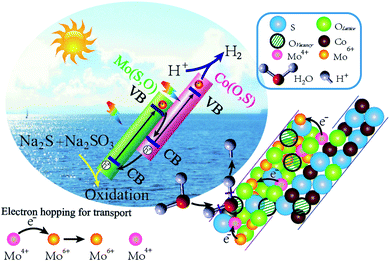 | ||
| Fig. 15 Mechanism diagram of photocatalytic hydrogen production in the presence of the MoCoOS catalyst. | ||
3.10. The mechanism of pollutant reduction
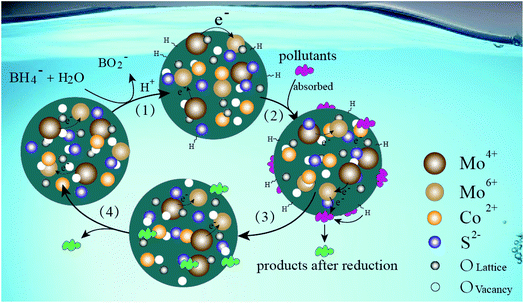
Fig. 16 shows the possible reaction mechanism of the MoCoOS catalyst for catalytic reduction of pollutants in the water environment with sodium borohydride as the sacrificial agent. Firstly, NaBH4 dissolves to generate borohydride ions, which adhere to the catalyst surface and covalently bond with it.96 Simultaneously, pollutants are adsorbed on the surface of the MoCoOS catalyst and strongly interact with covalently bonded hydrogen atoms, and then electrons are transferred from donor BH4− to acceptor pollutants. The electron transfer occurs between Mo(IV) and Mo(VI) in the catalyst to enhance the lifetime of electrons, which further promotes the reduction reaction.97,98 Finally, the pollutants are reduced with their products leaving the reaction site. In this reaction process, the catalyst provides a reaction site, and the valence charge-changing Mo ions provide a springboard for electron transfer.4. Conclusions
MoCoOS catalysts with different Co(O,S) doping amounts were successfully synthesized and characterized as well as utilized for photocatalytic hydrogen production and chemical pollutant reduction. It was found that the synthesized MoCoOS catalyst was a composite consisting of two phases of Mo4O11 and Co9S8 with the incorporation of heteroatoms to form the Mo(S,O)/Co(O,S) catalyst. The MoCoOS-2 catalyst was stable and had the highest hydrogen evolution with a rate of 153.4 μmol h−1. The successfully adjusted energy band structure of the two-phase heterojunction Mo(S,O)/Co(O,S) made the hydrogen production more efficient. In addition, MoCoOS-2 with the best PHER performance also displayed the fastest rates in the NaBH4-aided reduction of MO, MB, RhB, 4-NP, and Cr(VI). Therefore, it is expected that this research of MoCoOS catalysts provides important insights on material design for hydrogen production and pollutant reduction by forming a heterojunction and improving the electron transport efficiency of the bimetallic catalyst.Conflicts of interest
The authors declare that they have no known competing financial interests or personal relationships that could have appeared to influence the work reported in this paper.Acknowledgements
This work was supported by the National Natural Science Foundation of China under the grant no. 31000269, National Natural Science Foundation of Fujian Province under grant no. 2021J01100, and Innovation Foundation of Fujian Agriculture and Forestry University under grant no. CXZX2020129B.References
- A. Ismaila, H. H. Chen, Y. Shao, S. J. Xu, Y. L. Jiao, X. L. Chen, X. Gao and X. L. Fan, Renewable hydrogen production from steam reforming of glycerol (SRG) over ceria-modified γ-alumina supported Ni catalyst, Chin. J. Chem. Eng., 2020, 28, 2328–2336 CrossRef CAS
.
- K. Sana, K. Besma, P. Maria, Z. Fethi and T. Mohand, Production of hydrogen and hydrogen-rich syngas during thermal catalytic supported cracking of waste tyres in a bench-scale fixed bed reactor, Int. J. Hydrogen Energy, 2019, 44, 11289–11302 CrossRef
.
- J. Hu, C. Zhang, X. Meng, H. Lin, C. Hu, X. Long and S. Yang, Hydrogen evolution electrocatalysis with binary-nonmetal transition metal compounds, J. Mater. Chem. A, 2017, 5, 5995–6012 RSC
.
- Q. Wu, Y. Liu, J. Cao, Y. Sun, F. Liao, Y. Liu, H. Huang, M. Shao and Z. Kang, A function-switchable metal-free photocatalyst for the efficient and selective production of hydrogen and hydrogen peroxide, J. Mater. Chem. A, 2020, 23, 11773–11780 RSC
.
- Y. R. Yang, M. Qiu, F. Y. Chen, Q. Qi, G. M. Yan, L. Liu and Y. F. Liu, Charge-transfer-mediated photocatalysis of W18O49@CdS nanotubes to boost photocatalytic hydrogen production, Appl. Surf. Sci., 2021, 541, 148415 CrossRef CAS
.
- X. H. Li, J. Xu, X. Y. Zhou, Z. Y. Liu, Y. R. Li, S. Zhao, L. J. Li and M. Mao, Amorphous CoS modified nanorod NiMoO4 photocatalysis for hydrogen production, J. Mater. Chem. A, 2020, 31, 182–195 CAS
.
- H. Abdullah, N. S. Gultom and D.-H. Kuo, Depletion-Zone size control of p-type NiO/n-type Zn(O,S) nanodiodes on high-surface-area SiO2 nanoparticles as a strategy to significantly enhance hydrogen evolution rate, Appl. Catal., B, 2020, 261 DOI:10.1016/j.apcatb.2019.118223
.
- Q. Yue, Y. Wan, Z. Sun, X. Wu, Y. Yuan and P. Du, MoP is a novel, noble-metal-free cocatalyst for enhanced photocatalytic hydrogen production from water under visible light, J. Mater. Chem. A, 2015, 33, 16941–16947 RSC
.
- H. B. Zhang, G. G. Liu and L. Shi, Engineering coordination polymers for photocatalysis, Nano energy, 2016, 22, 149–168 CrossRef CAS
.
- A. Naseri, M. Samadi, A. Pourjavadi, A. Z. Moshfegh and S. Ramakrishna, Graphitic carbon nitride (g-C3N4)-based photocatalysts for solar hydrogen generation: recent advances and future development directions, J. Mater. Chem. A, 2017, 45, 23406–23433 RSC
.
- L. Qian, S. H. Wang, Q. H. Ren, T. Y. Li, G. M. Tu, S. X. Zhong, Y. L. Zhao and S. Bai, Stacking design in photocatalysis: Synergizing cocatalyst roles and anti-corrosion functions of metallic MoS2 and graphene for remarkable hydrogen evolution over CdS, J. Mater. Chem. A, 2021, 9, 1552–1562 RSC
.
- B. Poornaprakash, U. Chalapathi, M. Kumar, K. Subramanyam, S. V. Prabhakar Vattikuti, M. Siva Pratap Reddy and S. H. Park, Enhanced photocatalytic activity and hydrogen evolution of CdS nanoparticles through Er doping, Ceram. Int., 2020, 46, 21728–21735 CrossRef CAS
.
- Y. Niu, F. Y. Li, K. Yang, Q. Y. Wu, P. J. Xu and R. Z. Wang, Highly efficient photocatalytic hydrogen on CoS/TiO2 photocatalysts from aqueous methanol solution, Int. J. Photoenergy, 2018 DOI:10.1155/2018/8143940
.
- I. Ghiat, A. Saadi, K. Bachari, N. J. Coville and A. Boudjemaa, Spherical NiCu phyllosilicate photocatalysts for hydrogen generation, Int. J. Hydrogen Energy, 2020 DOI:10.1016/j.ijhydene.2020.10.203
.
- W. T. Chen, V. Jovic, D. X. Sun, H. Idriss and G. I. N. Waterhouse, The role of CuO in promoting photocatalytic hydrogen production over TiO2, Int. J. Hydrogen Energy, 2013, 38, 15036–15048 CrossRef CAS
.
- X. Li, J. Yu and M. Jaroniec, Hierarchical photocatalysts, Chem. Soc. Rev., 2016, 45, 2603–2636 RSC
.
- H. L. Tan, F. F. Abdi and Y. H. Ng, Heterogeneous photocatalysts: An overview of classic and modern approaches for optical, electronic, and charge dynamics evaluation, Chem. Soc. Rev., 2019, 48, 1255–1271 RSC
.
- P. Zhou, J. Yu and M. Jaroniec, All-solid-state Z-scheme photocatalytic systems, Adv. Mater., 2014, 26, 4920–4935 CrossRef CAS PubMed
.
- Q. Xu, L. Zhang, B. Cheng, J. Fan and J. Yu, S-Scheme heterojunction photocatalyst, Chem, 2020, 6, 1543–1559 CAS
.
- Q. Wu, X. Wang, J. Fu, O. A. Zelekew, A. B. Abdeta, D.-H. Kuo, J. Zhang, Z. Yuan, J. Lin and X. Chen, Wool-coiled bimetallic oxysulfide MoSrOS catalyst synthesis for catalytic reduction of toxic organic pollutants and heavy metal ions, J. Sci.: Adv. Mater. Devices, 2021, 6, 578–586 CAS
.
- Y. Z. Guo, B. B. Chang, T. Wen, S. R. Zhang, M. Zeng, N. T. Hu, Y. J. Su and Z. Yang, A Z-scheme photocatalyst for enhanced photocatalytic H2 evolution, constructed by growth of 2D plasmonic MoO3−x nanoplates onto 2D g-C3N4 nanosheets, J. Colloid Interface Sci., 2020, 567, 213–223 CrossRef CAS PubMed
.
- Q. Liu, S. H. Wang, Q. H. Ren, T. Y. Li, G. M. Tu, S. H. Zhong, Y. L. Zhao and S. Bai, Stacking design in photocatalysis: Synergizing cocatalyst roles and anti-corrosion functions of metallic MoS2 and graphene for remarkable hydrogen evolution over CdS, J. Mater. Chem. A, 2021, 9, 1552–1562 RSC
.
- Z. Z. Li, X. C. Meng and Z. S. Zhang, Recent development on MoS2-based photocatalysis: A review, J. Photochem. Photobiol., C, 2018, 35, 39–55 CrossRef CAS
.
- S. Y. Wang, X. Zhao, H. M. A. Sharif, Z. W. Chen, Y. T. Chen, B. Zhou, K. Xiao, B. Yang and Q. S. Duan, Amine-CdS for exfoliating and distributing bulk MoO3 for photocatalytic hydrogen evolution and Cr(VI) reduction, Chem. Eng. J., 2021, 406, 126849 CrossRef CAS
.
- V. Sharma, V. Maivizhikannan, V. N. Rao, S. Kumar, A. Kumar, A. Kumar, M. V. Shankar and V. Krishnan, Sea urchin shaped ZnO coupled with MoS2 and polyaniline as highly efficient photocatalysts for organic pollutant decomposition and hydrogen evolution, Ceram. Int., 2021, 47, 10301–10313 CrossRef CAS
.
- B. Han, S. Q. Liu, N. Zhang, Y. J. Xu and Z. R. Tang, One-dimensional CdS@MoS2 core–shell nanowires for boosted photocatalytic hydrogen evolution under visible light, Appl. Catal., B, 2017, 202, 298–304 CrossRef CAS
.
- B. S. Goud, G. Koyyada, J. H. Jung, G. R. Reddy, J. Shim, N. D. Nam and S. V. P. Vattikuti, Surface oxygen vacancy facilitated Z-scheme MoS2/Bi2O3 heterojunction for enhanced visible-light driven photocatalysis-pollutant degradation and hydrogen production, Int. J. Hydrogen Energy, 2020, 45, 18961–18975 CrossRef CAS
.
-
G. Bergin, Managing Planet Earth: Perspectives on Population, Ecology, and the Law [C], Westport, 1990, vol. 44 Search PubMed
.
- Commission Directive 2006/15/EC, Off. J. Eur. Communities: Legis., 2006, L38/36–L38/39 Search PubMed
.
- US-EPA, https://www3.epa.gov/airtoxics/pollsour.html.
- S. X. Liu and X. Y. Chen, A visible light response TiO2 photocatalyst realized by cationic S-doping and its application for phenol degradation, J. Hazard. Mater., 2008, 152, 48–55 CrossRef CAS PubMed
.
- H. Z. Sun, Y. B. Guo, O. A. Zelekew, A. B. Abdeta, D.-H. Kuo, Q. Wu, J. Zhang, Z. Yuan, J. Lin and X. Y. Chen, Biological renewable nanocellulose templated CeO2/TiO2 synthesis and its photocatalytic removal efficiency of pollutants, J. Mol. Liq., 2021, 336, 116873 CrossRef CAS
.
- E. Brasili, I. Bavasso, V. Petruccelli, G. Vilardi, A. Valletta, C. D. Bosco, A. Gentili, G. Pasqua and L. D. Palma, Remediation of hexavalent chromium contaminated water through zero-valent iron nanoparticles and effects on tomato plant growth performance, Sci. Rep., 2020, 10, 1–11 CrossRef PubMed
.
-
W. H. Organization, The Public Health Impact of Chemicals: Knowns and Unknowns, World Health Organization, Geneva PP, Geneva, 2016 Search PubMed
.
-
Agency for Toxic Substances and Disease Registry, Chromium Toxicity – what Are the Standards and Regulations for Chromium Exposure?, 2013 Search PubMed
.
- D. V. Brusselen, T. Kayembe-Kitenge, S. Mbuyi-Musanzayi, T. L. Kasole, L. K. Ngombe, P. Musa Obadia, D. K. wa Mukoma, K. Van Herck, D. Avonts, K. Devriendt, E. Smolder, C. B. L. Nkulu and B. Nemery, Metal mining and birth defects: A case-control study in Lubumbashi, Democratic Republic of the Congo, Lancet Planet. Health, 2020, 4, 158–167 CrossRef
.
- P. J. Landrigan, R. Fuller, N. J. R. Acosta, O. Adeyi and R. Arnold, The Lancet Commission on pollution and health, Lancet, 2018, 391, 462–512 CrossRef
.
- D. P. Zagklis, A. I. Vavouraki, M. E. Kornaros and C. A. Paraskeva, Purification of olive mill wastewater phenols through membrane filtration and resin adsorption/desorption, J. Hazard. Mater., 2015, 285, 69–76 CrossRef CAS PubMed
.
- I. Khouni, G. Louhichi, A. Ghrabi and P. Moulin, Efficiency of a coagulation/flocculation–membrane filtration hybrid process for the treatment of vegetable oil refinery wastewater for safe reuse and recovery, Process Saf. Environ. Prot., 2020, 135, 323–341 CrossRef CAS
.
- O. Türgay, G. Ersöz, S. Atalay, J. Forss and U. Welander, The treatment of azo dyes found in textile industry wastewater by anaerobic biological method and chemical oxidation, Sep. Purif. Technol., 2011, 79, 26–33 CrossRef
.
- S. M. Palácio, F. R. E. Quiñones, A. N. Módenes, C. C. Oliveira and F. H. Borba, Toxicity assessment from electro-coagulation treated-textile dye wastewaters by bioassays, J. Hazard. Mater., 2009, 172, 330–337 CrossRef PubMed
.
- W. L. Kebede, D.-H. Kuo, M. A. Zeleke and K. E. Ahmed, A novel Sb-doped Mo(O,S)3 oxy-sulfide photocatalyst for degradation of methylene blue dye under visible light irradiation, J. Alloys Compd., 2019, 797, 986–994 CrossRef CAS
.
- Ü. Ecer, T. Şahan and A. Zengin, Synthesis and characterization of an efficient catalyst based on MoS2 decorated magnetic pumice: An experimental design study for methyl orange degradation, J. Environ. Chem. Eng., 2021, 9, 105265 CrossRef
.
- Y. Li, Z. Wang, H. J. Zhao, X. J. Huang and M. J. Yang, 3D MoS2@TiO2@poly(methyl methacrylate) nanocomposite with enhanced photocatalytic activity, J. Colloid Interface Sci., 2019, 557, 709–721 CrossRef CAS PubMed
.
- S. N. Li, Y. O. Lv, G. L. Song, C. C. Li, D. W. Gao and G. Z. Chen, Ultrafine NiMoOx nanoparticles confined in mesoporous carbon for the reduction of nitroarenes: Effect of the composition and accessibility of the active sites,
RSC Adv., 2019, 9, 4571–4582 RSC
.
- Y. B. Guo, O. A. Zelekew, H. Z. Sun, D. H. Kuo, J. G. Lin and X. Y. Chen, Catalytic reduction of organic and hexavalent chromium pollutants with highly active bimetal CuBiOS oxysulfide catalyst under dark, Sep. Purif. Technol., 2020, 242, 116769 CrossRef CAS
.
- X. Y. Chen and D. H. Kuo, Nanoflower bimetal CuInOS oxysulfide catalyst for the reduction of Cr(VI) in the dark, ACS Sustainable Chem. Eng., 2017, 5, 4133–4143 CrossRef CAS
.
- X. Y. Chen, D. H. Kuo, J. B. Zhang, Q. X. Lu and J. G. Lin, Nanosheet bimetal oxysulfide CuSbOS catalyst for highly efficient catalytic reduction of heavy metal ions and organic dyes, J. Mol. Liq., 2019, 275, 204–214 CrossRef CAS
.
- X. Y. Chen, D. H. Kuo, A. D. Saragih, Z. Y. Wu, H. Abdullah and J. G. Lin, The effect of the Cu+/Cu2+ ratio on the redox reactions by nanoflower CuNiOS catalysts, Chem. Eng. Sci., 2019, 194, 105–115 CrossRef CAS
.
- H. Z. Sun, A. B. Abdeta, D. H. Kuo, Q. H. Wu, Y. B. Guo, O. A. Zelekew, Z. H. Yuan, J. G. Lin and X. Y. Chen, Activated carbon supported CuSnOS catalyst with an efficient catalytic reduction of pollutants under dark condition, J. Mol. Liq., 2021, 116079 CrossRef CAS
.
- H. Z. Sun, O. A. Zelekew, X. Y. Chen, Y. B. Guo, D.-H. Kuo, Q. X. Lu and J. G. Lin, A noble bimetal oxysulfide CuVOS catalyst for highly efficient catalytic reduction of 4-nitrophenol and organic dyes, RSC Adv., 2019, 09, 31828–31839 RSC
.
- X. Y. Chen, T. Huang, D. H. Kuo, H. Z. Sun, P. Li, O. A. Zelekew, A. B. Abdeta, Q. H. Wu, J. B. Zhang, Z. H. Yuan and J. G. Lin, Material design with the concept of solid solution-type defect engineering in realizing the conversion of an electrocatalyst of NiS2 into a photocatalyst for hydrogen evolution, Appl. Catal., B, 2021, 298, 120542 CrossRef CAS
.
- X. Y. Chen, H. Z. Sun, D.-H. Kuo, A. B. Abdeta, O. A. Zelekew, Y. Guo, J. Zhang, Z. Yuan and J. Lin, Spherical nanoflower-like bimetallic (Mo,Ni)(S,O)3−x sulfo-oxide catalysts for efficient hydrogen evolution under visible light, Appl. Catal., B, 2021, 287, 119992 CrossRef CAS
.
- N. S. Gultom, H. Abdullah and D.-H. Kuo, Phase transformation of bimetal zinc nickel oxide to oxysulfide photocatalyst with its exceptional performance to evolve hydrogen, Appl. Catal., B, 2020, 272, 118985 CrossRef CAS
.
- N. S. Gultom, H. Abdullah and D.-H. Kuo, Facile synthesis of cobalt-doped (Zn, Ni)(O,S) as an efficient photocatalyst for hydrogen production, J. Energy Inst., 2019, 92, 1428–1439 CrossRef CAS
.
- N. S. Gultom, H. Abdullah, D.-H. Kuo and W. C. Ke, Oriented p–n heterojunction Ag2O/Zn(O,S) nanodiodes on mesoporous SiO2 for photocatalytic hydrogen production, ACS Appl. Energy Mater., 2019, 2, 3228–3236 CrossRef CAS
.
- M. Ponce-Mosso, M. Pérez-González, P. E. García-Tinoco, H. Crotte-Ledesma, M. Morales-Luna and S. A. Tomás, Enhanced photocatalytic activity of amorphous MoO3 thin films deposited by RF reactive magnetron sputtering, Catal. Today, 2020, 349, 150–158 CrossRef CAS
.
- A. B. Abdeta, H. Z. Sun, Y. B. Guo, Q. H. Wu, J. B. Zhang, Z. H. Yuan, J. G. Lin and X. Y. Chen, A novel AgMoOS bimetallic oxysulfide catalyst for highly efficiency catalytic reduction of organic dyes and chromium (VI), Adv. Powder Technol., 2021, 32, 2856–2872 CrossRef CAS
.
- E. Zhou, C. G. Wang, Q. Q. Zhao, Z. P. Li, M. H. Shao, X. L. Deng, X. J. Liu and X. J. Xu, Facile synthesis of MoO2 nanoparticles as high-performance supercapacitor electrodes and photocatalysts, Ceram. Int., 2016, 42, 2198–2203 CrossRef CAS
.
- K. Q. Jing, W. Ma, Y. H. Ren, J. H. Xiong, B. B. Guo, Y. J. Song, S. J. Liang and L. Wu, Hierarchical Bi2MoO6 spheres in situ assembled by monolayer nanosheets toward photocatalytic selective oxidation of benzyl alcohol, Appl. Catal., B, 2019, 243, 10–18 CrossRef CAS
.
- Y. Hermans, C. Olivier, H. Junge, A. Klein, W. Jaegermann and T. Toupance, Sunlight selective photodeposition of CoOx(OH)y and NiOx(OH)y on truncated bipyramidal BiVO4 for highly efficient photocatalysis, ACS Appl. Mater. Interfaces, 2020 DOI:10.1021/acsami.0c14624
.
- X. Y. Chen, T. Huang, D. H. Kuo, H. Z. Sun, P. Li, O. A. Zelekew, A. B. Abdeta, Q. Wu, J. Zhang, Z. Yuan and J. Lin, Material design with the concept of solid solution-type defect engineering in realizing the conversion of an electrocatalyst of NiS2 into a photocatalyst for hydrogen evolution, Appl. Catal., B, 2021, 298, 120542 CrossRef CAS
.
- X. Y. Chen, D.-H. Kuo and D. Lu, N-doped mesoporous TiO2 nanoparticles synthesized by using biological renewable nanocrystalline cellulose as template for the degradation of pollutants under visible and sun light, Chem. Eng. J., 2016, 295, 192–200 CrossRef CAS
.
- T. Zhang, M.-Y. Wu, D.-Y. Yan, J. Mao, H. Liu, W.-B. Hu, X.-W. Du, T. Ling and S.-Z. Qiao, Engineering oxygen vacancy on NiO nanorod arrays for alkaline hydrogen evolution, Nano Energy, 2018, 43, 103–109 CrossRef CAS
.
- P. Borthakur, P. K. Boruah and M. R. Das, Facile synthesis of CuS nanoparticles on two-dimensional nanosheets as efficient artificial nanozyme for detection of Ibuprofen in water, J. Environ. Chem. Eng., 2021, 9, 104635 CrossRef CAS
.
- X. Y. Chen, D.-H. Kuo, Z. Y. Wu, J. B. Zhang, Y. B. Guo, H. Z. Sun and J. G. Lin, Multi-component (Cu, Mn)(Se, S) nanosheet catalysts for redox reactions in the dark, Sep. Purif. Technol., 2019, 211, 71–80 CrossRef CAS
.
- X. Y. Chen, H. Z. Sun, J. B. Zhang, Y. B. Guo and D.-H. Kuo, Cationic S-doped TiO2/SiO2 visible-light photocatalyst synthesized by co-hydrolysis method and its application for organic degradation, J. Mol. Liq., 2019, 273, 50–57 CrossRef CAS
.
- V. Gurylev, C. Y. Su and T. P. Perng, Surface reconstruction, oxygen vacancy distribution and photocatalytic activity of hydrogenated titanium oxide thin film, J. Catal., 2015, 330, 177–186 CrossRef CAS
.
- J. Li, M. Zhang and Z. Guan, Synergistic effect of surface and bulk single-electron-trapped oxygen vacancy of TiO2 in the photocatalytic reduction of CO2, Appl. Catal., B, 2017, 206, 300–307 CrossRef CAS
.
- L. Hou, M. Zhang, Z. Guan, Q. Li and J. Yang, Effect of annealing ambience on the formation of surface/bulk oxygen vacancies in TiO2 for photocatalytic hydrogen evolution, Appl. Surf. Sci., 2018, 428, 640–647 CrossRef CAS
.
- J. J. Li, B. Weng, S. C. Cai, J. Chen, H. P. Jia and Y. J. Xu, Efficient promotion of charge transfer and separation in hydrogenated TiO2/WO3 with rich surface-oxygen-vacancies for photodecomposition of gaseous toluene, J. Hazard. Mater., 2018, 342, 661–669 CrossRef CAS PubMed
.
- S. Jin, X. Ma, J. Pan, C. Zhu, S. E. Saji, J. Hu, X. Xu, L. Sun and Z. Yin, Oxygen vacancies activating surface reactivity to favor charge separation and transfer in nanoporous BiVO4 photoanodes, Appl. Catal., B, 2021, 281, 119477 CrossRef CAS
.
- L. Zhang, W. Wang, D. Jiang, E. Gao and S. Sun, Photoreduction of CO2 on BiOCl nanoplates with the assistance of photoinduced oxygen vacancies, Nano Res., 2014, 8, 821–831 CrossRef
.
- J. Hou, S. Cao, Y. Wu, F. Liang, Y. Sun, Z. Lin and L. Sun, Simultaneously efficient light absorption and charge transport of phosphate and oxygen-vacancy confined in bismuth tungstate atomic layers triggering robust solar CO2 reduction, Nano Energy, 2017, 32, 359–366 CrossRef CAS
.
- Y. Tae Kim and E. Duck Park, Transesterification between dimethyl carbonate and phenol in the presence of (NH4)8Mo10O34 as a catalyst precursor, Appl. Catal., A, 2009, 361, 26–31 CrossRef
.
- A. Brückner, G. Scholz, D. Heidemann, M. Schneider, D. Herein, U. Bentrup and M. Kant, Structural evolution of H4PVMo11O40·xH2O during calcination and isobutane oxidation: New insights into vanadium sites by a comprehensive in situ approach, J. Catal., 2007, 245, 369–380 CrossRef
.
- T. Munir, N. Rehman, A. Mahmood, K. Mahmood, A. Ali, I. Khan, A. Sohail and A. Manzoor, Structural, optical, electrical and thermo-electrical properties of Cu doped Co9S8-NPs synthesized via co-precipitation method, Chem. Phys. Lett., 2020, 761, 137989 CrossRef CAS
.
- X. Y. Chen, H. Z. Sun, J. B. Zhang, O. A. Zelekew, D. F. Lu, D. H. Kuo and J. G. Lin, Synthesis of visible light responsive iodine-doped mesoporous TiO2 by using biological renewable lignin as template for degradation of toxic organic pollutants, Appl. Catal., B, 2019, 252, 152–163 CrossRef CAS
.
- X. Y. Chen, H. Z. Sun, O. A. Zelekew, J. B. Zhang, Y. B. Guo, A. Zeng, D. H. Kuo and J. Lin, Biological renewable hemicellulose-template for synthesis of visible light responsive sulfur-doped TiO2 for photocatalytic oxidation of toxic organic and As(III) pollutants, Appl. Surf. Sci., 2020, 525, 146531 CrossRef CAS
.
- J. Mooney and P. Kambhampati, Get the basics right: Jacobian conversion of wavelength and energy scales for quantitative analysis of emission spectra, J. Phys. Chem. Lett., 2013, 4, 3316–3318 CrossRef CAS
.
- R. L. Perales, J. R. Fuertes, D. Errandonea, D. M. García and A. Segura, Optical absorption of divalent metal tungstates: correlation between the band-gap energy and the cation ionic radius, Europhys. Lett., 2008, 83, 37002–37008 CrossRef
.
- M. Szkoda, K. Trzciński, M. Łapiński and A. Lisowska-Oleksiak, Photoinduced K+ intercalation into MoO3/FTO photoanode—the impact on the photoelectrochemical performance, Electrocatalysis, 2020, 11, 111–120 CrossRef CAS
.
- J. Li, M. Li and Z. Jin, 0D CdxZn1−xS and amorphous Co9S8 formed S-scheme heterojunction boosting photocatalytic hydrogen evolution, Mol. Catal., 2021, 501, 111378 CrossRef CAS
.
- H. Zhang and X. Bai, Photocatalytic production of hydrogen peroxide over Z-schemeMn3O4/Co9S8 with p–n heterostructure, Appl. Catal., B, 2021, 298, 120516 CrossRef CAS
.
- Y. Gogotsi and R. M. Penner, Energy Storage in Nanomaterials – Capacitive, Pseudocapacitive, or Battery-like?, ACS Nano, 2018, 12, 2081–2083 CrossRef CAS PubMed
.
- H. Huang, S. C. Abbas, Q. Deng, Y. Ni, S. Cao and X. Ma, An all-paper, scalable and flexible supercapacitor based on vertically aligned polyaniline (PANI) nano-dendrites@fibers, J. Power Sources, 2021, 498, 229886 CrossRef CAS
.
- Z. Lv, X. Tan, C. Wang, A. Alsaedi, T. R. Hayat and C. Chen, Metal–organic frameworks-derived 3D yolk shell-like structure Ni@carbon as a recyclable catalyst for Cr(VI) reduction, Chem. Eng. J., 2020, 389, 123428 CrossRef CAS
.
- J. Hou, S. Cao, Y. Wu, F. Liang, Y. Sun, Z. Lin and L. Sun, Simultaneously efficient light absorption and charge transport of phosphate and oxygen-vacancy confined in bismuth tungstate atomic layers triggering robust solar CO2 reduction, Nano Energy, 2017, 32, 359–366 CrossRef CAS
.
- N. J. Lawrence, J. R. Brewer, L. Wang, T.-S. Wu, J. Wells-Kingsbury, M. M. Ihrig, G. Wang, Y.-L. Soo, W.-N. Mei and C. L. Cheung, Defect engineering in cubic cerium oxide nanostructures for catalytic oxidation, Nano Lett., 2011, 11, 2666–2671 CrossRef CAS PubMed
.
- S. Jin, X. Ma, J. Pan, C. Zhu, S. E. Saji, J. Hu, X. Xu, L. Sun and Z. Yin, Oxygen vacancies activating surface reactivity to favor charge separation and transfer in nanoporous BiVO4 photoanodes, Appl. Catal.,
B, 2021, 281, 119477 CrossRef CAS
.
- J. Hu, L. Yu, J. Deng, Y. Wang, K. Cheng, C. Ma, Q. Zhang, W. Wen, S. Yu, Y. Pan, J. Yang, H. Ma, F. Qi, Y. Wang, Y. Zheng, M. Chen, R. Huang, S. Zhang, Z. Zhao, J. Mao, X. Meng, Q. Ji, G. Hou, X. Han, X. Bao, Y. Wang and D. Deng, Sulfur vacancy-rich MoS2 as a catalyst for the hydrogenation of CO2 to methanol, Nat. Catal., 2021, 4, 242–250 CrossRef CAS
.
- X. Wang, Z. Cao, Y. Zhang, H. Xu, S. Cao and R. Zhang, All-solid-state Z-scheme Pt/ZnS-ZnO heterostructure sheets for photocatalytic simultaneous evolution of H2 and O2, Chem. Eng. J., 2020, 385, 123782 CrossRef
.
- X. Ma, G. Wang, L. Qin, J. Liu, B. Li, Y. Hu and H. Cheng, Z-scheme g-C3N4-AQ-MoO3 photocatalyst with unique electron transfer channel and large reduction area for enhanced sunlight photocatalytic hydrogen production, Appl. Catal., B, 2021, 288, 120025 CrossRef CAS
.
- X. Chen, W. Zhang, L. Zhang, L. Feng, J. Wen, J. Yang, C. Zhang, J. Jiang and H. Wang, An urchin-like Ag3PO4/Pd/LaPO4 photocatalyst with Z-scheme heterojunction for enhanced hydrogen evolution, Appl. Surf. Sci., 2019, 497, 143771 CrossRef CAS
.
- H. Gao, R. Cao, X. Xu, S. Zhang, Y. Huang, H. Yang, X. Deng and J. Li, Construction of dual defect mediated Z-scheme photocatalysts for enhanced photocatalytic hydrogen evolution, Appl. Catal., B, 2019, 245, 399–409 CrossRef CAS
.
- R. Das, V. S. Sypu, H. K. Paumo, M. Bhaumik, V. Maharaj and A. Maity, Silver decorated magnetic nanocomposite (Fe3O4@PPy-MAA/Ag) as highly active catalyst towards reduction of 4-nitrophenol and toxic organic dyes, Appl. Catal., B, 2019, 244, 546–558 CrossRef CAS
.
- M. Tian, X. L. Cui, C. X. Dong and Z. P. Dong, Palladium nanoparticles dispersed on the hollow aluminosilicate microsphere@hierarchical γ-AlOOH as an excellent catalyst for the hydrogenation of nitroarenes under ambient conditions, Appl. Surf. Sci., 2016, 390, 100–106 CrossRef CAS
.
- H. Zhang, P. Zhang, M. Qiu, J. Dong and Y. Zhang, Ultrasmall MoOx clusters as a novel cocatalyst for photocatalytic hydrogen evolution, Adv. Mater., 2018 DOI:10.1002/adma.201804883
.
Footnote |
| † Electronic supplementary information (ESI) available. See DOI: 10.1039/d1ta09053d |
| This journal is © The Royal Society of Chemistry 2022 |


