 Open Access Article
Creative Commons Attribution 3.0 Unported Licence
A waste to energy approach for the effective conversion of solid waste plastics into graphene nanosheets using different catalysts for high performance supercapacitors: a comparative study
Manoj
Karakoti
a,
Sandeep
Pandey
a,
Gaurav
Tatrari
a,
Pawan Singh
Dhapola
a,
Ritu
Jangra
b,
Sunil
Dhali
a,
Mayank
Pathak
a,
Suman
Mahendia
b and
Nanda Gopal
Sahoo
 *a
*a
aProf. Rajendra Singh Nanoscience and Nanotechnology Centre, Department of Chemistry, DSB Campus, Kumaun University, Nainital 263001, India. E-mail: ngsahoo@yahoo.co.in
bDepartment of Physics, Kurukshetra University, Kurukshetra 136119, India
First published on 11th January 2022
Abstract
Presently, plastic waste management is an urgent issue around the globe that is not easy to resolve. We have made an attempt to resolve this issue by synthesizing graphene nanosheets (GNs), which are later exploited for supercapacitor applications. Herein, we report a multidimensional remediation approach for the mass scale production of GNs from plastic waste using zinc oxide (ZnO) and montmorillonite (MMT) clay as the catalysts and templates. Subsequently, supercapacitor (SC) cells are fabricated from the GNs synthesized using ZnO and MMT, and show good electrochemical performance with specific capacitances of 72.8 F g−1 and 377.4 F g−1, respectively. In addition, the GNs synthesized using MMT showed the highest energy and power densities of 21.1 W h kg−1 and 1010.0 W kg−1, respectively. Essentially, the use of MMT is able to mainly generate GNs with up to ∼2 layers from waste plastics; these GNs are more regular with less defects, which helps in enhancing the electrochemical performance of the cell. Thus, our study revealed that the choice of catalyst and template in a given GNs manufacturing process can alter the morphology and quality of the GNs, which ultimately affects their electrochemical performance in SC cells. We hope that this study can serve as a crucial breakthrough to deal with global threats such as plastic waste pollution and provide an economical option for the fulfilment of global energy demands.
1. Introduction
Over the past few years, plastic-based goods have grown as an integral part of human life. This is mainly due to their high thermal stability, low cost, easy processing, light weight, flexibility, chemical inertness, durability, etc. Plastics can be used for many applications, such as packaging, storage, electrical insulation, etc.1 However, plastics are also associated with several disadvantages, such as low degradation rates and toxicity, which lead to massive environmental pollution as well as adverse health effects on living organisms. An unusual burst in the population worldwide has caused an astonishing increase in the demand and supply of plastic products, which is increasing the rate of disposal of plastic waste in our surroundings. According to the World Wide Fund, plastic production has reached approximately 396 million tons and emits 2 billion tons of atmospheric CO2 annually.2 This report also indicated that plastic production will increase by up to 40% by 2030. The recycling process is regarded as the most suitable technology to resolve the current problem of waste plastics, but it is still poorly developed, resulting in the recycling of only 20% of total plastic waste. Due to this low recycling rate, the disposal of plastic waste is increasing and has reached an alarming situation. Consequently, appropriate management of plastic waste disposal has become a challenging issue for the scientific community and environmentalists. Therefore, recycling and upcycling methods are well recognized as the most suitable solutions for waste plastic management. These methods are more significant if they can produce value-added products from plastic waste, such as fuels, gases, and additives for concrete material, that have similar or different characteristics to the original plastic products.3–7 Usually, plastics are hydrocarbon-based polymers that are made up of carbon, hydrogen and oxygen. Due to the presence of such high carbon content in plastic, it can be used as a good and affordable precursor for the synthesis of carbon nanomaterials (CNMs). Recently, several studies of the conversion of different kinds of plastic waste into CNMs such as carbon nanofibers (CNFs), carbon nanotubes (CNTs), carbon spheres (CSs), graphene, etc., have been reported.8–17 Among these, graphene is a very fascinating and mysterious material for the present century. It has many excellent properties, including high mechanical and electrical properties, high surface area and uniform pore distribution. Therefore, graphene can be used in various applications, such as fuel cells, biosensors, supercapacitors (SCs), drug delivery materials, polymer nanocomposites, etc.18–22 The carbon skeleton of plastic can be a good and inexpensive precursor material for the synthesis of graphene-based materials. In this regard, we have also successfully converted waste plastic through the pyrolysis technique for the bulk synthesis of high quality graphene, as previously reported elsewhere.23Energy storage is another active issue facing the entire scientific research community around the globe. SCs have provided a new impulse and attracted abundant attention due to their capability to fulfil the global energy demand based on their excellent energy storage capacity, high cycling stability and high power density with moderate energy density. SCs are essentially made up of an active material coated on two current collectors that are separated by a suitable electrolyte-soaked separator.24 In recent years, a great deal of research has been focused towards the development of suitable active materials for high-performing SCs. Therefore, a number of active materials, including porous activated carbon, different forms of carbon, conducting polymers, metal oxides, etc., have been used in SCs. At present, CNMs, especially graphene, are attracting a great deal of scientific attention as an active material for SC electrodes.25
Graphene nanosheets (GNs) synthesized from plastic waste using MMT as the catalyst and template have been reported previously elsewhere,26,27 and their utilization as an active material for SC applications on different types of current collectors in gel electrolyte have also been studied.27 Here, we report the supercapacitive performance of multilayer and ∼2 layer GNs prepared from waste plastics using either ZnO or montmorillonite (MMT) via pyrolysis. The cells fabricated from the ZnO-generated GNs (ZGNs) and MMT-generated GNs (MGNs) show specific capacitances of 72.8 F g−1 and 377.4 F g−1, respectively, in aqueous 1 M H3PO4 electrolyte.
2. Experimental part
2.1. Materials
Here, we used waste plastics as a precursor for the synthesis of GNs using ZnO and MMT as degradation catalysts and templates following our previously reported work.23,26,27 Other chemicals, such as acetone, nitric acid (HNO3), hydrochloric acid (HCl), phosphoric acid (H3PO4), and polyvinylidene fluoride (PVDF) polymer with a molecular weight of 534![[thin space (1/6-em)]](https://www.rsc.org/images/entities/char_2009.gif) 000 g mol−1 were purchased from Sigma Aldrich and used as received. The graphite sheets used as current collectors were purchased from the Madras Asbestos store.
000 g mol−1 were purchased from Sigma Aldrich and used as received. The graphite sheets used as current collectors were purchased from the Madras Asbestos store.
2.2. Synthesis of GNs using MMT and ZnO
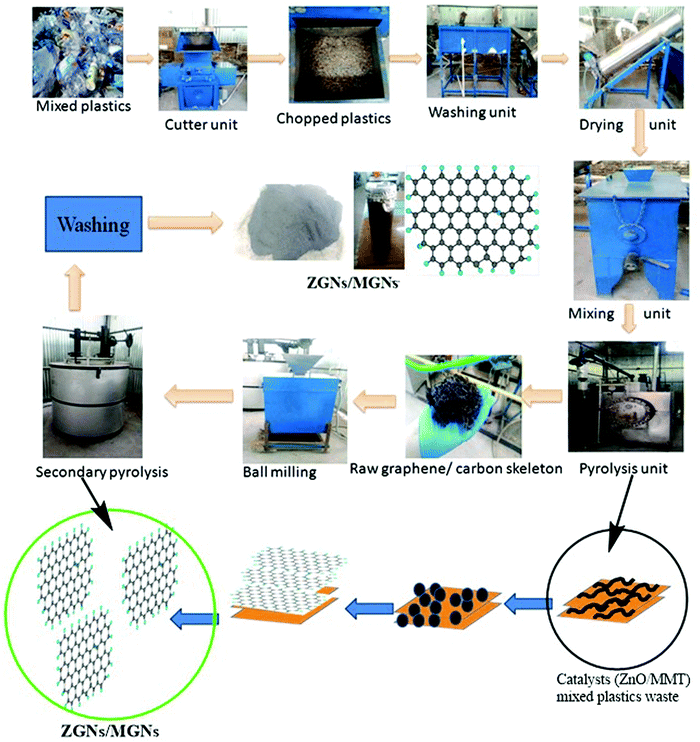
The GNs obtained from waste plastics using MMT (MGNs) were synthesized according to our previous work.27 Furthermore, the bulk production of GNs using ZnO as a catalyst and template (ZGNs) was almost the same as that for MMT. Briefly, for this purpose, 35 kg of plastic waste was chopped into fine pieces using a shredder, followed by washing with a soap solution and distilled water for the removal of unwanted impurities. Subsequently, the chopped plastic was dried in a dryer, and then mixed with the desired amount of ZnO (0.5 wt%) in a mixer unit.The shredded plastics mixed with ZnO were placed in a primary pyrolysis chamber for the primary stage pyrolysis at 400 °C for 2 h in an inert N2 atmosphere. We obtained a black carbonic charred residue, which was further placed into a secondary pyrolysis unit for high-temperature exfoliation of the carbonic material at 920 °C for 3 h in an inert N2 atmosphere (Fig. 1). Subsequently, the obtained black carbonic residue was crushed in a ball mill to make a powder, and then washed sequentially with 5% HCl, distilled water, ethanol, and distilled water. Finally, the ZGNs were dried overnight in an oven at 80 °C. The yield of MGNs was about ∼15%, while that of ZGNs was about ∼13%, with the rest forming liquid and gas fuels. The yield of the GNs from plastic waste may be attributed to the effect of the catalyst used for the present study. Accordingly, due to the high carbon content present within the plastic waste, the degradation products of the pyrolysed plastics act as the feedstock for the growth of the GNs. During pyrolysis, the degradation of the waste plastic into light hydrocarbon gases, liquid olefins with short and long chains, and small amounts of aromatics including mono-aromatics, di-aromatics and polycyclic aromatic hydrocarbons occurred; these are again degraded with the effect of temperature. The gaseous degraded products mainly consist of a mixture of light hydrocarbons such as methane, ethane, propane, ethylene, propylene, and isobutene, along with some percentage of hydrogen.28–31 These light hydrocarbons, especially methane and aromatics, are the main constituents responsible for the growth of the GNs. To promote the formation of these lightweight hydrocarbons and aromatics during the pyrolysis process, MMT clay acts as a degrading catalytic template, improving the formation of these light hydrocarbons and aromatics. This fact was also confirmed by GC-MS analysis in previous reports in the literature, in which the introduction of MMT clay within the plastic waste matrix enhanced the formation of hydrogen or methane 2- to 2.5-fold, while also enhancing the aromatic content 3- to 4-fold.32 Hence, by providing assistance for the formation of methane and other aromatics via the slow degradation of the plastics during pyrolysis, MMT clay provides a pathway and sufficient time for nucleation of the graphene skeleton. Therefore, MMT can generate ∼2 layer MGNs. Similarly, the use of transition metals and their oxides has also been reported for the faster production of methane during the catalytic degradation of plastics through the pyrolysis process.33,34 Therefore, ZnO promotes the faster production of methane and also helps in the thermal cracking of the methane for the nucleation of the GNs. However, due to the fast cracking process provided by ZnO, the formation of gaseous and liquid by-products increases, which in turn affects the yield and quality of the GNs. Therefore, the quality of the ZGNs was also found to be lower than that of the MGNs, and hence, multilayer ZGNs were obtained in the ZnO-catalyzed process.
2.3. Fabrication of cells
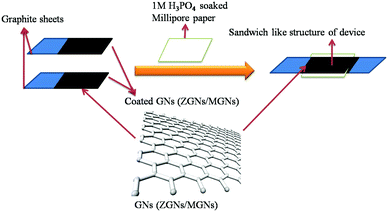
Cell fabrication was carried out using both the synthesized ZGNs and MGNs in 1 M H3PO4 electrolyte to fabricate Cell-1 and Cell-2, respectively, as presented in Table 1 and Fig. 2. Initially, we made a sticky paste of ZGNs or MGNs with 10 wt% of PVDF as a binder (in acetone) via uniform mixing with a mortar and pestle.| S. No. | Cell architecture |
|---|---|
| Cell-1 | GS | ZGNs | 1 M H3PO4 | ZGNs | GS |
| Cell-2 | GS | MGNs | 1 M H3PO4 | MGNs | GS |
The prepared GN paste was coated onto two symmetrical graphite sheets (1 cm × 1 cm) with a mass loading of ∼1 mg on each sheet and dried in an oven for 24 h. Thereafter, the two dried ZGN/MGN-coated electrodes were arranged in such a way as to form a sandwich-like structure separated by Millipore filter paper soaked in aqueous 1 M H3PO4 electrolyte, as presented in Fig. 2 and Table 1.
3. Characterization
3.1. Material characterization
We performed different characterization techniques for the identification and structural confirmation of the synthesized MGNs.27 The characterization of the prepared ZGNs was achieved with the help of the well-known Raman spectroscopy technique to analyze the vibrational properties of the synthesized materials using a HORIBA Japan Xplor Plus with an excitation beam length of 532 nm. To identify their internal and layer structure, the ZGNs were investigated under a JEOL-2100 transmission electron microscope (TEM) that was operated at an acceleration voltage of 200 kV. Field emission scanning electron microscope (FESEM) images were taken using a Nova NanoSEM 450 for the surface morphology and elemental analysis of the ZGNs. XRD was also performed for both the ZGNs and MGNs using a Rigaku Miniflex-II with Cu-K(alpha) radiation of wavelength k = 1.5418 Å. Furthermore, the software ImageJ was used for the evaluation of the surface morphologies and internal structure of the ZGNs and MGNs. Atomic force microscopy (AFM) of the GNs and MGNs was carried out using a Bruker Multimide 8 for measurement of their thickness and evaluation of the number of graphene sheets in scanasyst mode.3.2. Device characterization
The electrochemical performances of the fabricated SC cells were evaluated using an Electrochemical Workstation, CHI660E, CH Instruments, Inc. This electrochemical workstation was used to perform the cyclic voltammetry (CV), galvanostatic charge/discharge (GCD), and electrochemical impedance spectroscopy (EIS) tests, which are the most common and important tests for evaluating the performance of SCs.27,35,36CV is an important technique for evaluating the capacitance and cyclic behavior of SC cells over the operating voltage range. The cells showed curves with rectangular and nearly rectangular shapes over the operating voltage range of −1 V to 1 V at different scan rates. The specific capacitances of the cells were evaluated from the CV curves using eqn (1) below:
 | (1) |
The charge/discharge behaviors of the prepared SC cells were investigated over the potential range of 0 V to 1 V at different current densities in the galvanostatic condition. The specific capacitance was evaluated from the GCD curves using eqn (2) below:
 | (2) |
EIS was used for the investigation of the specific capacitance and equivalent series resistance (ESR) of the fabricated SC cells in the frequency range of 10 mHz to 106 Hz, which lies in between Z′ and Z′′, which are the real and imaginary parts of the impedance of the cells, respectively. The specific capacitance value was evaluated using eqn (3) below:
 | (3) |
Furthermore, some other important energy factors, namely, the energy density (W h kg−1) and power density (W kg−1), were calculated for the fabricated SCs cells using the expressions (4) and (5) below:
 | (4) |
 | (5) |
4. Results and discussion
4.1 Structural and morphological characteristics
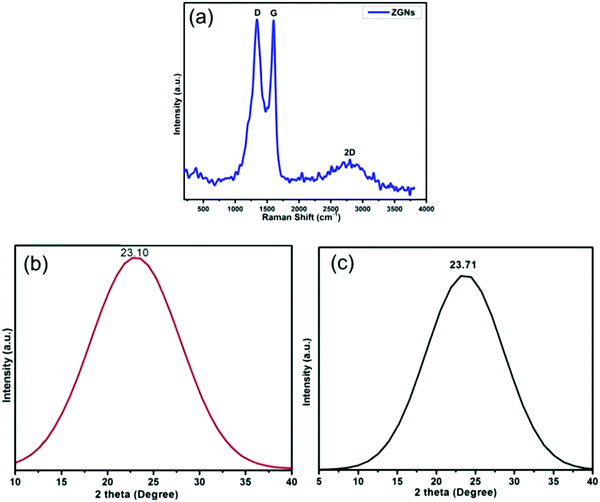
Fig. 3(a) shows the Raman spectrum of the ZGNs. This spectrum shows the characteristic peaks of graphene for the ZGNs at 1340 cm−1 and 1589 cm−1, which corresponded to the D and G bands, respectively. The D band, also called the deformation band, originates from the defect-induced breathing mode of the sp2 rings due to the presence of some oxygen functional groups. On the other hand, the G band is attributed to the first-order scattering of the E2g phonon of the sp2 C atoms of the ZGNs. Furthermore, the intensity ratio ID/IG shows the quality of and the defects present in the ZGNs. The ID/IG ratio of the ZGNs was 1.001, which is higher than that of graphite (0.403)37 and graphene oxide,38 indicating the generation of new graphitic domains for sp2 clusters with some defects in the ZGN sheets.39 This spectrum also exhibited one other peak at 2691 cm−1, which corresponded to the 2D band. The broad 2D band originated due to double resonance, and the intensity ratio I2D/IG of 0.97 indicated the presence of multilayer graphene layers in the ZGN sheets. On the other hand, the Raman spectra of reported MGNs showed an intensity ratio I2D/IG of 1.08, which is greater than that for the ZGNs; higher I2D/IG indicates greater purity and quality for graphene.27,39–43Fig. 3(b) and (c) show the XRD spectra of ZGNs and MGNs, respectively. The XRD spectra exhibited the characteristic border peaks of graphene at 2θ = 23.10° and 2θ = 23.71° for the ZGNs and MGNs, respectively. The interlayer spacing (d) for the ZGNs is 3.99 Å, and that of the MGNs is 3.75 Å; these were calculated from the Bragg equation44 and clearly indicated the formation of GNs.
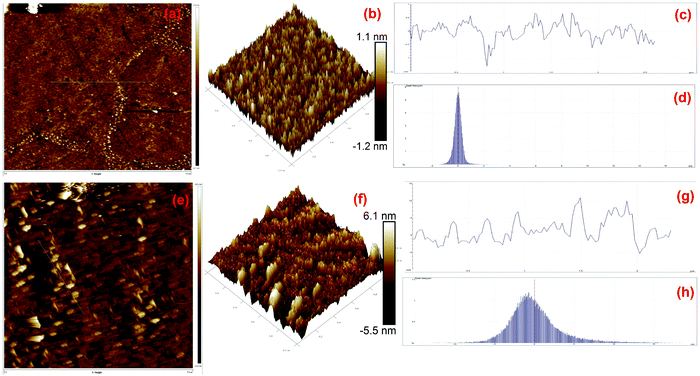
AFM is generally used for the identification of the thickness and roughness of single-layer to multilayer graphene. Here, the theoretical thickness of 0.69 nm for two-layer graphene and the 0.335 nm interlayer spacing of graphite were used as reference values to estimate the number of graphene layers.45,46Fig. 4 presents the AFM images, height profiles and tri-modal frequency distribution depth histograms of the MGNs and ZGNs. Fig. 4(a) and (b) show the 2D and 3D AFM surface images of the MGNs, respectively, which indicate the smoothness and uniform pore distribution of the GNs. Fig. 4(c) presents the height profiles from the AFM image of MGNs; the height was about ∼0.7 nm, which indicated the formation of ∼2 layers of GNs.46 On the other hand, the 2D and 3D AFM (Fig. 4(e) and (f)) surface images of the ZGNs showed a rough and disturbed pore distribution. Fig. 4(g) shows the height profiles of the AFM image of ZGNs; the height was about ∼10 nm, which indicates the formation of multilayer GNs.45 Additionally, the tri-modal frequency distribution depth histograms (Fig. 4(d) and (h)) of the MGNs and ZGNs exhibited good resemblance with the height profiles of their AFM images. The AFM results showed good agreement with the Raman and TEM analysis. It is well known that the surface properties and number of layers of GNs greatly affect the performance of SCs. Single-layer to few-layer graphene provides low-resistance pathways and short ion diffusion channels that enhance the performance of SCs.47–49 Therefore, the MGN-based SC cell showed higher supercapacitive performance than the ZGN-based SC cell.
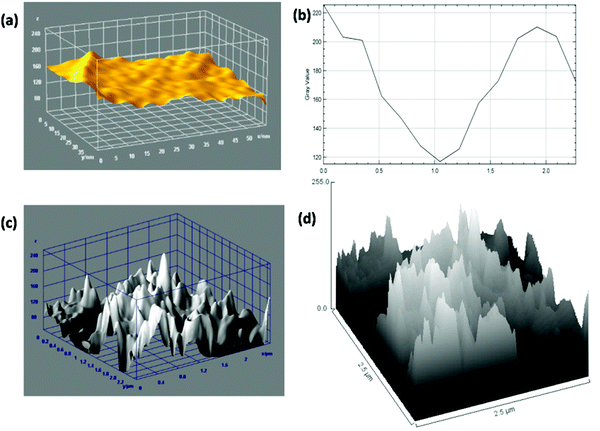
Fig. 5(a) and (b) present the 3D surface plot and plot profile from the previously reported TEM images of MGNs for comparison.27 These images show the presence of 2–3 layers within the MGNs. The 3D surface morphology of the MGNs clearly showed corrugated edges with reduced grain boundaries; because of these features, the MGNs showed good capacitive behavior for supercapacitor applications.50 As the capacitive behavior of carbon-based materials also depends on the surface roughness and number of defects present within the carbonaceous material, surface roughness analysis was also carried out.
Fig. 5(c) and (d) exhibit the Hill stack view and 3D surface topology from the previously reported SEM images of the MGNs27 and are used here for comparison only. The 3D surface topology and Hill stack view from the SEM image of the MGNs shows the presence of uneven hills of graphene layers with curly edges and sharp spikes within the MGNs, which enhanced the defect densities within the MGN layers and hence developed a metallic nature within the MGNs, as reported in our previous studies.23,34,50
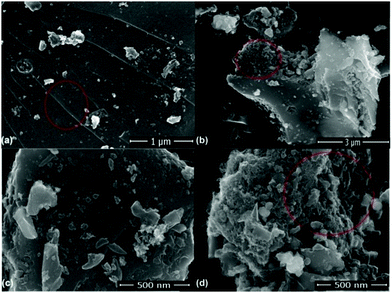
Fig. 6(a)–(d) present the FESEM images of the ZGNs. Fig. 6(a) shows the clear and distinctive surface morphology of the ZGNs at a magnification scale of 1 μm. This image exhibits various lines, which are interconnected stacks of graphene layers; this indicates the multilayer structure of the ZGNs. Fig. 6(b) and (d) present the side view of the ZGNs, and clearly show some porous-type structures, which may be helpful for the insertion of electrolyte ions, which is greatly responsible for the capacitance behavior of the ZGN-based cells. Fig. 6(c) demonstrates the surface morphology of the ZGNs at a magnification of 500 nm. Stacks of ZGNs with side edge defects, grain boundaries, and random clusters of graphene layers with wrinkles at the surfaces can be seen on the surface of the ZGNs.
Fig. 7(a) shows the FESEM image of the ZGNs taken for the evaluation of the Hill stack plot and surface morphology using the software ImageJ. Fig. 7(b) and (c) present the Hill stack plot and 3D surface morphology of the FESEM images of the ZGNs. The Hill stack plot and 3D surface morphology clearly show lower surface roughness and defect densities compared to that of the MGNs, because of which greater crystalline behavior was found for the ZGNs than for the MGNs. Hence, the MGNs should exhibit higher capacitive behavior than the ZGNs. In order to prove this, we fabricated SC cells based on the MGNs and ZGNs as the active materials, and the results for the cells showed good agreement with this concept.
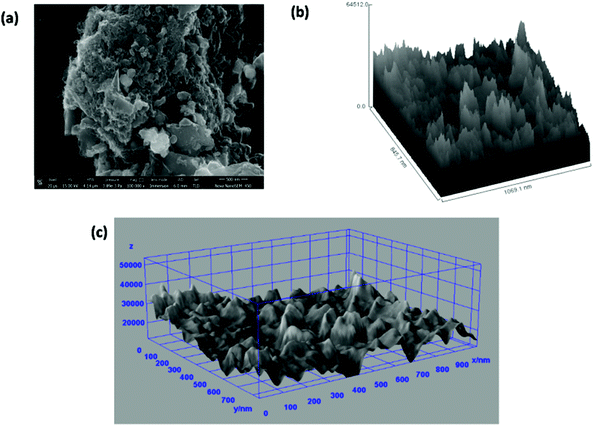 | ||
| Fig. 7 (a) FESEM image of ZGNs. (b) Hill stack plot of the ZGNs @500 nm. (c) 3D surface morphology from the FESEM images. | ||
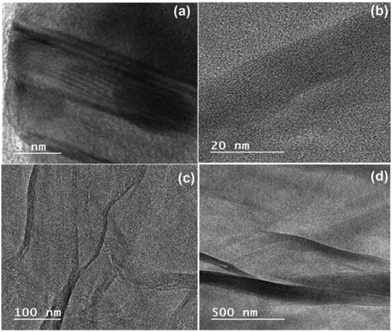
Fig. 8 presents the TEM images of ZGNs, which were obtained to investigate the internal morphology and structure of the ZGNs. Fig. 8(a) presents the TEM image of the ZGNs at a magnification of 5 nm, which clearly depicts the presence of multilayer ZGNs with the presence of the edge defects. Furthermore, the ZGNs also exhibited grain boundaries with a crumpled morphology, as depicted in Fig. 8(b). The presence of curved and crumpled morphology can be clearly visualized in Fig. 8(c), in which the layers of the ZGNs are visualized at a magnification of 100 nm. The crumpled morphology of the ZGNs showed a smoother surface, and the layer stacks of the ZGNs could also be visualized, as shown in Fig. 8(d). Because of the multilayer morphology of the ZGNs, the capacitive property of the ZGNs resulted in average performance in the SC cell.
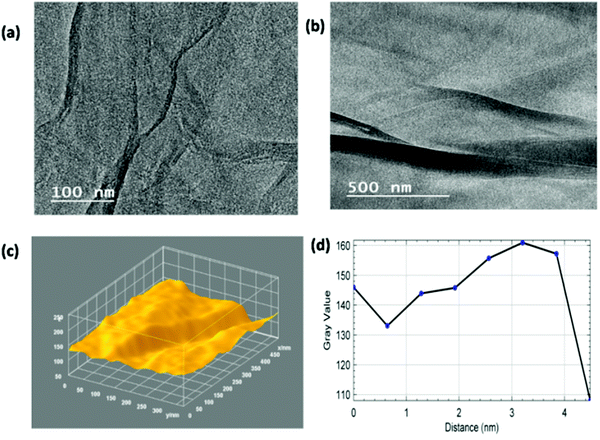
Fig. 9(a) and (b) present the TEM images of the ZGNs at magnifications of 100 nm and 500 nm, which were taken for the evaluation of the 3D surface morphology and plot profile diagram. The TEM images of the ZGNs also showed corrugated edges, like those shown by the MGNs; however, the grain boundaries were found to be higher in the ZGNs than in the MGNs. Fig. 9(c) provides a clear view of the grain boundaries present within the ZGNs. Furthermore, the ZGNs also showed the presence of multiple layers in the GNs, and the number of layers was found to be higher than that in the MGNs.27
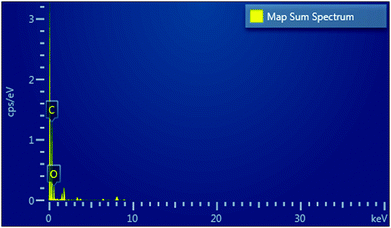
Further, EDX was also performed for the quantitative analysis of the elements present in the ZGNs; the results are exhibited in the map sum spectrum in Fig. 10. The EDX spectra showed that the ZGNs were composed of carbon, which was present in hexagonal form, and oxygen, which was present in the form of oxidative groups in the ZGNs. In addition, Table 2 shows the percentages of carbon (84.97 wt%) and oxygen (15.03 wt%) present in the ZGNs.
| Element | Absorption correction | Wt% | Wt% sigma |
|---|---|---|---|
| C | 1.00 | 84.97 | 0.82 |
| O | 1.00 | 15.03 | 0.82 |
| Total | 100.00 |
4.2 Device performance
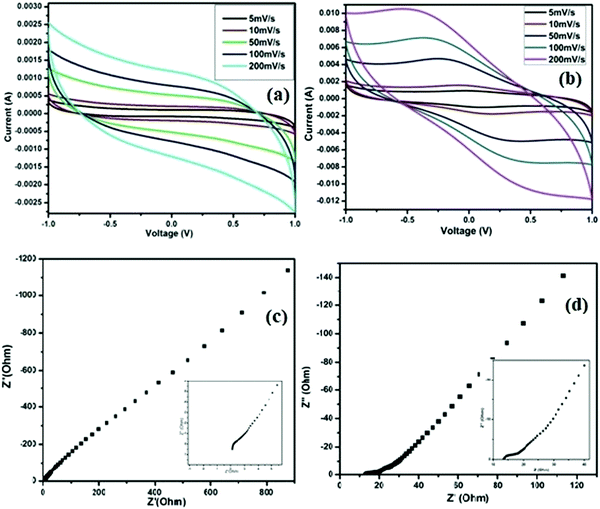
The electrochemical performances of the SC cells fabricated using the ZGNs and MGNs (Cell-1 & Cell-2) are listed in Table 1. CV plots of the fabricated Cell 1 and Cell 2 were recorded in the voltage range of −1 V to +1 V at different scan rates (5 mV s−1, 10 mV s−1, 50 mV s−1, 100 mV s−1, and 200 mV s−1), as shown in Fig. 11(a) and (b).The CV curves of Cell-1 show an almost-rectangular shape and nearly mirror-image symmetry in terms of the current response about the zero current line at all scan rates. This clearly indicated the capacitive behavior of Cell-1, which also exhibited the formation of a double layer at the electrode–electrolyte interface. Cell-2 exhibits nearly rectangular-shaped curves at lower scan rates and quasi-rectangular CV curves at higher scan rates. The CVs of both show typical EDLC-type behavior with high rate capability and low internal resistance over the tested voltage range.51 Furthermore, the specific capacitances for Cell-1 and Cell-2 were calculated using eqn (1) and found to be 72.8 F g−1 and 377.4 F g−1, respectively, at the lowest current rate, i.e., 5 mV s−1. At a high scan rate of 200 mV s−1, we found gradual loss of specific capacitance for both cells (Table 3) because the delayed penetration of ions inside the pores produces lower charge and lower capacitance values.
| Cell | C s (F g−1) | ||||
|---|---|---|---|---|---|
| 5 mV s−1 | 10 mV s−1 | 50 mV s−1 | 100 mV s−1 | 200 mV s−1 | |
| Cell-1 | 72.8 | 40.9 | 21.1 | 15.9 | 12.1 |
| Cell-2 | 377.4 | 314.0 | 148.2 | 98.9 | 62.7 |
Nyquist plots of EIS spectra are a universally used technique for identifying the frequency-dependent behavior and supercapacitive characteristics of fabricated cells. The impedance spectra of fabricated cells were recorded over a frequency range of 10 mHz to 106 Hz and are shown in Fig. 11(c) and (d), respectively, for Cell-1 and Cell-2. The impedance responses of the cells show a sharp rising action and are parallel to the imaginary impedance axis for both cells in the low-frequency region up to 10 mHz. In these spectra, Cell-2 shows a sharper rising action parallel to the imaginary impedance axis. Also, the behavior of both cells in the lower-frequency region indicated the formation of a double layer at the interface of the electrode and electrolyte. In addition, both spectra showed bulk resistance in the higher-frequency range or left side of the spectra due to the electrolytes and the contact resistance that evolved between the graphite sheets and ZGNs/MGNs. As a result, the ESR for Cell-1 is 2.1 Ohm cm−2, and that of Cell-2 was 13.5 Ohm cm−2, which indicated faster charging and discharging in Cell-1 as compared to Cell-2. Furthermore, the specific capacitance value calculated for Cell-2 was 224.4 F g−1, compared to 28.4 F g−1 for Cell-1 (Table 4); these values were evaluated using eqn (2).
| Cells | Cs (F g−1) | Cs (F g−1) |
|---|---|---|
| EIS | GCD at 1 A/g | |
| Cell-1 | 28.44 | 11.25 |
| Cell-2 | 224.46 | 152.04 |
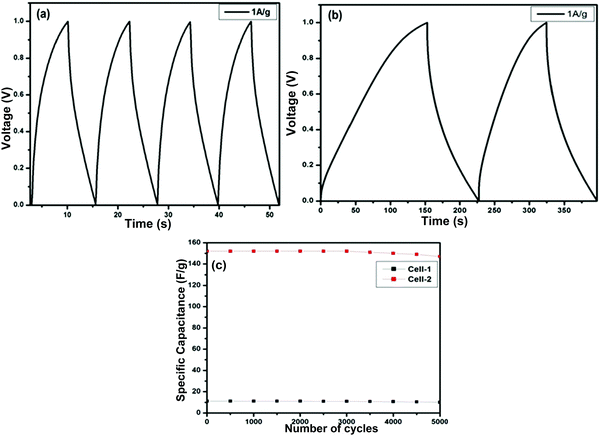
Fig. 12(a) and (b) present the GCD curves of the ZGN-/MGN-based cells, i.e., Cell-1 and Cell-2. The figures show the discharge phenomena characteristics of the SCs at each operating current density. Both cells show nearly triangular-type curves, which is the basic feature of EDLC-type behavior. Furthermore, the specific capacitance values calculated from the GCD, i.e., the charge–discharge curve, using eqn (3) are 11.2 F g−1 and 152.0 F g−1 at a current density of 1 A g−1 for Cell-1 and Cell-2, respectively. In addition, the specific capacitances for both cells at the higher current densities are shown in Table 4. The specific capacitance of the MGNs on a graphite sheet as a current collector in polymer gel electrolyte (PGE) was determined to be 7.8 F g−1, 10.5 F g−1, and 2.8 F g−1 using CV, EIS and GCD, respectively, in our previous work.27 These values are relatively very small compared with those of Cell 1 and Cell 2 prepared in the present study. This effect was shown by the previously reported cells because of the PGE. Generally, PGE shows lower conductivity and low ion transport because the ions are immobilized in the polymer matrix, which restricts their mobility. Therefore, the ions are not easily accessible at the electrode surface; this fact is responsible for the lower specific capacitance of the cell. In the present case, we have used aqueous electrolyte, which generally shows higher conductivity and faster ion transport compared to PGE; therefore, the electrolyte ions are accessible to the electrode surface, which is directly responsible for the higher specific capacitance.35,52
Furthermore, the energy and power density were also calculated for the fabricated cells using eqn (4) and (5), respectively, and are shown in Table 5. It is clearly seen from this table that the use of different catalysts and templates in the synthesis of the GNs derived from waste plastic plays a significant role in enhancing their energy storage application, with energy densities of ∼1.6 W h kg−1 using ZGNs and ∼21 W h kg−1 using MGNs as the active electrode material; both materials provided almost the same power density of ∼1010 W kg−1.
| Characteristic | Cell-1 | Cell-2 |
|---|---|---|
| Energy density (Ed) (W h kg−1) | 1.5 | 21.1 |
| Power density (Pd) (W kg−1) | 1009.5 | 1010.0 |
Furthermore, cyclic stability is another important factor for the practical application of SCs. To determine the stability of both cells, we performed sequential GCD measurements for 5000 cycles at a current density of 1 A g−1 for Cell-1 and Cell-2 (Fig. 12(c)). The cyclic stability results show 89% retention of the specific capacitance for Cell-1 after 5000 charge– discharge cycles. On the other hand, Cell-2 retained 96% of its initial capacitance after 5000 charge–discharge cycles.
5. Conclusion
As shown by our results, we are targeting a booster step to resolve the environmental and energy storage problems simultaneously. Plastic waste is a serious concern associated with the modern lifestyle due to the extensive use of plastic materials in daily life. Plastic waste creates very serious problems for the environment by occupying large volumes of land, bodies of water, etc. This work will open a new channel for the management of waste plastic and its conversion to useful value-added products and their future applications. Here, we successfully converted waste plastic into multilayer ZGNs and 1–2 layer MGNs and showed their potential towards supercapacitor applications. Our study showed the superiority of MMT over ZnO as a catalyst for the conversion of waste plastic into GNs because of the more pure and appropriate surface morphologies of the resulting GNs. Thus, we can conclude that MMT-based GNs show higher electrochemical behavior performance compared to the ZnO-based GNs because of the good quality of the GNs and their better surface morphology. The synthesized ZGN- and MGN-based cells exhibited excellent specific capacitances of 72.88 F g−1 and 377.4 F g−1 in aqueous 1 M H3PO4 electrolyte, respectively. Thus, the present study showed that the up-cycling of plastic waste into GNs using low-cost catalytic templates can be used for the conservation of sustainable energy, with both economic and ecological benefits.Conflicts of interest
The authors are declaring that there is no conflict of interests.Acknowledgements
The authors are highly thankful to the National Mission on Himalayan Studies (NMHS), Almora, India [Ref No.-GBPNI/NMHS-2019-20/MG] and DST-INSPIRE (Ref. No. – IF180347) for their financial assistance. The authors from Kurukshetra University are thankful to the DST-SERB [Ref No. EMEQ-824/2014], New Delhi.References
- J. Parra, C. Ania, A. Arenillas, F. Rubiera, J. Palacios and J. Pis, Bol. Soc. Esp. Ceram., 2004, 43, 547–549 CrossRef CAS.
- P. Pirotto, WWF Report 2019 on plastic waste pollution: critical issues and action plan, https://www.geoplastglobal.com/en/insights/wwf-report-2019-on-plastic-waste-pollution-critical-issues-and-action-plan/, accessed 27 May 2019, 2019.
- L. Ahmad, Plastic Recycling, http://www.lotfi.net/recycle/plastic.html.
- P. S. Kumar, M. Bharathikumar, C. Prabhakaran, S. Vijayan and K. Ramakrishnan, Int. J. Energy Environ. Eng., 2017, 8, 167–173 CrossRef.
- S. Budsaereechai, A. J. Hunt and Y. Ngernyen, RSC Adv., 2019, 9, 5844–5857 RSC.
- Z. Z. Ismail and E. A. Al-Hashmi, Waste Manage., 2008, 28, 2041–2047 CrossRef CAS PubMed.
- J. Kwabena, V. Berko-Boateng and T. Ama, Case Study Constr. Mater., 2017, 6, 1–7 Search PubMed.
- C. Wu, Z. Wang, L. Wang, P. T. Williams and J. Huang, RSC Adv., 2012, 2, 4045–4047 RSC.
- C. Wu, M. A. Nahil, N. Miskolczi, J. Huang and P. T. Williams and technology, J. Environ. Sci., 2014, 48, 819–826 CrossRef CAS PubMed.
- J. Gong, B. Michalkiewicz, X. Chen, E. Mijowska, J. Liu, Z. Jiang, X. Wen and T. Tang, ACS Sustainable Chem. Eng., 2014, 2, 2837–2844 CrossRef CAS.
- C. Zhuo, B. Hall, H. Richter and Y. Levendis, Carbon, 2010, 48, 4024–4034 CrossRef CAS.
- J. O. Alves, C. Zhuo, Y. A. Levendis and J. A. Tenório, J. Appl. Catal., B: Environmental, 2011, 106, 433–444 CrossRef CAS.
- J. C. Acomb, C. Wu and P. T. Williams, Appl. Catal., B, 2016, 180, 497–510 CrossRef CAS.
- J. Gong, J. Liu, Z. Jiang, X. Wen, X. Chen, E. Mijowska, Y. Wang and T. Tang, Chem. Eng. J., 2013, 225, 798–808 CrossRef CAS.
- J. Gong, J. Liu, X. Wen, Z. Jiang, X. Chen, E. Mijowska and T. Tang, Ind. Eng. Chem. Res., 2014, 53, 4173–4181 CrossRef CAS.
- Z. Jiang, R. Song, W. Bi, J. Lu and T. Tang, Carbon, 2007, 45, 449–458 CrossRef CAS.
- R. Song, B. Li, S. Zhao and L. Li, J. Appl. Polym. Sci., 2009, 112, 3423–3428 CrossRef CAS.
- J. T. Choi, T. D. Dao, K. M. Oh, H.-I. Lee, H. M. Jeong and B. K. Kim, Smart Mater. Struct., 2012, 21, 075017 CrossRef.
- V. D. Punetha, S. Rana, H. J. Yoo, A. Chaurasia, J. T. McLeskey Jr, M. S. Ramasamy, N. G. Sahoo and J. W. Cho, Prog. Polym. Sci., 2017, 67, 1–47 CrossRef CAS.
- C. Liu, Z. Yu, D. Neff, A. Zhamu and B. Z. Jang, Nano Lett., 2010, 10, 4863–4868 CrossRef CAS PubMed.
- H.-J. Choi, S.-M. Jung, J.-M. Seo, D. W. Chang, L. Dai and J.-B. Baek, Nano Energy, 2012, 1, 534–551 CrossRef CAS.
- S. Afsahi, M. B. Lerner, J. M. Goldstein, J. Lee, X. Tang, D. A. Bagarozzi Jr, D. Pan, L. Locascio, A. Walker, F. Barron and B. R. Goldsmith, Biosens. Bioelectron., 2018, 100, 85–88 CrossRef CAS PubMed.
- S. Pandey, M. Karakoti, S. Dhali, N. Karki, B. SanthiBhushan, C. Tewari, S. Rana, A. Srivastava, A. B. Melkani and N. G. Sahoo, Waste Manage., 2019, 88, 48–55 CrossRef CAS PubMed.
- F. Maher, S. Veronica, D. Sergey and B. Richard, Science, 2012, 335, 1326–1330 CrossRef PubMed.
- Z. Peng, J. Lin, R. Ye, E. Samuel and J. Tour, ACS Appl. Mater. Interfaces, 2015, 7, 3414–3419 CrossRef CAS PubMed.
- N. G. Sahoo, Sandeep, M. Karakoti and V. D. Punetha, India Pat., 352780, 2016 Search PubMed.
- M. Karakoti, S. Pandey, R. Jangra, P. S. Dhapola, P. K. Singh, S. Mahendia, A. Abbas and N. G. Sahoo, Mater. Manuf. Processes, 2021, 36, 171–177 CrossRef CAS.
- Y. S. Kim, J. H. Lee, Y. D. Kim, S. K. Jerng, K. Joo, E. Kim, J. Jung, E. Yoon, Y. D. Park, S. Seo and S. Chun, Nanoscale, 2013, 5, 1221–1226 RSC.
- X. F. Zhang, J. Ning, X. L. Li, B. Wang, L. Hao, M. H. Liang, M. H. Jin and L. J. Zhi, Nanoscale, 2013, 5, 8363–8366 RSC.
- J. Gong, J. Liu, Z. W. Jiang, X. Wen, X. C. Chen, E. Mijowska, Y. H. Wang and T. Tang, Chem. Eng. J., 2013, 225, 798–808 CrossRef CAS.
- J. Gong, J. Liu, D. Wan, X. C. Chen, X. Wen, E. Mijowska, Z. W. Jiang, Y. H. Wang and T. Tang, Appl. Catal., A, 2012, 449, 112–120 CrossRef CAS.
- G. Jiang, J. Liu, X. Wen, Z. Jiang, X. Chen, E. Mijowska and T. Tang, Ind. Eng. Chem. Res., 2014, 53, 4173–4181 CrossRef.
- J. I. Villacampa, C. Royo, E. Romeo, J. A. Montoya, P. Del Angel and A. Monzon, Appl. Catal., A, 2003, 252(2), 363–383 CrossRef CAS.
- S. Pandey, A. Kumar, M. Karakoti, K. K. Garg, A. Rana, G. Tatrari, B. S. Bohra, P. K. Yadav, R. K. Singh and N. G. Sahoo, Nanoscale Adv., 2021, 3, 4726–4738 RSC.
- M. Karakoti, R. Jangra, S. Pandey, P. S. Dhapola, S. Dhali, S. Mahendia, P. K. Singh and N. G. Sahoo, High Perform. Polym., 2020, 32, 175–182 CrossRef CAS.
- G. Pandey and A. Rastogi, MRS Online Proceedings Library, 2012, 1440, 25–30 Search PubMed.
- L. Kou, H. He and C. Gao, Nano-Micro Lett., 2010, 2, 177–183 CrossRef CAS.
- F. W. Low, C. W. Lai and S. B. Abd Hamid, Ceram. Int., 2015, 41, 5798–5806 CrossRef CAS.
- D.-G. Thomas, E. Kavak, N. Hashemi, R. Montazami and N. N. Hashemi, J. Carbon Res., 2018, 4, 42 CrossRef.
- R. P. Antony, L. Preethi, B. Gupta, T. Mathews, S. Dash and A. Tyagi, Mater. Res. Bull., 2015, 70, 60–67 CrossRef CAS.
- F. T. Johra, J.-W. Lee and W.-G. Jung, J. Ind. Eng. Chem., 2014, 20, 2883–2887 CrossRef CAS.
- Z. Tu, Z. Liu, Y. Li, F. Yang, L. Zhang, Z. Zhao, C. Xu, S. Wu, H. Liu and H. Yang, Carbon, 2014, 73, 252–258 CrossRef CAS.
- C. Lou, S. Wang, T. Liang, C. Pang, L. Huang, M. Run and X. Liu, Mater. Res. Soc. Symp. Proc., 2017, 10, 1068 Search PubMed.
- J. Aladekomo and R. Bragg, Carbon, 1990, 28, 897–906 CrossRef CAS.
- Z. Lin, P. Karthik, M. Hada, T. Nishikawa and Y. Hayashi, Nanomaterials, 2017, 7(6), 125 CrossRef PubMed.
- Z. Shen, J. Li, M. Yi, X. Zhang and S. Ma, Nanotechnology, 2011, 22(36), 365306 CrossRef PubMed.
- T. Purkait, G. Singh and M. Singh, Sci. Rep., 2017, 7, 15239 CrossRef PubMed.
- M. J. Allen, V. C. Tung and R. B. Kaner, Chem. Rev., 2010, 110, 132–145 CrossRef CAS PubMed.
- Y. Gogotsi, Nature, 2014, 509, 568–570 CrossRef CAS PubMed.
- S. Pandey, M. Karakoti, K. Surana, P. S. Dhapola, B. SanthiBhushan, S. Ganguly, P. K. Singh, A. Abbas, A. Srivastava and N. G. Sahoo, Sci. Rep., 2021, 11, 1–17 CrossRef PubMed.
- Y. Zhou, P. Jin, Y. Zhou and Y. Zhu, Sci. Rep., 2018, 8, 1–7 Search PubMed.
- B. Pal, S. Yang, S. Ramesh, V. Thangadurai and R. J. N. A. Jose, Nanoscale Adv., 2019, 1, 3807–3835 RSC.
| This journal is © The Royal Society of Chemistry 2022 |

