 Open Access Article
Agile reversible shape-morphing of particle rafts†
Kyungmin
Son
 a,
Jeong-Yun
Sun
 *bc and
Ho-Young
Kim
 *a
*a
aDepartment of Mechanical Engineering, Seoul National University, Seoul 08826, Korea. E-mail: hyk@snu.ac.kr
bDepartment of Materials Science and Engineering, Seoul National University, Seoul 08826, Korea. E-mail: jysun@snu.ac.kr
cResearch Institute of Advanced Materials (RIAM), Seoul National University, Seoul 08826, Korea
First published on 12th July 2021
Abstract
Materials that transform shapes responding to external stimuli can bring unprecedented innovations to soft matter physics, soft robotics, wearable electronics, and architecture. As most conventional soft actuation technologies induce large deformations only in a preprogrammed manner at designated locations, the material systems capable of agile reversible deformations without prescribed patterns are strongly desired for versatile mechanical morphing systems. Here we report a morphable liquid interface coated with dielectric particles, or a particle raft, which can reversibly change its topography under an external electric field. The rafts change from flat floors to towers within seconds, and the morphed structures are even capable of horizontal translation. Our experiments and theory show that the raft deformation is driven by electrostatic attraction between particles and electrodes, while being modulated by electric discharge. A broad range of materials serving as electrodes, e.g., human fingers and transparent polymers, suggests this system's diverse applications, including the human–machine interface and the three-dimensional physical display.
Introduction
Shape-morphing structures, aimed to provide enhanced dynamic functionality to robotics,1–3 flexible electronics,4–6 biomedicine,7,8 and smart architecture,9,10 have employed either highly stretchable materials or geometrical modifications of surfaces (e.g., folds and cuts). Stimulus-responsive soft materials – such as elastomers11–15 and hydrogels16–21 – can undergo a great degree of volume change, which can lead to a transformation of structures embedding those materials. Origami22–26 and kirigami,27–29 respectively, employing folds and cuts of surfaces, can convert two-dimensional objects into three-dimensional structures. However, the deformation patterns and locations should be prescribed in these schemes, implying that the structures are set to be transformed only into a designated shape. Although ferrofluids can undergo large deformations without prescribed patterns in response to an external magnetic field,30–32 it is nearly impossible to achieve localized stable shape equilibrium due to the Rosensweig instability33 and interfacial instabilities induced by magnetic attraction.34,35 Therefore, a material system capable of elaborate but stable large deformation without prescribed patterns is strongly called for to enhance the versatility of morphing systems.A promising material system capable of such dramatic shape change is a liquid interface coated with particles, which behaves as a two-dimensional solid with superior deformability. The elasticity of this composite interface is owing to capillary forces providing inter-particle cohesion,36 and its fluidity comes from the underlying liquid. Depending on whether particles cover the free surface of a liquid pool or a liquid drop, the interfacial system is called a particle raft36 or a liquid marble.37 Particle rafts can buckle and wrinkle under compressive stress,36 fracture when in contact with surfactants,38 and encapsulate overlying fluids upon sinking.39 Liquid marbles can be divided,40 merged,41 and deformed into different shapes under static and dynamic loadings.37 However, no attempts have been made yet to achieve controllable and reversible shape-morphing of these particle-coated interfaces.
Here, we explore the deformability of the particle raft to give rise to dramatic interfacial deformations of extraordinary accuracy, speed, and controllability without prescribed patterns, which has been impossible with conventional liquid–gas or solid–fluid interfaces. Utilizing an electric field, we experimentally show that the particle raft can be locally upheaved to a tall mound, pulled to a tower, and translated horizontally. We theoretically explain the physical principles behind the morphing behaviors, which are essential for the precise control of the raft deformations. As a broad range of materials can serve as electrodes, our shape-morphing technology can find versatile applications, including in three-dimensional human–machine interfaces.
Experimental
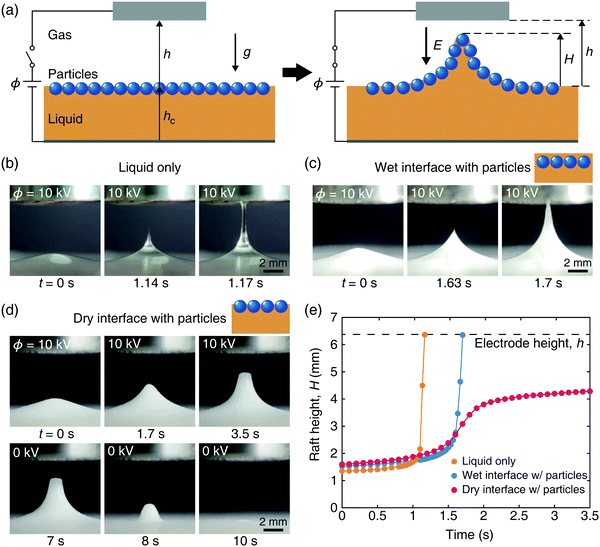
The particle raft consists of hollow glass spheres (Cospheric HGMS-0.09) densely covering a 5 mm thick film of castor oil (Sigma-Aldrich 83912). Glass particles are sprinkled over the oil film until they completely fill the interface, and the excess particles on the particle raft are removed using a gentle wind. The mean diameter and density of glass spheres are 108 μm (standard deviation of 9.2 μm) and 90 kg m−3, respectively, and the exterior surface of the particles are smooth with a surface roughness less than 2 μm. The castor oil has a density of 960 kg m−3, a relative permittivity of 4.7, and an electric conductivity of 45 pS m−1. It has a high polarity being composed of approximately 90% of an unsaturated hydroxyl 18-carbon fatty acid. Its contact angle with borosilicate glass and soda-lime glass was measured to be 35° and 37°, respectively, which are significantly higher than the contact angle of silicone oil with glass (9° to 10°). Therefore, glass particles gently scattered on the castor oil float on the air–oil interface without being completely wet while those on the silicone oil are completely wet even without forced immersion, as schematically compared in Fig. 1(c) and (d). The liquid film sits on a grounded stainless-steel plate, and a 10 mm diameter circular stainless steel disk electrode is located above the liquid–air interface.As a means of controlled stimulation to the soft interface, we employed an electric field through the experimental setup shown in Fig. 1(a). The electric potential difference, ϕ, was applied between the bottom ground plate and a metallic disk above the liquid. The electrostatic force per volume, f, acting on dielectric media is caused by free charges in the media, ρeE, and dipole force due to an abrupt jump in polarizability,42E2∇ε/2, where ρe is the volume density of free charge, E is the electric field with a magnitude of E, and ε is the permittivity of the medium. Because none of the leaky dielectric liquid (castor oil) and dielectric particles (hollow glass microspheres) employed in our experiments have a free charge (ρe = 0) except at surfaces, the force acting on either the particle raft or the uncoated oil comes only from the interface where the permittivity changes (∇ε ≠ 0) and thus surface charges can build up. We note that, although interfacial deformation by electrodipping force is observed at the nonpolar fluid and water interface,43,44 the dipole field effect is negligible at the air–castor oil interface due to the small difference in permittivity.
Results and discussion
Electrostatically induced deformation of interfaces
A static interface of a leaky dielectric oil slightly bulges under a weak electric field thanks to the charge accumulated at the air–oil interface as shown in Fig. 1(b) (t = 0 s).45 The short hump is destabilized upon the electric field exceeding a critical value. It is attributed to a quick surface charge build-up by charge convection in the leaky dielectric liquid. The electric field thus formed generates a strong electric shear force tangential to the tilted interface that exceeds the stabilizing forces of gravity and surface tension, accelerating the liquid toward the electrode to form a jet (Fig. 1(b), t > 0).46 When dielectric particles covering the liquid interface are completely wetted due to forced immersion, the composite interface is also destabilized under a high electric field to generate a jet, as shown in Fig. 1(c). It is because the liquid layer still covering the entire surface including particles allows surface charge transfer that generates electric shear stress.On the contrary, a raft of dry dielectric particles floating on the leaky dielectric liquid does not exhibit such instability under a high electric field. Rather, the particle raft reaches a static equilibrium as shown in Fig. 1(d) (t = 3.5 s). Because surface charge convection does not occur along the insulating particles at the interface, the electric shear stress generated is relatively small. In addition, the layer of particles can support the anisotropic shear stress,36 which consequently suppresses shear stress driven flow (see Appendix B, Fig. 9 for particle packing on the raft). Thus, the particle raft behaves like a perfectly insulating medium where the deformation is only driven by electric normal stresses caused by the polarization of the medium. The temporal evolution of the peak height of the three interfaces in Fig. 1(b)–(d), measured after the electric potential ϕ reaches 10 kV, is plotted in Fig. 1(e). Although the humps rise initially toward the electrode at similar rates regardless of the interface types, only the raft of partially wetted particles reaches a steady height, uncovering the remarkable capability of the electrostatic scheme to induce agile but stable shape morphing. Fig. 1(d) (t > 7 s) also shows that the raft returns to the original flat floor when the electric potential is removed, revealing the reversibility of the deformation. This corresponds to the most fundamental raft morphing mode, i.e. upheaving (see Movie S1, ESI†).
The steady raft height under constant electric potential and electrode height implies the balance of the forces acting on the raft. However, this balance contradicts the conventional understanding of the movement of a dielectric medium between capacitor plates. As a liquid of a higher permittivity occupies a larger portion between the electrodes, the capacitor's increased charge due to the increased polarization density strengthens the electric field. The resulting increase in the force acting on the medium should accelerate the interface to displace the less polarizable medium and touch the initially distant electrode, as was observed in Fig. 1(b) and (c), and reported for polymer–air interfaces47 in a similar setting.
Analysis of upheaving particle raft
Our particle raft with a dry interface experiences a similar initial bulging process to that of a polarizable medium in the capacitor. However, when the electric field between the particles and the electrode exceeds the dielectric strength of air, electric discharge takes place. Ions are drifted from the electrode to the surface of insulating glass particles, thereby offsetting the opposite charges originating from polarization. Thus, the electric field is reduced in the air gap, allowing the weakened electrostatic force to be balanced with the gravitational and capillary forces resisting the raft deformation. The process leading to force equilibrium of an upheaved raft is illustrated in Fig. 2(a). The electric discharge was evidenced by the electric current through the air gap, which was measured via a current meter (Keithley 2450, Tektronix) connected to the bottom electrode. As shown in Fig. 2(b), the current rose abruptly from approximately 0.2 to 2 nA when the bulging raft approached the top electrode. We note that if a conductive, instead of leaky dielectric, liquid is used, much stronger discharge occurs, which destabilizes the electric field and thus prevents stable transformation of the raft into a mound.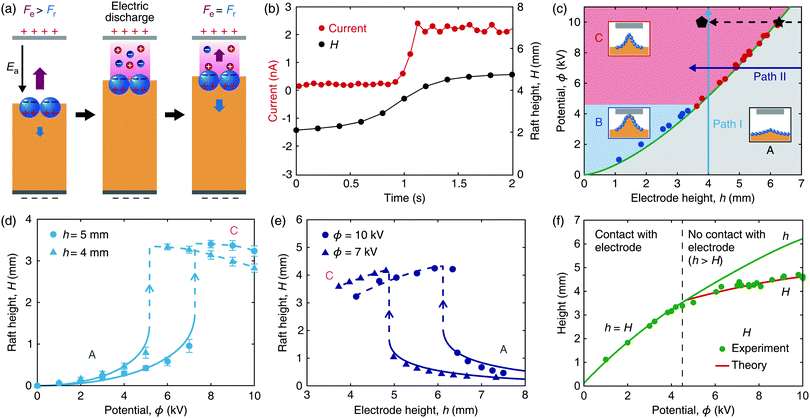 | ||
| Fig. 2 Mechanism of electro-morphing of the particle raft. (a) Equilibration of forces on the particle raft. When the raft approaches the electrode, electric discharge takes place, and consequently the electrostatic force Fe (purple arrow) decreases to be equal to the resisting force Fr (blue arrow), thereby achieving force equilibrium. (b) Experimentally measured electric current through the air during particle raft deformation under the potential difference ϕ = 10 kV with the distance of the top electrode from the unperturbed interface h = 6.4 mm. (c) Regime map of the shape of a particle raft (5 mm thick castor oil coated with hollow glass spheres) in response to ϕ with h. The raft forms a small hump in regime A, touches the electrode in regime B, and forms a stable mound without touching the electrode in regime C. The green line is plotted by the approximate model, ϕ = η(ρg/Δε)1/2h3/2 with η = 1.2. The blue and red points represent the experimental boundaries of A–B and A–C, respectively. (d) The change of raft height from the unperturbed interface, H, with the increase of ϕ at fixed h corresponding to path I. (e) The change of H with the decrease of h at fixed ϕ corresponding to path II. In (d) and (e), the solid lines are theoretical predictions of our elaborate model given in eqn (A3) in Appendix A, and the dotted lines provide a guide to the eye. (f) The circles correspond to the experimentally measured height of the raft at the green regime boundary of (c). The red line, the theoretical prediction of H by taking A1/A2 = 5/6 in eqn (2), matches the experimental data. | ||
We can predict the fate of the raft as we increase the electric potential ϕ or the distance of the top electrode from the unperturbed free surface h, based on a regime map for the steady-state raft response in Fig. 2(c). We start the raft's morphing with a short hill formed under a weak electric field corresponding to a large electrode distance and a low potential (the lower right regime, indicated as A). To increase the electric field, we either increase the potential at a fixed electrode distance (path I) or decrease the electrode distance at a fixed potential (path II). When the regime boundary denoted as a green line is met in the path, the raft experiences a strong uplift, which may continue to eventually result in contact of the raft and the top electrode (regime B) or stop at a stable height (regime C) (see Appendix B, Fig. 10). Fig. 2(d) and (e) show the raft response to the change of ϕ (path I) and h (path II), respectively, as we move from regime A to C.
In order to theoretically explain the raft behavior, we first analyze the height H of a short hill in regime A, which is determined by the electric field between the electrodes. The electric field is related to the raft height through the balance of the electrostatic force with gravitational and capillary forces:
 | (1) |
As we cross the regime boundary in Fig. 2(c), the electrostatic force increases faster than the resisting forces due to capillarity and gravity, so that the raft rise cannot be stopped as in regime A. This boundary, or the conditions provoking the abrupt jump of H in Fig. 2(d) and (e), can be obtained by considering the force balance given by eqn (1): (ϕ/h)2Δε ∼ (ρg + γp/lc2)H, where we estimate the magnitudes of E and ∇2H as ϕ/h and H/lc2, respectively, with the capillary length lc = [γp/(ρg)]1/2. Taking H ∼ h, the potential at the regime boundary is scaled as ϕ = η(ρg/Δε)1/2h3/2 with η being an empirical prefactor, implying that the potential to upheave the raft into regime C increases like h3/2. We present a mathematically more elaborate model for the raft height in regime A and the regime boundary in Appendix A (see also Fig. 6 for the model used to analyze a non-uniform electric field). We see that the regime boundaries predicted by the current approximate analysis and the elaborate model are fairly close (Fig. 7), verifying our force argument leading to the raft upheaval.
Fig. 2(d) and (e) show that our elaborate model (eqn (A3) in Appendix A) can predict the variation of H with ϕ and h before the drastic uplift occurs (solid lines). After the sudden upheaval, the raft height is rather decreased with the increase of ϕ and the decrease of h (broken lines). Such a repulsive behavior of the top electrode against the raft in regime C arises because the raft height is adjusted to maintain the electric field in the air gap at the dielectric strength of the air. Therefore, the raft height is maximized along the green regime boundary in Fig. 2(c) in the upheaving mode.
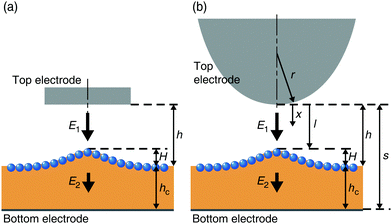
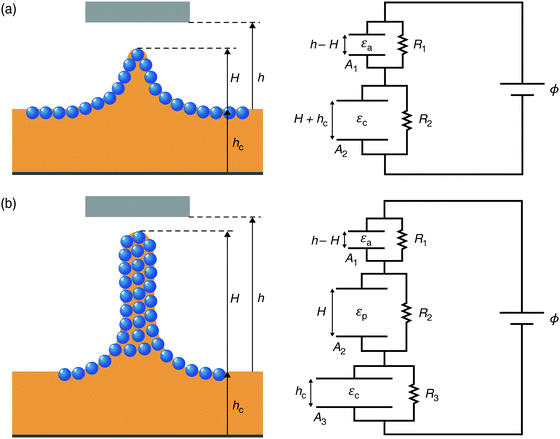
We now predict the maximum height of the raft, which is reached as a result of electric discharge. The above model is not suitable for the height of the upheaved raft owing to severe deformation of the interface and different force balance caused by discharge. We note that the electric field in the air gap has reached the dielectric strength of air, Es = 3 kV mm−1, when the raft is in equilibrium by discharge. We build a one-dimensional capacitance model [see Appendix B, Fig. 11(a)] where the electric field in the air gap is Ea = ϕa/(h − H) with ϕa being the potential difference across the air gap. The capacitance in the air and castor oil, respectively, given by C1 = εaA1/(h − H) and C2 = εcA2/(hc + H), interrelate via charge conservation: ϕaC1 = (ϕ − ϕa)C2, where A1 and A2 are the effective areas of the capacitors, and hc is the oil layer thickness. By equating Ea with Es, we find the raft height at the boundary of regimes A and C as the following:
 | (2) |
Fig. 2(f) plots the height of raft H along the green regime boundary in Fig. 2(c). Below the critical values of ϕ and h (boundary between regimes A and B), the raft touches the top electrode, so that h = H. Beyond the critical point, we find that the theoretically predicted maximum raft height of eqn (2) is in good agreement with the experiment.
Shape control of the particle raft
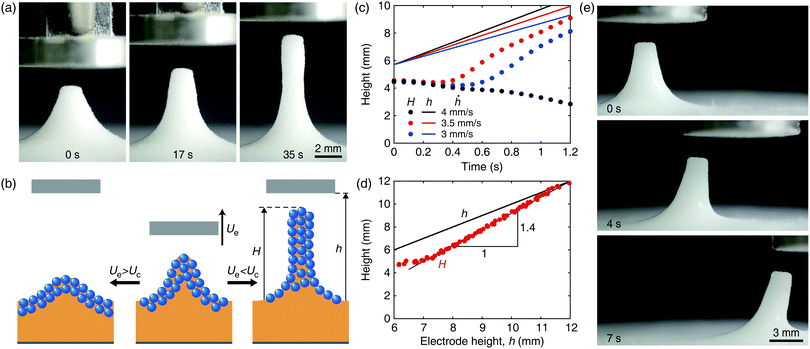
Once we generate a tall mound by reaching the aforementioned regime boundary, we can further control the raft morphology by moving the top electrode either upward or horizontally. When the electrode slowly moves upward, the mound is vertically pulled to turn to a tower, as shown in Fig. 3(a) and (b), which we term the remote pulling mode (see Movie S1, ESI†). We note that the already upheaved tall tower can keep standing even in regime A of Fig. 2(c). This is because once the raft has entered regime C, the force balance governed by the electric discharge can be maintained even when we follow path II backward to re-enter regime A. We note that repeating the remote pulling mode at the same location may leave a small trace as a result of local particle accumulation. This weakly hysteretic behavior, characteristic to viscoplastic systems, is associated with the plastic transition by the formation of intense force chains in large deformation.49Fig. 3(c) plots the temporal evolution of the mound height, H, for different electrode ascent speeds Ue, revealing that the raft can follow the electrode rising with a speed lower than the critical speed Uc ≈ 4 mm s−1 (see the ESI†). The slight decrease of the raft height in the initial stages for Ue = 3 and 3.5 mm s−1, as shown in Fig. 3(c), is because particles initially gathered toward the ascending electrode squeeze liquid out while narrowing the tower. The particle aggregate then grows vertically following the electrode with a nearly constant width.
The vertical growth rates of the particle aggregates are higher than the rising speed of the electrode as seen by greater slopes of the solid lines than the dotted lines in Fig. 3(c). Hence, the tower cannot be elongated indefinitely but rather reaches a maximum height at which it touches the electrode. To mathematically understand this remote pulling mode, i.e. the relationship between the electrode height h and the raft height H, we model the system as a three-layer structure of oil, particle aggregate, and air [see Appendix B, Fig. 11(b)]. In the one-dimensional series connection model of the three capacitors, the potential drops in air (ϕa), particle aggregate (ϕp), and oil (ϕc) are related as εaA1ϕa/(h − H) = εpA2ϕp/H = εcA3ϕc/hc through charge conservation. Here, εp is the permittivity of the particle aggregate, A1, A2, and A3 are respectively the area of the equivalent capacitors of air, particle aggregate, and oil. The relation combined with ϕ = ϕa + ϕp + ϕc leads to an equation for H:
 | (3) |
The sensitivity of the raft height to the electrode height change is quantified by H′ = dH/dh. Assuming A1 ≪ A3, A2 ≪ A3, and A1/A2 to be constant, we find H′ = 1/[1 − εaA1/(εpA2)] which is constant. We indeed see in Fig. 3(d) that the raft height increases at a constant slope and eventually equals the electrode height. The maximum height of the particle tower Ht is obtained by taking H = h = Ht in eqn (3): Ht = ϕεpA2/(EsεaA1), implying that it increases with the potential difference. An empirically found maximum height Ht = 12 mm for ϕ = 10 kV allows us to find the ratio εpA2/(εaA1) to be 3.5. Then we get the theoretical slope H′ = 1.4, which agrees well with the experimental results in Fig. 3(d).
Utilizing the attractive force between the upheaved particle raft and the moving electrode, we devised another morphing mode in the horizontal, rather than vertical, direction. The mound or tower originally built by the vertical deformation of the raft was translated horizontally following the electrode, as shown in Fig. 3(e), which is referred to as the horizontal translation mode (see Movie S1, ESI†). Such translation of the raft structure occurred when the electrode moved at a speed under a critical value, which is determined by the balance of the electrostatic attraction and the shear stress that resists the translational motion. We observed that the maximum horizontal velocity of the electrode that the tower could steadily follow was 6.5 mm s−1. Above the critical speed, the shear stress acting on the raft becomes so large that the particle tower elongates toward the top electrode and finally collapses.
Fig. 4(a)–(d) show that versatile control of the upheaved raft shape is possible by combining the upheaving mode, following either path I or II in Fig. 2(c), and the remote pulling mode. A relatively slender and tall tower in Fig. 4(b) can be constructed by pulling a slender mound in Fig. 4(a) that has been upheaved under the critical condition in Fig. 2(c). Starting from Fig. 4(a), we can build a relatively wide and tall tower as shown in Fig. 4(d), by first decreasing the electrode height h following path II (from black pentagram to pentagon) in Fig. 2(c) to reach a state in Fig. 4(c). Then, the wide mound is pulled upward to attain a state in Fig. 4(d). The widening of the mound as shown in the process from Fig. 4(a)–(c) is attributed to the enlarged raft region affected by a high electric potential. Using the same principle, we can further increase the mound width by employing a top electrode of a larger diameter, as shown in Fig. 4(e), where the electrode diameter has been doubled in comparison with that in Fig. 4(c) with the other conditions kept identical. Then, a fairly wide and tall tower can be built by pulling the mound in Fig. 4(e) to reach a state in Fig. 4(f) (see the ESI†).
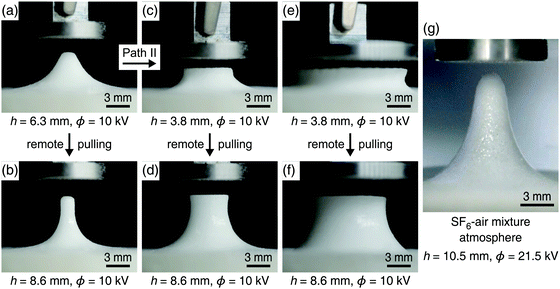 | ||
| Fig. 4 Various shape control schemes of a raft mound. (a) A raft mound upheaved at a critical potential of 10 kV with a constant top electrode height h = 6.3 mm. (b) A raft tower pulled by the ascent of the top electrode from (a). (c) A raft mound whose width has been increased as the electrode height h decreased to 3.8 mm from (a), following path II in Fig. 2(c). (d) A wide tall tower pulled by the ascent of the top electrode from (c). (e) A raft mound lifted by a top electrode of 20 mm diameter, twice that of those in (a)–(d). (f) A raft tower pulled by the ascent of the top electrode from (e). (g) A raft mound upheaved at a critical potential of 21.5 kV with a constant top electrode height h = 10.5 mm in the mixture of SF6 and air. Movie S2 (ESI†) shows all of the shape control processes in real-time. | ||
To increase the height of an upheaved raft in the upheaving mode alone, we replaced air with a mixture of SF6 and air that can prevent unwanted electric discharge at a greater electric potential owing to its high dielectric strength (see the ESI†). The result is shown in Fig. 4(g), where the particle raft has been upheaved to the height of H = 9.55 mm by a top electrode located at h = 10.5 mm with ϕ = 21.5 kV. Such high altitude of the electrode is impossible in normal air because electric breakdown occurs before such a high potential is reached.
Electro-morphing with electrodes of diverse materials
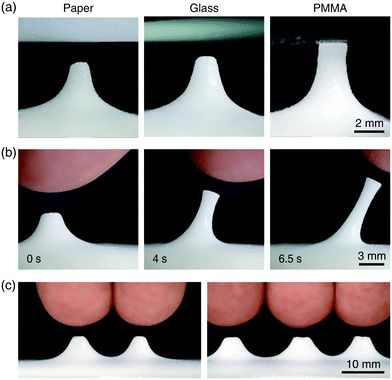
Our electro-morphing scheme is not restricted to highly conductive metallic electrodes. Rather, materials with moderately low conductivity can be employed as a top electrode. This is because the force balance of the upheaved raft requires only a very low current resulting from an electric discharge, as low as 2 nA (Fig. 2(b)). We indeed see in Fig. 5(a) that particle rafts can be upheaved by employing materials of poor conductivity (10−10–10−12 S m−1) like paper and glass, as a top electrode. Using an electrode of even lower conductivity (<10−14 S m−1), such as poly(methyl methacrylate) (PMMA), the raft rises with a significant delay but without stopping, as shown in the third panel of Fig. 5(a), because electric discharge can hardly be maintained due to slow charge transfer.The top electrode can be replaced by a floating electrode, i.e. an object with high capacity for charge storage. Fig. 5(b) and (c) show the electro-morphing of the raft with single and multiple bare fingers moving freely above the interface. This is because living tissues of animals and humans have the required high capacity for charge storage.50 This suggests that our particle raft system can serve as a human–machine interface as well as a sensor or actuator driven by bioelectricity (see Movie S3, ESI†). An array of electrodes that upheave the particle raft precisely where desired can construct three-dimensional (3D) topography out of a flat floor (see Movie S3, ESI†), suggesting another application of the system as a 3D physical display.
Conclusions
We have shown that a raft of partially wet dielectric particles can respond to an external electric field to upheave and form a tall stable mound. The particle raft's transformation arises when the electrostatic force exceeds the capillary and gravitational forces, but the uprise is stabilized by the electric breakdown of the surrounding gas. The mound can be further changed in height or width and translated by a varying electric field mediated by the electrode motion. Our theoretical models explain and predict the raft height achieved by the upheaving and the remote pulling modes. Versatile control of the raft shape is enabled by combining such fundamental morphing modes, employing electrodes of different sizes and materials, or changing gas environments. The remarkable shape-morphing capability of our soft composite material system allows us to envision its diverse applications in soft robotics, biomedicine, and smart architecture with ever-evolving sophisticated control technologies of the external electric field.51Appendix A: Theoretical modeling of electro-morphing
Theoretical modeling of particle raft height in regime A
To model the upheaving behavior of a particle raft under electrostatic forces, we need to analyze the non-uniform field created by a circular disk top electrode and a plane bottom electrode. We base our analysis on a ‘top parabola – bottom plane’ electrode system (Fig. 6), for which the analytical solution of E with homogeneous medium between the electrodes is given by E(x) = 2ϕ/[(r + 2x)ln(2s/r + 1)] with s being the distance between the parabola tip of curvature r−1 and the bottom electrode.52 Assuming that the fluid interface does not distort the electric field, we estimate E1 = k1ϕ/[(r + 2x)ln(2s/r + 1)] for air and E2 = k2ϕ/[(r + 2x)ln(2s/r + 1)] for liquid, where k1 and k2 are to be determined by the following two conditions. First, continuity of electric displacement across the fluid–fluid interface at x = l, given by εaE1(l) = εcE2(l), yields εak1 = εck2 where l is the distance between the parabola tip and the fluid–fluid interface. Second, the line integral of the electric field from the tip to the plane results in the total potential difference, . The two conditions give k1 = 2ϕln(2s/r + 1)/{ln[(r + 2l)/r] + (εa/εc)ln[(r + 2s)/(r + 2l)]} and k2 = (εa/εc)k1, which yields the electric field in the air E1, and the field in the liquid E2 as
 | (A1) |
 | (A2) |
The electric field is related to the raft height through the balance of the electrostatic force with gravitational and capillary forces: E2Δε/2 =ρgĤ + γp∇2Ĥ, where Δε is the jump of the permittivity between castor oil (εc) and air (εa), ρ is the density of castor oil, g is the gravitational acceleration, γp is the equivalent surface tension coefficient of the particle raft, and Ĥ is the raft height field with the maximum of H in the center. We estimate ∇2H as H/lc2 with the capillary length lc = [γp/(ρg)]1/2, which allows us to write H ≈ βE12 with β ∼ Δε/(ρg). In the real system with the disk electrode at the top, s and l are replaced by h + hc and h − H, respectively. Then the total electric potential ϕ is given by
 | (A3) |
Theoretical boundary of regimes A and C for strong uplift of a particle raft
The abrupt increase of hump height due to a slight increase of ϕ as we cross the regime boundary between A and C via path I is mathematically represented by ∂H/∂ϕ → ∞ or ∂ϕ/∂H = 0. As we take path II, the uplift of the raft at the regime boundary corresponds to ∂H/∂h → ∞ or ∂h/∂H = 0. Differentiating eqn (A3) with respect to H with h fixed gives | (A4) |
If we differentiate h with respect to H with ϕ fixed in eqn (A3), we get
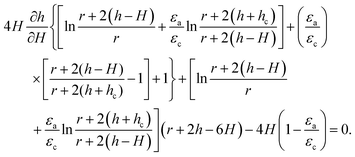 | (A5) |
Substituting ∂ϕ/∂H = 0 and ∂h/∂H = 0 into eqn (A4) and (A5), respectively, leads to the same equation, indicating that the conditions for ∂ϕ/∂H = 0 and ∂h/∂H = 0 for eqn (A3) are equivalent.
Eqn (A4) gives H = H*, where ∂ϕ/∂H = 0, in the following implicit form:
 | (A6) |
Substituting H* obtained in eqn (A6) into eqn (A3) allows us to find the theoretical regime boundary. By taking r = 7 mm and n = 1.6 × 10⁷ kg m1/2 A−1 s−3, the theoretical curve denoted by a dotted line in Fig. 7 agrees well with the experimental measurement results. Here, the value of the prefactor n makes good sense as n ∼ β−1/2 ∼ 107 kg m1/2 A−1 s−3.
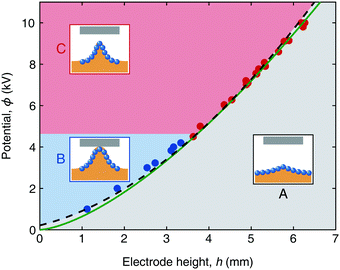 | ||
| Fig. 7 Comparison of theoretical regime boundaries. The green solid line is plotted from the scaling analysis, ϕ = η(ρg/Δε)1/2h3/2, by taking the prefactor η as 1.2. The black dotted line is the boundary obtained by eqn (A3) taking ∂ϕ/∂H = 0. | ||
The dynamics of raft upheaving
Considering that the ascent speed of the raft in upheaving mode, Ḣ, is less than 10 mm s−1, the Reynolds number of the upheaving flow, Re = ρḢlc/μc, is less than 0.1, where we assume the capillary length as the characteristic length. The value of Re indicates that the inertial effect is negligible in the upheaving flow. Then the force balance equation is written as | (A7) |
| E12Δε/2 − c1ρgH − c2μcḢ = 0, | (A8) |
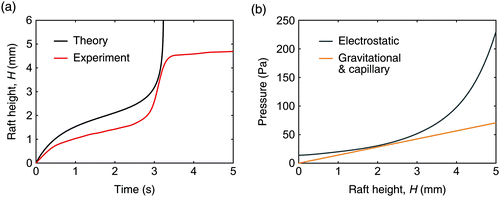
Fig. 8(a) shows the experimental height change (raft of mode I in Movie S1, ESI†) and the theoretical prediction obtained from eqn (A8) with fitting parameters of c1 = 1.5 and c2 = 5.6 × 10³ m−1. The experimental and theoretical curves exhibit a similar trend except for the late stages where the electric discharge effect newly comes in. The speed slows down after the initial rapid ascent and then accelerates again when the raft reaches a certain height. This change in speed is explained by the change in the force acting on the raft as a function of the raft height, which is shown in Fig. 8(b). Up to a height of 2 mm, the decrease in the difference between the electrostatic upheaving force and the other resisting forces slows the ascent. After the height of 2 mm, the difference between the two forces increases dramatically, which rapidly increases the ascent speed. In the experiment, the equilibrium state is reached by an electric discharge after such a jump.
Appendix B: Supplemental figures
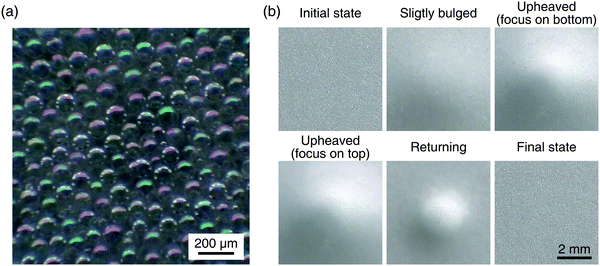
For a particle raft to behave like a perfectly insulating medium, particles must be tightly packed at the interface. Fig. 9(a) shows the uppermost particle layer of the particle raft. Densely packed layers of particles indicate that the raft can both suppress the surface charge convection and support significant shear stress. Fig. 9(b) also shows that the particle packing deteriorates little during the upheaving and returning process. We neither observed a significant increase in the inter-particle spacing nor particles expelled from the outermost layer during the morphing process, which implies that the particle layer well forms a two-dimensional solid.Following the regime map of Fig. 2(c), Fig. 10 shows the particle rafts reaching equilibrium after deformation at the regime boundary conditions. Under low voltage conditions, the low electric field between the upheaving particle raft and the electrode prevents electric discharge, causing the raft to touch the electrode. At 5 kV or higher, electric discharge occurs and the raft stops without touching the electrode. The gap between the raft and the electrode increases as the voltage increases, which is described in eqn (2) as h − H.
 | ||
| Fig. 10 Particle raft deformation at the regime boundary of Fig. 2(c). The upheaved raft touches the electrode at low h and ϕ (boundary of regimes A and B). On the other hand, at high h and ϕ (boundary of regimes A and C), the rafts stop without touching the electrode. | ||
Fig. 11 presents the equivalent one-dimensional (1D) capacitance model used to predict the maximum height of the upheaved raft. We used a two capacitor series-connected model for the raft deformed by upheaving, and a three-capacitor connected model for predicting the height of particle aggregate grown long by remote pulling. The resistances in the capacitance models can be neglected until the electric field in the air gap reaches the dielectric strength because the current is negligible for very high air resistance (R1) in Fig. 11(a) and (b).
Author contributions
H.-Y. K. conceived and supervised the research. K. S. conducted the experiments, and K. S., J.-Y. S., and H.-Y. K. analyzed the results. K. S. and H.-Y. K. prepared the manuscript and figures, and all of the authors contributed to the compilation and review of the manuscript.Conflicts of interest
H.-Y. K. and K. S. are inventors on the patent application (#10-2020-0170605, Republic of Korea) submitted by SNU R&DB Foundation that covers dielectric fluid and particle composition, and electrical operation methods for the fabrication of three-dimensional deformation systems.Acknowledgements
This work was supported by the National Research Foundation of Korea (grant no. 2018-052541) via SNU-IAMD.References
- Y. Kim, H. Yuk, R. Zhao, S. A. Chester and X. Zhao, Nature, 2018, 558, 274–279 CrossRef CAS PubMed.
- G. Gu, J. Zuo, Z. Ruike, X. Zhao and X. Zhu, Sci. Robot., 2018, 3, eaat2874 CrossRef PubMed.
- S. J. Park, M. Gazzola, K. S. Park, S. Park, V. Di Santo, E. L. Blevins, J. U. Lind, P. H. Campbell, S. Dauth, A. K. Capulli, F. S. Pasqualini, S. Ahn, A. Cho, H. Yuan, B. M. Maoz, R. Vijaykumar, J.-W. Choi, K. Deisseroth, G. V. Lauder, L. Mahadevan and K. K. Parker, Science, 2016, 353, 158–162 CrossRef CAS PubMed.
- H. Fu, K. Nan, W. Bai, W. Huang, K. Bai, L. Lu, C. Zhou, Y. Liu, F. Liu, J. Wang, M. Han, Z. Yan, H. Luan, Y. Zhang, Y. Zhang, J. Zhao, X. Cheng, M. Li, J. W. Lee, Y. Liu, D. Fang, X. Li, Y. Huang, Y. Zhang and J. A. Rogers, Nat. Mater., 2018, 17, 268–276 CrossRef CAS PubMed.
- M. Zarek, M. Layani, I. Cooperstein, E. Sachyani, D. Cohn and S. Magdassi, Adv. Mater., 2016, 28, 4449–4454 CrossRef CAS PubMed.
- M. Ma, L. Guo, D. G. Anderson and R. Langer, Science, 2013, 339, 186–189 CrossRef CAS PubMed.
- B. Gao, Q. Yang, X. Zhao, G. Jin, Y. Ma and F. Xu, Trends Biotechnol., 2016, 34, 746–756 CrossRef CAS PubMed.
- S. Fusco, M. S. Sakar, S. Kennedy, C. Peters, R. Bottani, F. Starsich, A. Mao, G. A. Sotiriou, S. Pané, S. E. Pratsinis, D. Mooney and B. J. Nelson, Adv. Mater., 2014, 26, 952–957 CrossRef CAS PubMed.
- A. Holstov, G. Farmer and B. Bridgens, Sustainability, 2017, 9, 435 CrossRef.
- S. Poppinga, C. Zollfrank, O. Prucker, J. Rühe, A. Menges, T. Cheng and T. Speck, Adv. Mater., 2017, 30, 1703653 CrossRef PubMed.
- E. Sifert, E. Reyssat, J. Bico and B. Roman, Nat. Mater., 2019, 18, 24–28 CrossRef PubMed.
- E. Hajiesmaili and D. R. Clarke, Nat. Commun., 2019, 10, 183 CrossRef PubMed.
- J. H. Pikul, S. Li, R. T. Hanlon, I. Cohen and R. F. Shepherd, Science, 2017, 358, 210–214 CrossRef CAS PubMed.
- H. Koemer, G. Price, N. A. Pearce, M. Alexander and R. A. Vaia, Nat. Mater., 2004, 3, 115–120 CrossRef PubMed.
- T. P. Russell, Science, 2002, 297, 964–967 CrossRef CAS PubMed.
- A. Nojoomi, K. Arslan, K. Lee and K. Yum, Nat. Commun., 2018, 9, 3705 CrossRef PubMed.
- A. Cangialosi, C. Yoon, J. Liu, Q. Huang, J. Guo, T. D. Nguyen, D. H. Gracias and R. Schulman, Science, 2017, 357, 1126–1130 CrossRef CAS PubMed.
- S.-J. Jeon, A. W. Hauser and R. C. Hayward, Acc. Chem. Res., 2017, 50, 161–169 CrossRef CAS PubMed.
- A. S. Gladman, E. A. Matsumoto, R. G. Nuzzo, L. Mahadevan and J. A. Lewis, Nat. Mater., 2016, 15, 413–418 CrossRef PubMed.
- M. C. Koetting, J. T. Peters, S. D. Steichen and N. A. Peppas, Mater. Sci. Eng., R, 2015, 93, 1–49 CrossRef PubMed.
- I. Tokarev and S. Minko, Soft Matter, 2009, 5, 511–514 RSC.
- Y. Liu, B. Shaw, M. D. Dickey and J. Genzer, Sci. Adv., 2017, 3, e1602417 CrossRef PubMed.
- L. H. Dudte, E. Vouga, T. Tachi and L. Mahadevan, Nat. Mater., 2016, 15, 583–588 CrossRef CAS PubMed.
- P. M. Reis, F. L. Jimenez and J. Marthelot, Proc. Natl. Acad. Sci. U. S. A., 2015, 112, 12234–12235 CrossRef CAS PubMed.
- S. Felton, M. Tolley, E. Demaine, D. Rus and R. Wood, Science, 2014, 345, 644–646 CrossRef CAS PubMed.
- Z. Y. Wei, Z. V. Guo, L. Dudte, H. Y. Liang and L. Mahadevan, Phys. Rev. Lett., 2013, 110, 215501 CrossRef CAS PubMed.
- T. Castle, D. M. Sussman, M. Tanis and R. D. Kamien, Sci. Adv., 2016, 2, e1601258 CrossRef PubMed.
- D. M. Sussman, Y. Cho, T. Castle, X. Gong, E. Jung, S. Yang and R. D. Kamien, Proc. Natl. Acad. Sci. U. S. A., 2015, 112, 7449–7453 CrossRef CAS PubMed.
- G. P. T. Choi, L. H. Dudte and L. Mahadevan, Nat. Mater., 2019, 18, 999–1004 CrossRef CAS PubMed.
- J. V. I. Timonen, M. Latikka, L. Leibler, R. H. A. Ras and O. Ikkala, Science, 2013, 341, 253–257 CrossRef CAS PubMed.
- I. Torres-Díaz and C. Rinaldi, Soft Matter, 2014, 10, 8584–8602 RSC.
- W. Wang, J. V. I. Timonen, A. Carlson, D. M. Drotlef, C. T. Zhang, S. Kolle, A. Grinthal, T. S. Wong, B. Hatton, S. H. Kang, S. Kennedy, J. Chi, R. T. Blough, M. Sitti, L. Mahadevan and J. Aizenberg, Nature, 2018, 559, 77–82 CrossRef CAS PubMed.
- M. D. Cowley and R. E. Rosensweig, J. Fluid Mech., 1967, 30, 671–688 CrossRef CAS.
- U. Banerjee and A. K. Sen, Soft Matter, 2018, 14, 2915–2922 RSC.
- L. Wang, F. Li, M. Kuang, M. Gao, J. Wang, Y. Huang, L. Jiang and Y. Song, Small, 2015, 11, 1900–1904 CrossRef CAS PubMed.
- D. Vella, P. Aussillous and L. Mahadevan, Europhys. Lett., 2004, 68, 212–218 CrossRef CAS.
- P. Aussillous and D. Quéré, Nature, 2001, 411, 924–927 CrossRef CAS PubMed.
- D. Vella, H.-Y. Kim, P. Aussillous and L. Mahadevan, Phys. Rev. Lett., 2006, 96, 178301 CrossRef PubMed.
- M. Abkarian, S. Protire, J. M. Aristoff and H. A. Stone, Nat. Commun., 2013, 4, 1–8 Search PubMed.
- P. Aussillous and D. Quéré, Proc. R. Soc. A, 2006, 462, 973–999 CrossRef CAS.
- Y. Xue, H. Wang, Y. Zhao, L. Dai, L. Feng, X. Wang and T. Lin, Adv. Mater., 2010, 22, 4814–4818 CrossRef CAS PubMed.
- T. B. Jones, J. D. Fowler, Y. S. Chang and C. J. Kim, Langmuir, 2003, 19, 7646–7651 CrossRef CAS.
- K. D. Danov, P. A. Kralchevsky and M. P. Boneva, Langmuir, 2004, 20, 6139–6151 CrossRef CAS PubMed.
- M. G. Nikolaides, A. R. Bausch, M. F. Hsu, A. D. Dinsmore, M. P. Brenner, C. Gay and D. A. Weitz, Nature, 2002, 420, 299–301 CrossRef CAS PubMed.
- D. A. Saville, Annu. Rev. Fluid Mech., 1997, 29, 27–64 CrossRef.
- R. T. Collins, J. J. Jones, M. T. Harris and O. A. Basaran, Nat. Phys., 2008, 4, 149–154 Search PubMed.
- E. SchaÈffer, T. Thurn-Albrecht, T. P. Russell and U. Steiner, Nature, 2000, 403, 874–877 CrossRef PubMed.
- M. M. Nicolson, Proc. Cambridge Philos. Soc., 1949, 45, 288–295 CrossRef.
- E. Jambon-Puillet, C. Josserand and S. Protière, Phys. Rev. Mater., 2017, 1, 042601 CrossRef.
- W. D. Greason, J. Electrost., 2003, 59, 285–300 CrossRef.
- J. B. Pendry, D. Schurig and D. R. Smith, Science, 2006, 312, 1780–1782 CrossRef CAS PubMed.
- A. A. Fridman and L. A. Kennedy, Plasma Physics and Engineering, Taylor and Francis, New York, 2004 Search PubMed.
Footnote |
| † Electronic supplementary information (ESI) available. See DOI: 10.1039/d1sm00564b |
| This journal is © The Royal Society of Chemistry 2021 |

