Theoretical investigation of polymorph- and coformer-dependent photoluminescence in molecular crystals†
Xibo
Feng
*,
Axel D.
Becke
and
Erin R.
Johnson

Department of Chemistry, Dalhousie University, 6274 Coburg Rd, P.O. Box 15000, Halifax, Nova Scotia B3H 4R2, Canada. E-mail: frederick.hillsfeng@dal.ca; axel.becke@dal.ca; erin.johnson@dal.ca; Web: http://schooner.chem.dal.ca
First published on 18th May 2021
Abstract
Polymorph- and coformer-dependent photoluminescence (PL) are among the variety of novel solid-state PL phenomena recently observed in many molecular crystals. They are of particular research interest due to their direct connections to two heavily investigated topics in crystal engineering: polymorphism and cocrystallization. Herein, we apply a novel computational methodology, initially proposed and successfully applied in our previous investigation of piezochromism, to theoretical modeling of the polymorph- and coformer-dependent PL in the well-known ROY polymorphs and the recently synthesized 9-acetylanthracene (9-ACA) cocrystals, respectively. Our methodology offers satisfactory prediction of the experimentally observed color zoning for the ROY polymorphs and provides good qualitative and quantitative accuracy for the emission (fluorescence) energies of the 9-ACA cocrystals, although the results in both cases may be adversely affected by delocalization error in the density-functional methods employed. While the polymorph-dependent PL in ROY is found to be controlled by the intramolecular geometry, modeling of the periodic crystal environment is necessary for accurate prediction of the coformer-dependent PL in the 9-ACA cocrystals, which is driven by charge transfer.
1 Introduction
Solid-state materials displaying photoluminescence (PL) have garnered significant research attention due to their wide range of potential applications in manufacture of solar cells,1,2 fluorescent sensors,3–5 and organic light-emitting diodes (OLEDs).6–8 Recent experimental works have discovered a variety of novel solid-state PL properties in many crystalline systems, including polymorph-dependency,9–11 coformer-dependency,12,13 PL response to applied pressure (piezochromism),14–16 and PL response to temperature (thermochromism).11,17 Since polymorphism and cocrystal formation are two intensively investigated aspects of crystal engineering, which are critically relevant to the discovery and manufacture of pharmaceuticals, molecular crystals displaying polymorph- or coformer-dependent PL are particularly intriguing. Consistent with many other novel solid-state PL phenomena, intermolecular interactions within the crystal lattice are thought to play a subtle, yet potentially critical, role in polymorph- and coformer-dependent PL.Computationally modeling polymorph- and coformer-dependent PL is of high theoretical interest, as periodic-boundary calculations can potentially unveil their mechanistic origin, and may also serve as a screening tool to optimize properties of candidate photoluminescent materials. Yet, such an endeavor also presents a great theoretical challenge, as the cost of wavefunction-based, correlated excited-state methods would be prohibitive in the molecular crystal context. Meanwhile, until very recently, successes in developing efficient time-dependent density-functional theory (TD-DFT) algorithms for periodic-boundary calculations18–20 have been scarce. Another potential alternative is the quantum-mechanics/molecular-mechanics (QM/MM) embedding scheme,21,22 where a MM cluster mimicking the crystalline environment could be built around a QM core on which the excitation is localized. However, the QM/MM scheme is not without its own shortcomings as it neglects Pauli repulsion between the QM and MM subsystems, leading to the unphysical penetration of the QM-electron density into the MM subsystem.23 Artificial accumulation of QM-electronic charge is also found at the QM/MM boundary, in cases where there exists an extensive H-bond network.24
We recently developed a novel and cost-efficient computational scheme to predict first-singlet excitation energies for molecular solids.25 Our methodology combines isolated-molecule and dispersion-corrected periodic-boundary DFT calculations, and incorporates Becke's virial exciton model26 to entirely bypass conventional excited-state methods. The virial exciton model has the advantage of computational simplicity, while also eliminating errors seen with TD-DFT for charge-transfer excitations.27 We previously applied this methodology to modeling the piezochromic behaviors of a selection of molecular crystals,25 and achieved general success in both cost-efficiency and predictive capability. In this work, we employ the same methodology to model the polymorph- and coformer-dependent PL in selected molecular crystals.
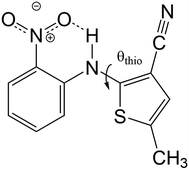
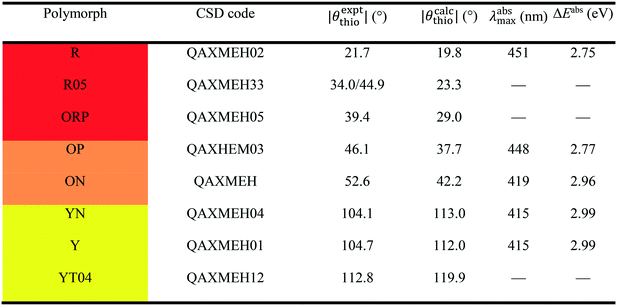
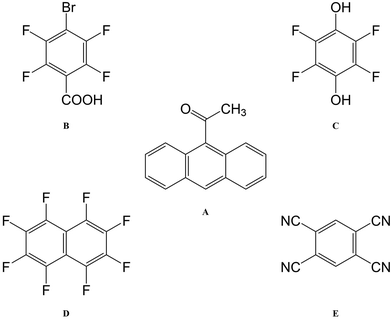
The best-known example of polymorph-dependent PL is the plethora of polymorphic crystals of 5-methyl-2-[(2-nitrophenyl)amino]-3-thiophenecarbonitrile (Fig. 1). This compound is better known as ROY due to the various colors ranging from red to orange to yellow displayed by its polymorphs.10 Herein, we model the absorption of a series of 8 ROY polymorphs whose crystallographic structures have been hitherto archived.28 The experimental absorbance data for the investigated ROY polymorphs are summarized in Table 1. For coformer-dependent PL, we select a group of 4 cocrystals formed between 9-acetylanthracene (9-ACA) and each of 4 coformers (Fig. 2). These 9-ACA cocrystals were found to display coformer-dependency in their emission (fluorescence) wavelengths, with their emission colors ranging from blue to green under UV light.13 Their experimental emission data are summarized in Table 2. As the results will indicate, our methodology once again achieves qualitative to semi-quantitative success in predicting the polymorph- and coformer-dependent PL, demonstrating excellent transferability between a variety of solid-state PL problems.
| Species | CSD code | λ emimax (nm) | ΔEemi (eV) |
|---|---|---|---|
| A | DEZCAM | 476 | 2.61 |
| A·B | QAHNIZ | 450 | 2.76 |
| A·C | QAHNUL | 466 | 2.66 |
| A·D | QAHPAT | 451 | 2.75 |
| A·E | QAHNOF | 600 | 2.07 |
2 Computational methods
Initial geometries of all molecular crystals were obtained from the Cambridge Crystallographic Data Centre (CCDC).30 The atomic positions and cell parameters were fully relaxed using periodic-boundary DFT calculations. We employed the projector augmented-wave method31 and the B86bPBE functional32,33 paired with the exchange-hole dipole moment (XDM) dispersion correction,34–36 using the Quantum ESPRESSO (QE) program.37 The well-converged 2 × 2 × 2 Monkhorst–Pack38k-point mesh and planewave cutoff values of 800 and 80 Ry for the kinetic energy and electron density, respectively, were used. All PAW datasets were generated via the “atomic” code by Dal Corso.39Following geometry relaxation, absorption and emission energies were computed using the same multi-step approach used in our previous work modeling piezochromism,25 which combines spin-polarized calculations on the target molecular crystals and on excised gas-phase molecules. For absorption, a single-point energy calculation is performed on the crystal using constrained magnetization to model the first excited triplet state (T1). The initial magnetic bias is applied to a single molecule to localize the excitation. For emission, the atomic positions of this T1 state are relaxed, although the lattice constants are kept fixed at their ground-state values.
To obtain the absorption and emission energies for the first singlet excited state (S1), a correction term obtained from Becke's virial exciton model26 is applied to the T1 energy. This correction corresponds to the S1–T1 gap for a single molecule, excised from the relaxed crystal structure. The S1–T1 gap is given by the two-electron exchange integral, H12 (denoted as Kif in ref. 26), computed from the two singly occupied HOMO and LUMO orbitals of the molecular T1 state:
 | (1) |
| ΔEmol0S = ΔEmol0T + Hmol12. | (2) |
It is assumed that the total electron densities of the T1 and S1 states are very similarly affected by the surrounding crystalline environment, so that the single-molecule H12 value is a good approximation to the S1–T1 energy gap of the molecular crystal. Thus, the singlet excitation energy in the crystal can be written as
| ΔEcryst0S = ΔEcryst0T + Hmol12. | (3) |
The assumption that the S1–T1 gap should be comparable for the molecule and crystal is based on the conjecture that the S1 and T1 states will have similar electron densities, differing only in the spin of one electron. This is also a fundamental assumption used in the virial exciton model itself and is supported by the excellent performance of the model for gas-phase excitation benchmarks.26,27 Additionally, we have found that the S1 and T1 states experience very similar dispersion interactions with the surrounding crystal lattice, as quantified by differences in the resulting lattice energies.25,44
In our previous study of piezochromism,25 we found that the pressure-dependent shifts in absorption and emission energies were captured as well by changes in the molecular crystal's band gap. The valence-conduction band gap in a molecular crystal, analogous to the HOMO–LUMO (optical) gap in the context of an isolated molecule, is directly related to its S0–S1 excitation energy. As such, additional band-structure calculations were performed on the investigated molecular crystals and the valence-conduction band gap values (ΔEBG) extracted. These calculations used the S0 or T1 geometries for comparison with experimental absorption or emission energies, respectively.
3 Results and discussion
3.1 Polymorph-dependent absorption of ROY
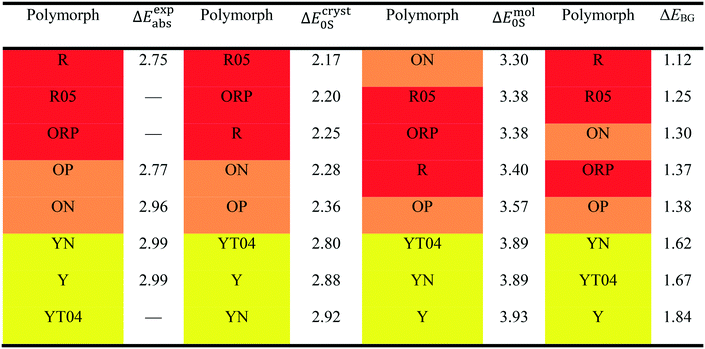
We first apply our computational scheme to predict the polymorph-dependent PL of the 8 polymorphic crystals of ROY. The absorption energies are computed under the assumption of vertical excitation from S0 to S1. The results are compared to available experimental absorption data in Table 3. The virial exciton computations systematically underestimate the experimental absorption energies by 0.11–0.60 eV. However, this quantitative comparison is complicated by the broad-band nature of the absorption spectral peaks,29 which diminishes the precision of the experimental absorption-energy values. Impressively, upon ranking the 8 polymorphs' computed and experimental absorption energies in ascending order, the virial exciton model almost perfectly reproduces the experimentally observed R–O–Y “color-zoning”, grouping each polymorph into the correct red–orange–yellow tricolor regime.The R–O–Y color zoning can be correlated with the intramolecular rotation angle, θthio, shown in Fig. 1. The red and orange forms have small intramolecular angles, ranging from ca. 20–50°, while the yellow forms have larger angles near 110°. Smaller angles increase the extent of conjugation between the phenyl and thiophene rings, resulting in lower excitation energies, while larger angles break conjugation and give rise to higher excitation energies. To verify the correlation between the excitation energies and θthio, gas-phase BH&HLYP42,45/cc-pVDZ calculations were conducted on the isolated ROY molecule using Gaussian 09.46 The molecular geometry was relaxed with θthio constrained to values from 0° to 180°, in steps of 10°, and the S1 excitation energy computed for each. As shown in Fig. 3, our gas-phase results agree with the trends seen both in experiment and our crystalline calculations: the molecular excitation energy increases as the level of conjugation decreases, and peaks when θthio is exactly 90°, where the conjugation is completely broken. Thus, when the ROY molecule becomes more planar, the polymorph's color tends to red; when the ROY molecule becomes more twisted, the polymorph's color tends to yellow.
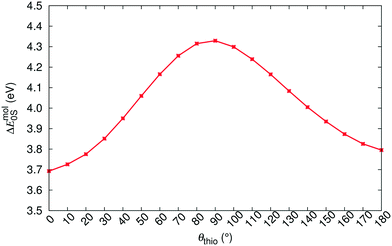 | ||
| Fig. 3 Correlation between θthio and the gas-phase singlet-excitation (absorption) energy (ΔEmol0S) of the isolated ROY molecule. | ||
Our results in Table 3 show a pronounced separation in absorption energies between the yellow- and red/orange-colored polymorphs. Meanwhile, the red–orange separation is predicted to be much narrower, indicating an orange-colored transition zone that bears more structural resemblance to the red-colored regime. It is possible that our calculations are underestimating the spread in excitation energies for the red/orange polymorphs due to delocalization error,47–50 which affects all generalized gradient approximations (GGAs), including the B86bPBE functional used in this work. One manifestation of delocalization error is that GGA functionals artificially stabilize systems with extended conjugation,51–54 and this can affect molecular crystal structure prediction.55–57 From Table 1, geometry optimizations of the R05, ORP, OP, and ON polymorphs provide intramolecular angles that are ca. 10° smaller than in the experimental crystal structures, favouring increased planarity and conjugation. Underestimation of this dihedral could lead to underestimation of the T1, and consequently the S1, excitation energies for these four polymorphs.
Another possible cause for the observed discrepancies between our calculated internal dihedral angle and the experimental crystal structures is the omission of thermal expansion (or contraction) of the cell volume within the present computational scheme. Thermal effects may be particularly significant for ROY, as the PL of the Y polymorph has been demonstrated to be quite sensitive to the cell volume.58 In agreement with previous work,56,57 we found that fixed-lattice optimizations of the S0 geometries significantly reduced the deviations in θthio for the 8 ROY polymorphs, from 15.8 to 3.8% mean absolute error, relative to experiment. We therefore conclude that the geometric discrepancies are mostly driven by the lack of thermal effects, which eventually leads to the aforementioned underestimation of the red–orange separation.
To further demonstrate the intramolecular nature of ROY's polymorph-dependent PL, the singlet excitation energies of the excised molecular moieties (ΔEmol0S) are also shown in Table 3. While the molecular excitation energies yield large quantitative errors when compared to the experimental absorption energies for the crystal polymorphs, this is expected due to complete neglect of the surrounding crystalline environment in computation of ΔEmol0S. However, the single-molecule results are able to replicate the experimental absorption-energy ranking and color zoning quite well, with the one notable exception of polymorph ON. Thus, the polymorphism-dependent PL of ROY is predominantly due to the differences in the intramolecular geometry, in particular the internal rotation angle θthio of the ROY molecule in its various polymorphic crystals. Intermolecular interactions within the crystal only affect the color zoning of the ON polymorph. Since the ON crystal involves close π-stacking of ROY molecules, it is reasonable that the effects of intermolecular interactions are more pronounced for this form relative to the other polymorphs.
The final column in Table 3 shows the valence-conduction band gap (ΔEBG) values. Unsurprisingly, the computed band gaps massively underestimate the experimental absorption energies, with errors of 1.3–1.6 eV for all 8 polymorphs. This underestimation is, in part, a manifestation of the well-known band gap problem seen with GGA density functionals.59–62 Additionally, the valence–conduction band gap cannot be fully equated to the optical gap of a periodic solid.63 However, ΔEBG mostly reproduces the R–O–Y color-zoning, except for a minor crossover of the orange-colored ON polymorph into the red-colored regime, which was also seen in the molecular results. Furthermore, the clear separation between the red/orange-colored polymorphs and the yellow-colored polymorphs observed in the virial exciton calculations, using both the single molecules and molecular crystals, is retained.
3.2 Coformer-dependent emission of 9-ACA cocrystals
Next, we turn our focus onto modeling the emission/fluorescence of the 9-acetylanthracene (9-ACA) cocrystals, which exhibit coformer-dependent PL. Applying our computational scheme specifically to emission, the results are tabulated in Table 4, together with the experimental emission data from the work of Li et al.13 Unlike the ROY polymorphs, the 9-ACA cocrystals offer a good case for quantitative comparison between our calculations and experimental measurements. This is due to both the completeness of the experimental emission data and the sharp-peak nature of the emission/fluorescence spectrum, which allows for precise peak identification. Overall, our computed emission energies achieved a mean absolute error (MAE) of 0.31 eV compared to experiment. This MAE is on-par with the accuracy previously attained by the virial exciton model26 on the Thiel small-molecule benchmark set,64 as well as for a set of charge-transfer excitations.27| Species | ΔEexpemi | ΔEcryst0S | ΔEmol0S | ΔEBG |
|---|---|---|---|---|
| A | 2.61 | 3.06 | 3.21 | 1.74 |
| A·B | 2.76 | 2.96 | 3.15 | 1.65 |
| A·C | 2.66 | 2.82 | 3.50 | 1.58 |
| A·D | 2.75 | 3.08 | 3.19 | 1.81 |
| A·E | 2.07 | 2.45 | 3.51 | 0.80 |
| MAE | — | 0.31 | 0.74 | 1.05 |
Our solid-state virial-exciton calculations are able to reproduce the experimental trend in emission energies among the four cocrystals: A·E ≪ A·C < A·B ≈ A·D. However, the experimental relations between the emission energies of the pristine crystal and the cocrystals are not fully reproduced by our calculations. Specifically, the experimental blue-shift of A·B and A·D from A is not predicted; rather, all three crystals are predicted to have similar emission energies. We also note that the largest quantitative error from experiment (0.45 eV) is seen for the single-component crystal A, making it an outlier relative to the set of cocrystals.
The computed band gaps, ΔEBG shown in Table 4, also replicate the trends in experimental emission energies of the 9-ACA cocrystals to an impressive degree, despite large quantitative deviations. However, the difference between A·C and A·B is now considerably smaller than seen from the ΔEcryst0S results, while the difference between A·B and A·D is widened slightly. The experimental blue-shift of A·B and A·D from A is again not captured by ΔEBG, further solidifying the status of the pristine 9-ACA crystal as an outlier, compared to its cocrystals. The large quantitative underestimation of ΔEexpabs/emi by ΔEBG reflects the value of including the localized virial exciton model in our methodology, which can correct for the band-gap problem and hone in on the actual excitation energies.
Similar to the previous case of the ROY polymorphs, we also computed the gas-phase emission energies for the 9-ACA molecules (ΔEmol0S) excised from each relaxed crystal structure. The large quantitative deviation from the experimental values is again to be expected due to neglect of the surrounding intermolecular interactions. However, in the case of the 9-ACA cocrystals, the single-molecule emission energies are entirely unable to capture any experimental trends. ΔEmol0S even fails to predict the largest red shift in emission energy, seen for A·E, and instead predicts a substantial blue shift for this cocrystal. This indicates that the coformer-dependent emission of the 9-ACA cocrystals is controlled by intermolecular interactions, necessitating the inclusion of the crystalline surroundings to distinguish between red and blue shifts in emission wavelengths. This stands in stark contrast to the intramolecular nature of the polymorph-dependent absorption of ROY, where a fairly decent prediction of the polymorphs' color zoning could be still obtained by merely modeling the molecular moiety excised from the crystal lattice. Indeed, the importance of intermolecular factors for the 9-ACA cocrystals can be inferred from the strategy used by Li et al.13 in their design, which aimed to exploit different degrees of intermolecular charge transfer (CT) between the 9-ACA molecule and the various coformers.
To verify the role played by intermolecular CT in shifting the emission energies, Bader charge analysis,65 using the Critic2 program,66 was performed on the molecular moieties within the cocrystals A·B to A·E, and the pristine crystal A, in both the S0 and T1 states. Fig. 4 shows the results of this analysis, in the form of the absolute charge per molecular moiety within each (co)crystal. While no intermolecular CT is predicted between the 9-ACA molecules within the pristine crystal, intermolecular CT from 9-ACA to the coformer is consistently predicted for all 4 cocrystals. Moderate amounts of CT (∼0.05–0.13 e−) are seen for both S0 and T1 states of each cocrystal, with the exception of A·E in the T1 state, where the intermolecular CT increases drastically to 0.28 e−. This increased charge transfer should preferentially stabilize the T1 state of A·E, relative to S0, and lead to a red shift in the emission energy. This charge analysis affirms the validity of the experimental designing strategy for A·E.13 The tetracyano-substituted coformer E has by far the strongest electron-withdrawing effect, and therefore induces a larger amount of CT from the 9-ACA molecule, especially in the excited state, leading to its large emission red-shift.
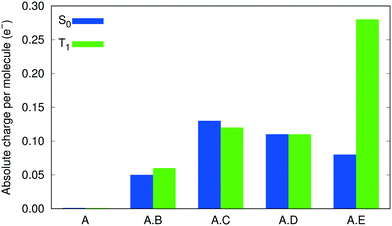 | ||
| Fig. 4 Degrees of intermolecular CT within the cocrystals and the pristine crystal of 9-ACA, as indicated by the absolute charge per molecule. | ||
The lack of intermolecular CT in the pristine crystal likely contributes to the apparent irregularity in its computed emission energy compared to the set of cocrystals. As noted above, the B86bPBE functional (like all GGA functionals) exhibits delocalization error, which causes preferential stabilization of systems with more CT.67–70 Thus, there is likely a systematic error cancellation in the computed properties of the cocrystals and the comparability between results for the pristine crystal and the cocrystals is significantly diminished. This explains the inability of our calculations to fully replicate the experimental relations between the emission energies of A and A·B to A·E.
4 Conclusions
In this work, we applied our novel computational methodology, which combines plane-wave periodic-boundary DFT calculations for solids and isolated-molecule DFT calculations using the virial exciton model, to the modeling of polymorph- and coformer-dependent PL in the polymorphs of ROY and the cocrystals of 9-ACA, respectively. For the 8 ROY polymorphs, our results were able to replicate the experimentally-observed R–O–Y color zoning. For this compound, the polymorph-dependent PL was shown to be driven by the intramolecular geometry, and the key role of the internal rotation angle θthio in determining the coloration of these ROY polymorphs was confirmed.For 9-ACA, our results were able to replicate the experimental ordering of the emission energies among the cocrystals and, quantitatively, an overall MAE of 0.31 eV was achieved by our calculations. However, trends regarding blue-shifting with respect to the pristine 9-ACA crystal were not captured. This can be attributed to delocalization error, which likely causes overstabilization of the cocrystals, all of which exhibit significant CT, relative to the pure 9-ACA crystal. Inclusion of the crystalline environment is necessary to model the coformer-dependent PL of 9-ACA, as it is predominantly driven by CT and other intermolecular interactions. This stands in contrast to the previous case of polymorph-dependent PL of ROY. The significant red-shift in the emission energy of the cocrystal A·E was rationalized through the increase in intermolecular CT from the ground to the excited state.
Although not as accurate as the combined solid-state and isolated molecule scheme, computed valence-conduction band gap values also offered fair qualitative replications of the experimental trends for both the ROY polymorphs and 9-ACA co-crystals. Due to their computational simplicity, use of band-structure calculations for qualitative prediction of solid-state PL warrants further exploration in future modeling studies.
Within the confines of our current computational methodology, we are not yet able to reproduce full absorption/emission spectra for our modeled systems. While the first singlet transition energy is of primary spectroscopic importance for most luminescent molecular crystals, knowledge of the full spectral line shape may be required to fully determine crystal colour, particularly for cases with broad adsorption/emission bands. Theoretically, it is possible to approximate the full spectrum by incorporating vibrational levels via the Franck–Condon principle. However, the computational cost of the requisite phonon calculations borders on prohibitive, even with sampling of only the Γ point, considering that our systems of interest frequently contain 150 to 200 atoms (or more) in their unit cells.
In closing, our employed methodology was successful in capturing the experimentally observed polymorph- and coformer-dependent PL behaviors of the investigated sets of molecular crystals. Along with its previous success in modeling piezochromism,25 the current methodology displays excellent transferability among a diversity of solid-state PL properties in molecular crystals. This work opens the door for theory-driven crystal engineering to optimize PL properties of molecular materials for targeted device applications.
Conflicts of interest
The authors declare no conflicts of interest.Acknowledgements
E. R. J. and A. D. B. thank the Natural Sciences and Engineering Research Council of Canada (NSERC), and F. X. acknowledges the Government of Nova Scotia for financial support. The authors thank Compute Canada for providing computational resources.Notes and references
- D.-Y. Chen, Y.-Y. Hsu, H.-C. Hsu, B.-S. Chen, Y.-T. Lee, H. Fu, M.-W. Chung, S.-H. Liu, H.-C. Chen, Y. Chi and P.-T. Chou, Chem. Commun., 2010, 46, 5256–5258 RSC.
- I. Chung, B. Lee, R. P. H. Chang and M. G. Kanatzidis, Nature, 2012, 485, 486–489 CrossRef CAS PubMed.
- S. P. Anthony, ChemPlusChem, 2012, 77, 518–531 CrossRef CAS.
- X. Hou, C. Ke, C. J. Bruns, P. R. McGonigal, R. B. Pettman and J. F. Stoddart, Nat. Commun., 2015, 6, 6884 CrossRef PubMed.
- P. Gayathri, M. Pannipara, A. G. Al-Sehemi and S. P. Anthony, New J. Chem., 2020, 44, 8680–8696 RSC.
- R. Pode, Renewable Sustainable Energy Rev., 2020, 133, 110043 CrossRef.
- M. Shimizu, R. Kaki, Y. Takeda, T. Hiyama, N. Nagai, H. Yamagishi and H. Furutani, Angew. Chem., 2012, 124, 4171–4175 CrossRef.
- V. Trannoy, A. Léaustic, S. Gadan, R. Guillot, C. Allain, G. Clavier, S. Mazerat, B. Geffroy and P. Yu, New J. Chem., 2021, 45, 3014–3021 RSC.
- L. Yu, Acc. Chem. Res., 2010, 43, 1257–1266 CrossRef CAS PubMed.
- B. A. Nogueira, C. Castiglioni and R. Fausto, Commun. Chem., 2020, 3, 34 CrossRef.
- Y. Chen, X. Zhang, M. Wang, J. Peng, Y. Zhou, X. Huang, W. Gao, M. Liu and H. Wu, J. Mater. Chem. C, 2019, 7, 12580–12587 RSC.
- Q. Feng, M. Wang, B. Dong, C. Xu, J. Zhao and H. Zhang, CrystEngComm, 2013, 15, 3629–3632 Search PubMed.
- S. Li, Y. Lin and D. Yan, J. Mater. Chem. C, 2016, 4, 2527–2534 RSC.
- K. Nagura, S. Saito, H. Yusa, H. Yamawaki, H. Fujihisa, H. Sato, Y. Shimoikeda and S. Yamaguchi, J. Am. Chem. Soc., 2013, 135, 10322–10325 CrossRef CAS PubMed.
- L. Wang, K. Wang, B. Zou, K. Ye, H. Zhang and Y. Wang, Adv. Mater., 2015, 27, 2918–2922 CrossRef CAS PubMed.
- J. Wu, Y. Cheng, J. Lan, D. Wu, S. Qian, L. Yan, Z. He, X. Li, K. Wang, B. Zou and J. You, J. Am. Chem. Soc., 2016, 138, 12803–12812 CrossRef CAS PubMed.
- L. Sun, W. Hua, Y. Liu, G. Tian, M. Chen, M. Chen, F. Yang, S. Wang, X. Zhang, Y. Luo and W. Hu, Angew. Chem., Int. Ed., 2019, 58, 11311–11316 CrossRef CAS PubMed.
- J. R. G. Sander, D. Bu
![[c with combining breve]](https://www.rsc.org/images/entities/char_0063_0306.gif) ar, R. F. Henry, J. Baltrusaitis, G. G. Z. Zhang and L. R. MacGillivray, J. Pharm. Sci., 2010, 99, 3676–3683 CrossRef CAS PubMed.
ar, R. F. Henry, J. Baltrusaitis, G. G. Z. Zhang and L. R. MacGillivray, J. Pharm. Sci., 2010, 99, 3676–3683 CrossRef CAS PubMed. - M. Arhangelskis, M. D. Eddleston, D. G. Reid, G. M. Day, D. Bu
![[c with combining breve]](https://www.rsc.org/images/entities/char_0063_0306.gif) ar, A. J. Morris and W. Jones, Chem. – Eur. J., 2016, 22, 10065–10073 CrossRef CAS PubMed.
ar, A. J. Morris and W. Jones, Chem. – Eur. J., 2016, 22, 10065–10073 CrossRef CAS PubMed. - M. Arhangelskis, D. B. Jochym, L. Bernasconi, T. Fri
![[s with combining breve]](https://www.rsc.org/images/entities/char_0073_0306.gif)
![[c with combining breve]](https://www.rsc.org/images/entities/char_0063_0306.gif) ić, A. J. Morris and W. Jones, J. Phys. Chem. A, 2018, 122, 7514–7521 CrossRef CAS PubMed.
ić, A. J. Morris and W. Jones, J. Phys. Chem. A, 2018, 122, 7514–7521 CrossRef CAS PubMed. - A. Warshel and M. Levitt, J. Mol. Biol., 1976, 103, 227–249 CrossRef CAS PubMed.
- T. Zhang, W. Shi, D. Wang, S. Zhuo, Q. Peng and Z. Shuai, J. Mater. Chem. C, 2019, 7, 1388–1398 RSC.
- Y. Jin, E. R. Johnson, X. Hu, W. Yang and H. Hu, J. Comput. Chem., 2013, 34, 2380–2388 CAS.
- C. M. Isborn, B. D. Mar, B. F. E. Curchod, I. Tavernelli and T. Martínez, J. Phys. Chem. B, 2013, 117, 12189–12201 CrossRef CAS PubMed.
- X. Feng, A. D. Becke and E. R. Johnson, J. Chem. Phys., 2020, 152, 234106 CrossRef CAS PubMed.
- A. D. Becke, J. Chem. Phys., 2018, 148, 044112 CrossRef PubMed.
- X. Feng, A. D. Becke and E. R. Johnson, J. Chem. Phys., 2018, 149, 231101 CrossRef PubMed.
- M. Tan, A. G. Shtukenberg, S. Zhu, W. Xu, E. Dooryhee, S. M. Nichols, M. D. Ward, B. Kahr and Q. Zhu, Faraday Discuss., 2018, 211, 477–491 RSC.
- L. Yu, J. Phys. Chem. A, 2002, 106, 544–550 CrossRef CAS.
- C. R. Groom, I. J. Bruno, M. P. Lightfoot and S. C. Ward, Acta Crystallogr., Sect. B: Struct. Sci., Cryst. Eng. Mater., 2016, 72, 171–179 CrossRef CAS PubMed.
- P. E. Blöchl, Phys. Rev. B: Condens. Matter Mater. Phys., 1994, 50, 17953–17979 CrossRef PubMed.
- A. D. Becke, J. Chem. Phys., 1986, 85, 7184–7187 CrossRef CAS.
- J. P. Perdew, K. Burke and M. Ernzerhof, Phys. Rev. Lett., 1996, 77, 3865–3868 CrossRef CAS PubMed.
- A. D. Becke and E. R. Johnson, J. Chem. Phys., 2007, 127, 124108 CrossRef PubMed.
- A. D. Becke and E. R. Johnson, J. Chem. Phys., 2007, 127, 154108 CrossRef PubMed.
- A. Otero-de-la-Roza and E. R. Johnson, J. Chem. Phys., 2012, 136, 174109 CrossRef CAS PubMed.
- P. Giannozzi, O. Andreussi, T. Brumme, O. Bunau, M. B. Nardelli, M. Calandra, R. Car, C. Cavazzoni, D. Ceresoli, M. Cococcioni, N. Colonna, I. Carnimeo, A. D. Corso, S. de Gironcoli, P. Delugas, R. A. DiStasio, A. Ferretti, Jr., A. Floris, G. Fratesi, G. Fugallo, R. Gebauer, U. Gerstmann, F. Giustino, T. Gorni, J. Jia, M. Kawamura, H. Ko, A. Kokalj, E. Küçükbenli, M. Lazzeri, M. Marsili, N. Marzari, F. Mauri, N. L. Nguyen, H. Nguyen, A. Otero-de-la-Roza, L. Paulatto, S. Poncé, D. Rocca, R. Sabatini, B. Santra, M. Schlipf, A. P. Seitsonen, A. Smogunov, I. Timrov, T. Thonhauser, P. Umari, N. Vast, X. Wu and S. Baroni, J. Phys.: Condens. Matter, 2017, 29, 465901 CrossRef CAS PubMed.
- H. J. Monkhorst and J. D. Pack, Phys. Rev. B: Solid State, 1976, 13, 5188 CrossRef.
- A. Dal Corso, Comput. Mater. Sci., 2014, 95, 337–350 CrossRef CAS.
- A. D. Becke, J. Chem. Phys., 1993, 98, 5648–5652 CrossRef CAS.
- T. H. Dunning, Jr., J. Chem. Phys., 1989, 90, 1007–1023 CrossRef.
- A. D. Becke, J. Chem. Phys., 1993, 98, 1372–1377 CrossRef CAS.
- A. D. Becke and R. M. Dickson, J. Chem. Phys., 1988, 89, 2993–2997 CrossRef CAS.
- X. Feng, A. Otero-de-la-Roza and E. R. Johnson, Can. J. Chem., 2018, 96, 730–737 CrossRef CAS.
- C. Lee, W. Yang and R. G. Parr, Phys. Rev. B: Condens. Matter Mater. Phys., 1988, 37, 785–789 CrossRef CAS PubMed.
- M. J. Frisch, G. W. Trucks, H. B. Schlegel, G. E. Scuseria, M. A. Robb, J. R. Cheeseman, G. Scalmani, V. Barone, B. Mennucci, G. A. Petersson, H. Nakatsuji, M. Caricato, X. Li, H. P. Hratchian, A. F. Izmaylov, J. Bloino, G. Zheng, J. L. Sonnenberg, M. Hada, M. Ehara, K. Toyota, R. Fukuda, J. Hasegawa, M. Ishida, T. Nakajima, Y. Honda, O. Kitao, H. Nakai, T. Vreven, J. A. Montgomery, Jr., J. E. Peralta, F. Ogliaro, M. Bearpark, J. J. Heyd, E. Brothers, K. N. Kudin, V. N. Staroverov, R. Kobayashi, J. Normand, K. Raghavachari, A. Rendell, J. C. Burant, S. S. Iyengar, J. Tomasi, M. Cossi, N. Rega, J. M. Millam, M. Klene, J. E. Knox, J. B. Cross, V. Bakken, C. Adamo, J. Jaramillo, R. Gomperts, R. E. Stratmann, O. Yazyev, A. J. Austin, R. Cammi, C. Pomelli, J. W. Ochterski, R. L. Martin, K. Morokuma, V. G. Zakrzewski, G. A. Voth, P. Salvador, J. J. Dannenberg, S. Dapprich, A. D. Daniels, Ö. Farkas, J. B. Foresman, J. V. Ortiz, J. Cioslowski and D. J. Fox, Gaussian 09 Revision E.01, Gaussian Inc., Wallingford CT, 2009 Search PubMed.
- O. A. Vydrov, G. E. Scuseria and J. P. Perdew, J. Chem. Phys., 2007, 126, 154109 CrossRef PubMed.
- A. J. Cohen, P. Mori-Sánchez and W. Yang, Science, 2008, 321, 792–794 CrossRef CAS PubMed.
- M.-C. Kim, E. Sim and K. Burke, Phys. Rev. Lett., 2013, 111, 073003 CrossRef PubMed.
- D. Hait and M. Head-Gordon, J. Phys. Chem. Lett., 2018, 9, 6280–6288 CrossRef CAS PubMed.
- H. L. Woodcock, H. F. Schaefer and P. R. Schreiner, J. Phys. Chem. A, 2002, 106, 11923–11931 CrossRef CAS.
- D. Jacquemin, A. Femenias, H. Chermette, I. Ciofini, C. Adamo, J.-M. André and E. A. Perpète, J. Phys. Chem. A, 2006, 110, 5952–5959 CrossRef CAS PubMed.
- T. Heaton-Burgess and W. Yang, J. Chem. Phys., 2010, 132, 234113 CrossRef PubMed.
- M. A. White, S. Kahwaji, V. L. S. Freitas, R. Siewert, J. A. Weatherby, M. D. M. C. Ribeiro da Silva, S. P. Verevkin, E. R. Johnson and J. W. Zwanziger, Angew. Chem., 2021, 60, 1546–1549 CrossRef CAS PubMed.
- S. R. Whittleton, A. Otero-de-la-Roza and E. R. Johnson, J. Chem. Theory Comput., 2017, 13, 5332–5342 CrossRef CAS PubMed.
- C. Greenwell, J. L. McKinley, P. Zhang, Q. Zeng, G. Sun, B. Li, S. Wen and G. J. O. Beran, Chem. Sci., 2020, 11, 2200–2214 RSC.
- C. Greenwell and G. J. O. Beran, Cryst. Growth Des., 2020, 20, 4875–4881 CrossRef CAS.
- E. L. Harty, A. R. Ha, M. R. Warren, A. L. Thompson, D. R. Allan, A. L. Goodwin and N. P. Funnell, Chem. Commun., 2015, 51, 10608–10611 RSC.
- J. P. Perdew, Int. J. Quantum Chem., 1985, 28, 497–523 CrossRef.
- L. J. Sham and M. Schlüter, Phys. Rev. B: Condens. Matter Mater. Phys., 1985, 32, 3883–3889 CrossRef CAS PubMed.
- P. Mori-Sánchez, A. J. Cohen and W. Yang, Phys. Rev. Lett., 2008, 100, 146401 CrossRef PubMed.
- J. P. Perdew, W. Yang, K. Burke, Z. Yang, E. K. U. Gross, M. Scheffler, G. E. Scuseria, T. M. Henderson, I. Y. Zhang, A. Ruzsinszky, H. Peng, J. Sun, E. Trushin and A. Görling, Proc. Natl. Acad. Sci. U. S. A., 2017, 114, 2801–2806 CrossRef CAS PubMed.
- J.-L. Bredas, Mater. Horiz., 2014, 1, 17–19 RSC.
- M. R. Silva-Junior, M. Schreiber, S. P. A. Sauer and W. Thiel, J. Chem. Phys., 2010, 133, 174318 CrossRef PubMed.
- R. F. W. Bader, Chem. Rev., 1991, 91, 893–928 CrossRef CAS.
- A. Otero-de-la-Roza, E. R. Johnson and V. Luaña, Comput. Phys. Commun., 2014, 185, 1007–1018 CrossRef CAS.
- E. Ruiz, D. R. Salahub and A. Vela, J. Chem. Phys., 1996, 100, 12265–12276 CrossRef CAS.
- G. Sini, J. S. Sears and J. L. Bredas, J. Chem. Theory Comput., 2011, 7, 602–609 CrossRef CAS PubMed.
- E. R. Johnson, M. Salamone, M. Bietti and G. A. DiLabio, J. Phys. Chem. A, 2013, 117, 947–952 CrossRef CAS PubMed.
- Y. Kim, S. Song, E. Sim and K. Burke, J. Phys. Chem. Lett., 2019, 10, 295–301 CrossRef CAS PubMed.
Footnote |
| † Electronic supplementary information (ESI) available: For tables of raw data and an expanded version of Fig. 3. See DOI: 10.1039/d1ce00383f |
| This journal is © The Royal Society of Chemistry 2021 |

