Bridging exosome and liposome through zirconium–phosphate coordination chemistry: a new method for exosome detection†
Lei
Wang
a,
Yucai
Yang
b,
Yunfei
Liu
a,
Limin
Ning
c,
Yang
Xiang
a and
Genxi
Li
 *ad
*ad
aState Key Laboratory of Pharmaceutical Biotechnology, School of Life Sciences, Nanjing University, Nanjing, 210023, P. R. China. E-mail: genxili@nju.edu.cn
bDepartment of Oncology, the Second Affiliated Hospital of Anhui Medical University, Hefei, 230601, P. R. China
cCollege of Medicine and Life Sciences, Nanjing University of Chinese Medicine, Nanjing, 210023, P. R. China
dCenter for Molecular Recognition and Biosensing, School of Life Sciences, Shanghai University, Shanghai, 200444, P. R. China
First published on 11th February 2019
Abstract
We have proposed a new exosomes–zirconium–liposomes sandwich structure to detect exosomes by using zirconium–phosphate coordination chemistry. The combined use of the intrinsic property of phosphate in both exosomes and liposomes as well as zirconium ions can endow the method lower cost, no modified label, simplicity and high efficiency.
Exosomes (30–200 nm diameter) are actively secreted by cells into biofluids during fusion of the multivesicular endosomes (MVEs) with the plasma membrane.1 A growing number of studies have demonstrated that exosomes contain lots of molecular information of their origin cells, including transmembrane and intracellular proteins and nucleic acids, which can be used for disease diagnostics, disease monitoring, and drug efficacy screening.2–5 Besides, exosomes can reflect global tumor burden and heterogeneity, overcoming sampling biases.6 For instance, it is reported that the level of GPC1+ exosomes can accurately discriminate benign pancreatic disease from early- and late- pancreatic cancer.3 Recently, Guo et al. have discovered that the level of circulating exosomal programmed death-ligand 1 (PD-L1) secreted form melanomas contributes to immunosuppression and is related with anti-PD-1 response, which enables exosomal PD-L1 as a good predictor for anti-PD-1 therapy.7 An increasing number of researches have demonstrated the fact that exosome carrying many physiology information can act as a good and easily available biomarker in cancer detection and prognosis diagnosis.8,9
For analysis, conventional analytical techniques for exosomes, such as western blotting and enzyme-linked immunosorbent assays (ELISAs), usually require large volumes of sample and extensive technical steps with low sensitivity. To overcome these shortcomings, several new bioassays for exosomes have been developed based on microfluidics,10 surface enhanced Raman scattering (SERS),11 electrochemistry12 and surface plasmon resonance (SPR) imaging.13 However, the development of new methods, which can be more simple, sensitive and easily operated, is still highly required.
Similar to exosomes, liposomes are also nanoscale lipid vesicles consisting of amphipathic phospholipid to form single or multiple bilayer membrane. Due to the excellent biodegradability and biocompatibility, good size controllability and easy surface modification, liposomes have been used as effective drug delivery systems and detection tools.14 Benefited from the wonderful capacity of encapsulation, liposomes have been also used as an amplifier for the determination of lipid kinase,15 thiamine16 and interferon-gamma (IFN-γ).17 As a platform to detect biomarkers, liposome-based signal amplification systems have received increasing attention, and liposomes are usually introduced via antigen–antibody interaction,18 covalent bond and nucleic acid hybridization,19 while they are introduced via coordination chemistry in this work.
Zr4+ ion can bind strongly to phosphate group of phospholipid membranes via the electrostatic interaction.20–25 So, in this work, considering that exosomes and liposomes are actually vesicles composed of phospholipid bilayer, we hypothesize that Zr4+ can bind with both exosomes and liposomes through coordination chemistry. Consequently, Zr4+ may play a role of linkage between exosomes and liposomes, thus an exosomes–Zr4+–liposomes sandwich structure should be able to be designed for the detection of exosomes. In this new method for exosomes detection, with liposome as an excellent amplifier, the sensitivity of assay can be greatly improved without introducing expensive enzyme-based signal amplification and complex multiple-step reactions. Besides, without extra chemical modification, the signal transduction can be easily achieved owing to the interaction between Zr4+ and phospholipid of biomembrane. Therefore, a new method with easy operation, no modification probe and sensitive performance is proposed in this work for exosomes detection.
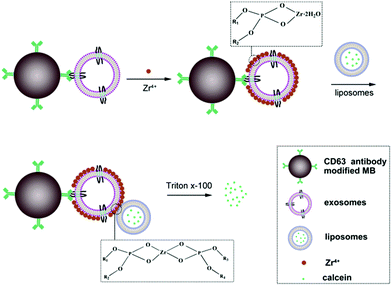
The principle of the new method for exosomes detection is shown in Scheme 1. The proposed sensor system is made up of antibody modified magnetic beads (MB), exosomes, Zr4+ ions and liposomes. The size of MB is about 2 μm. Firstly, CD63 antibody is immobilized onto the surface of MB through coupling the amino group of CD63 antibody with NHS group of MB. Upon the addition of exosomes, exosomes can be captured by the modified MB probe based on the recognition of the antibody with the surface antigen of exosomes. Then, the surface of exosomes can adsorb lots of Zr4+ ions via phosphate–Zr4+ interaction, which can subsequently mediate the cross-linking of liposomes that encapsulate lots of calcein, forming MB–exosomes–Zr4+–liposomes sandwich complex. The sandwich complex is then separated from the unbound liposomes and other potential interferent via a magnetic separation step. Finally, exosomes are assayed by detecting calcein packaged in liposomes after treatment with 1% Triton X-100, which leads to calcein release and to its de-quenching by dilution. Finally, the resulting fluorescence signal in the suspension is positively correlated to the concentration of exosomes.
The standard samples of exosomes are prepared from the HeLa cell culture medium via ultracentrifugation (see the ESI,† Experimental section). The concentration and size distribution of the extracted exosomes are measured using NanoSight (Fig. S1A, ESI†), and the concentration is about 4.2 × 10⁷ particles per μL. The size of exosomes is about 122 nm. Transmission electron microscopy (TEM) is performed to examine the morphology of exosomes (as shown in Fig. S1B, ESI†). The size of exosomes measured from NanoSight is consistent with the result of TEM. Liposomes encapsulated with calcein are also measured by TEM and the size of liposomes is about 100 nm (Fig. S1C, ESI†). The process of liposome preparation is provided in the ESI,† Experimental section. In addition, researchers without skills for liposome preparation can purchase liposome kit from Sigma-Aldrich. The purification of calcein-containing liposomes can also be conducted by either exclusion chromatography or ultrafiltration or dialysis. The different composition of liposome can also act as the signal carrier as long as it has the negatively charged phospholipid to combine with Zr4+.
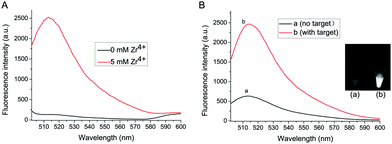
Zr4+ is the bridge linker between exosomes and liposomes in the proposed method. Fig. 1A shows the role of Zr4+ in the formation of exosomes–Zr4+–liposomes sandwich complex. Without Zr4+, no fluorescence signal intensity can be detected even in the presence of exosomes and liposomes. However, after Zr4+ with a concentration of 5 mM is added, a strong fluorescence signal appears, suggesting that Zr4+ is an indispensable element for the detection system.
To verify the feasibility of this proposed strategy, the final fluorescence signals in the assay are recorded under different conditions. As shown in Fig. 1B, in the absence of target exosomes, weak fluorescence signal intensity is observed, since Zr4+ is adsorbed onto a small number of carboxyl groups of antibody on the surface of MB probe and some liposomes are captured on the MB probe. After adding exosomes to the sensing system, strong fluorescence intensity can be obtained, because much Zr4+ and liposomes are adsorbed onto the surface of exosomes to form sandwich complex. The difference of fluorescence intensity has also been confirmed by the fluorescence imaging (shown in the inset of Fig. 1B).
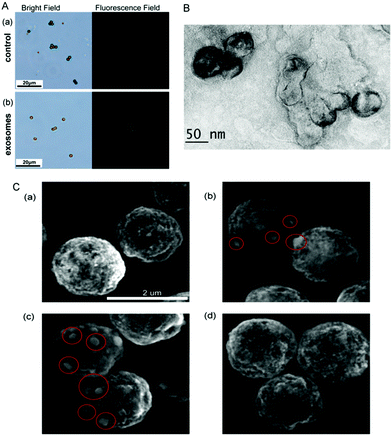
To further investigate the feasibility of the strategy, the microscope images of MB have been recorded. As seen in Fig. 2A, in the absence of exosomes, only weak fluorescence can be observed even Zr4+ and liposomes have been added in the test solution. However, strong fluorescence appears around MB probe in the presence of exosomes, demonstrating that the increasing fluorescence is attributed to the presence of exosomes. Therefore, the strategy can be developed as a new method for the detection of exosomes. The TEM image of exosomes + liposomes suggests that exosomes and liposomes can be linked together in the presence of Zr4+ (Fig. 2B). Meanwhile, the scanning electron microscope images of exosomes and liposomes captured on MB (Fig. 2C) show that liposomes can be captured on MB in the presence of exosomes.
The dynamic light scattering (DLS) of exosomes, liposomes, and the mix of exosomes + liposomes with or without Zr4+ has been presented in Fig. S2 (ESI†). When adding Zr4+ in either exosomes or liposomes or the mix of exosomes + liposomes, the sizes of exosomes, liposomes and exosomes + liposomes turn to be about 3.3 μm, indicating that Zr4+ can link both exosomes, liposomes and exosomes + liposomes through zirconium–phosphate coordination chemistry. Besides, the fluorescence intensity of liposomes, liposomes + exosomes with or without Zr4+ is also performed (Fig. S3, ESI†). After the addition of Zr4+ to liposomes and liposomes + exosomes, the decrease of fluorescence intensity is observed, showing that Zr4+ ions do not lead to the lysis of liposomes and liposomes + exosomes.
The zeta potential of MB has been measured step by step (see Fig. S4, ESI†). First, the zeta potential of CD63 antibody modified MB is detected as an initial contrast. After capturing exosomes, the zeta potential becomes more negative. And the zeta potential becomes less negative after Zr4+ is adsorbed onto the surface of exosomes. After adding liposomes, the zeta potential turns to be more negative, demonstrating that many liposomes are captured by Zr4+. Finally, the zeta potential decreases dramatically after adding Triton X-100 to crack the liposomes. The change of zeta potential of each step shows the successful modification on MB.
In order to optimize the assay conditions for the exosomes detection, the concentration of Zr4+ and incubation time need to be optimized, since Zr4+ is the key to link exosomes and liposomes. As shown in Fig. S5A (ESI†), with the concentration of Zr4+ increasing, the fluorescence intensity increases gradually and reaches a plateau when the Zr4+ concentration is 15 mM. So 15 mM Zr4+ has been chosen as the optimal concentration in the assay system. On the other hand, when the incubation time of Zr4+ is 20 min, the signal intensity shows a plateau and the optimal incubation time is 20 min (Fig. S5B, ESI†).
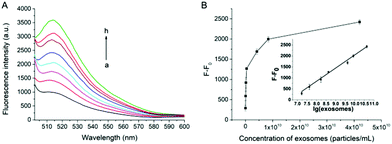
Under the optimal experimental conditions, the capability of our proposed method for quantitative analysis of exosomes has been examined. As shown in Fig. 3A, the fluorescence intensity at 514 nm increases gradually with the increasing concentration of exosomes. A good linear relationship can be obtained between the fluorescence intensity against the logarithm of the concentration of exosomes (Fig. 3B). The correlation equation is F − F0 = −3951.2 + 599.9 × lg[c] (R2 = 0.9862), where F is the fluorescence intensity with the corresponding exosomes and F0 is the fluorescence intensity without exosomes. lg[c] is the logarithm of exosomes concentration. The limit of detection (LOD) of the assay is calculated to be 7.6 × 10³ particles per μL based on 3 σb/slope (σb is the standard deviation of the blank samples). The influence of cell culture medium on the proposed assay has also been tested. As shown in Fig. S6 (ESI†), there is no significant change in fluorescence intensity when exosomes are spiked in cell medium with 10% (v/v) FBS, indicating that the assay can work well in the complex biological samples.
Finally, the new method proposed in this work has been compared with other currently available methods for the detection of exosomes based on the sensitivity, signal output and signal label. The proposed method displays a low detection limit with comparative advantages of label-free and relatively simple measuring procedure (Table S1, ESI†).
In summary, a sensitive, label-free and cost-effective method for detection of exosomes has been proposed by making use of phosphate–Zr4+–phosphate interaction. The proposed assay takes advantage of magnetic bead for easy separation and liposomes for signal amplification. Especially, it is the first time to detect exosomes by linking the phospholipids in both exosomes and liposomes with Zr4+. Meanwhile, with no enzyme or multiple signal amplification involved, high sensitivity of the assay can be achieved by introducing liposomes-based signal amplification. Besides, the rational utilization of the intrinsic phospholipid in biomembrane makes the assay simpler without introducing extra modification in the process of target recognition and signal amplification, which may bring about more inspiration in the construction of biosensor for biomedical research.
This work is supported by the National Natural Science Foundation of China (Grant No. 81772593, 81802978, 81672570 and 81503463).
Conflicts of interest
There are no conflicts to declare.Notes and references
- M. Colombo, G. Raposo and C. Théry, Annu. Rev. Cell Dev. Biol., 2014, 30, 255–289 CrossRef CAS PubMed.
- B. Costa-Silva, N. M. Aiello, A. J. Ocean, S. Singh, H. Zhang, B. K. Thakur, A. Becker, A. Hoshino, M. T. Mark, H. Molina, J. Xiang, T. Zhang, T.-M. Theilen, G. García-Santos, C. Williams, Y. Ararso, Y. Huang, G. Rodrigues, T.-L. Shen, K. J. Labori, I. M. B. Lothe, E. H. Kure, J. Hernandez, A. Doussot, S. H. Ebbesen, P. M. Grandgenett, M. A. Hollingsworth, M. Jain, K. Mallya, S. K. Batra, W. R. Jarnagin, R. E. Schwartz, I. Matei, H. Peinado, B. Z. Stanger, J. Bromberg and D. Lyden, Nat. Cell Biol., 2015, 17, 816 CrossRef CAS PubMed.
- S. A. Melo, L. B. Luecke, C. Kahlert, A. F. Fernandez, S. T. Gammon, J. Kaye, V. S. LeBleu, E. A. Mittendorf, J. Weitz, N. Rahbari, C. Reissfelder, C. Pilarsky, M. F. Fraga, D. Piwnica-Worms and R. Kalluri, Nature, 2015, 523, 177 CrossRef CAS PubMed.
- H. Shao, J. Chung, L. Balaj, A. Charest, D. D. Bigner, B. S. Carter, F. H. Hochberg, X. O. Breakefield, R. Weissleder and H. Lee, Nat. Med., 2012, 18, 1835–1840 CrossRef CAS PubMed.
- D. D. Taylor and C. Gercel-Taylor, Gynecol. Oncol., 2008, 110, 13–21 CrossRef CAS PubMed.
- M. Basik, A. Aguilar-Mahecha, C. Rousseau, Z. Diaz, S. Tejpar, A. Spatz, C. M. T. Greenwood and G. Batist, Nat. Rev. Clin. Oncol., 2013, 10, 437 CrossRef CAS PubMed.
- G. Chen, A. C. Huang, W. Zhang, G. Zhang, M. Wu, W. Xu, Z. Yu, J. Yang, B. Wang, H. Sun, H. Xia, Q. Man, W. Zhong, L. F. Antelo, B. Wu, X. Xiong, X. Liu, L. Guan, T. Li, S. Liu, R. Yang, Y. Lu, L. Dong, S. McGettigan, R. Somasundaram, R. Radhakrishnan, G. Mills, Y. Lu, J. Kim, Y. H. Chen, H. Dong, Y. Zhao, G. C. Karakousis, T. C. Mitchell, L. M. Schuchter, M. Herlyn, E. J. Wherry, X. Xu and W. Guo, Nature, 2018, 560, 382–386 CrossRef CAS PubMed.
- C. Sheridan, Nat. Biotechnol., 2016, 34, 359 CrossRef CAS PubMed.
- Y. Yoshioka, N. Kosaka, Y. Konishi, H. Ohta, H. Okamoto, H. Sonoda, R. Nonaka, H. Yamamoto, H. Ishii, M. Mori, K. Furuta, T. Nakajima, H. Hayashi, H. Sugisaki, H. Higashimoto, T. Kato, F. Takeshita and T. Ochiya, Nat. Commun., 2014, 5, 3591 CrossRef PubMed.
- Y. T. Kang, Y. J. Kim, J. Bu, Y. H. Cho, S. W. Han and B. I. Moon, Nanoscale, 2017, 9, 13495–13505 RSC.
- S. Stremersch, M. Marro, B. E. Pinchasik, P. Baatsen, A. Hendrix, S. C. De Smedt, P. Loza-Alvarez, A. G. Skirtach, K. Raemdonck and K. Braeckmans, Small, 2016, 12, 3292–3301 CrossRef CAS PubMed.
- S. Wang, L. Zhang, S. Wan, S. Cansiz, C. Cui, Y. Liu, R. Cai, C. Hong, I. T. Teng, M. Shi, Y. Wu, Y. Dong and W. Tan, ACS Nano, 2017, 11, 3943–3949 CrossRef CAS PubMed.
- S. Picciolini, A. Gualerzi, R. Vanna, A. Sguassero, F. Gramatica, M. Bedoni, M. Masserini and C. Morasso, Anal. Chem., 2018, 90, 8873–8880 CrossRef CAS PubMed.
- N. Grimaldi, F. Andrade, N. Segovia, L. Ferrer-Tasies, S. Sala, J. Veciana and N. Ventosa, Chem. Soc. Rev., 2016, 45, 6520–6545 RSC.
- T. Gao, C. Mu, H. Shi, L. Shi, X. Mao and G. Li, ACS Appl. Mater. Interfaces, 2018, 10, 59–65 CrossRef CAS PubMed.
- K. A. Edwards, W. J. Seog, L. Han, S. Feder, C. E. Kraft and A. J. Baeumner, Anal. Chem., 2016, 88, 8248–8256 CrossRef CAS PubMed.
- H. Cui, B. Bo, J. Ma, Y. Tang, J. Zhao and H. Xiao, Chem. Commun., 2018, 54, 4870–4873 RSC.
- L. Mei, X. Jiang, X. Yu, W. Zhao, J. Xu and H. Chen, Anal. Chem., 2018, 90, 2749–2755 CrossRef CAS PubMed.
- J. Zhou, Q. Wang and C. Zhang, J. Am. Chem. Soc., 2013, 135, 2056–2059 CrossRef CAS PubMed.
- H. Liu, C. Queffelec, C. Charlier, A. Defontaine, A. Fateh, C. Tellier, D. R. Talham and B. Bujoli, Langmuir, 2014, 30, 13949–13955 CrossRef CAS PubMed.
- J. Huang, L. Guo and L. M. Zheng, Analyst, 2010, 135, 559–563 RSC.
- J. Lu, Y. Li and C. Deng, Nanoscale, 2011, 3, 1225–1233 RSC.
- J. G. Heck, J. Napp, S. Simonato, J. Mollmer, M. Lange, H. M. Reichardt, R. Staudt, F. Alves and C. Feldmann, J. Am. Chem. Soc., 2015, 137, 7329–7336 CrossRef CAS PubMed.
- Q. Hu, Q. Wang, G. Sun, J. Kong and X. Zhang, Anal. Chem., 2017, 89, 9253–9259 CrossRef CAS PubMed.
- R. M. Fabre and D. R. Talham, Langmuir, 2009, 25, 12644–12652 CrossRef CAS PubMed.
Footnote |
| † Electronic supplementary information (ESI) available. See DOI: 10.1039/c9cc00220k |
| This journal is © The Royal Society of Chemistry 2019 |


