DOI:
10.1039/C6SM00334F
(Paper)
Soft Matter, 2016,
12, 4229-4240
The apparent charge of nanoparticles trapped at a water interface
Received
9th February 2016
, Accepted 24th March 2016
First published on 25th March 2016
Abstract
Charged spherical nanoparticles trapped at the interface between water and air or water and oil exhibit repulsive electrostatic forces that contain a long-ranged dipolar and a short-ranged exponentially decaying component. The former are induced by the unscreened electrostatic field through the non-polar low-permittivity medium, and the latter result from the overlap of the diffuse ion clouds that form in the aqueous phase close to the nanoparticles. The magnitude of the long-ranged dipolar interaction is largely determined by the residual charges that remain attached to the air- (or oil-) exposed region of the nanoparticle. In the present work we address the question to what extent the charges on the water-immersed part of the nanoparticle provide an additional contribution to the dipolar interaction. To this end, we model the electrostatic properties of a spherical particle – a nanoparticle or a colloid – that partitions equatorially to the air–water interface, thereby employing nonlinear Poisson–Boltzmann theory in the aqueous solution and accounting for the propagation of the electric field through the interior of the particle. We demonstrate that the apparent charge density on the air-exposed region of the particle, which determines the dipole potential, is influenced by the electrostatic properties in the aqueous solution. We also show that this electrostatic coupling through the particle can be reproduced qualitatively by a simple analytic planar capacitor model. Our results help to rationalize the experimentally observed weak but non-vanishing salt dependence of the forces that stabilize ordered two-dimensional arrays of interface-trapped nanoparticles or colloids.
1 Introduction
Charged colloids or nanoparticles that partition into the dielectric interface between air and water (and similarly for oil and water) can arrange into ordered two-dimensional arrays, which are stabilized by long-ranged repulsive electrostatic interactions. Such decorated interfaces offer promising applications, including emulsions stabilization,1–3 antireflective coatings,4,5 and optical devices. The two-dimensional nature of their electrostatically stabilized ordering render interface-trapped particles also interesting from a fundamental point of view.
Classical works by Stillinger6 and Pieranski7 highlight the long-ranged, dipole-like nature of the electrostatic interactions between charged particles at dielectric interfaces. Clearly, within a bulk aqueous solution the interaction is screened by mobile ions (salt, or H+ and OH− ions in the absence of added salt) and thus decays exponentially whereas in a uniform dielectric medium without mobile ions a bare 1/r-Coulomb potential as function of the distance r emerges. When trapped at an air–water (or oil–water) interface, image charges and the presence of mobile ions in the aqueous medium are expected to render the long-range part of the interaction dipole-like, 1/r3, and inversely proportional to the salt concentration.8
Charged colloids or nanoparticles often carry dissociable groups (phosphate or carboxyl moieties9–12) that allow the surface charge density to adjust. When immersed in water the particle's surface charge density tends to be much larger as compared to being exposed to air or oil.13 Indeed, water has a large dielectric constant and contains mobile ions that effectively screen electrostatic interactions and thus reduce the energy needed to establish a highly charged surface. In contrast, the high cost of forming electrostatic fields in media of low permittivity and the absence of mobile ions tend to oppose the accumulation of charge at charge-regulated surfaces. This results in charge densities that are high and low in the water-exposed and air- (or oil-) exposed regions of the particle, respectively. However, the latter and not the former mediate long-ranged particle–particle interactions. In line with this, Aveyard et al.13 have reported that the ordered pattern formed by polystyrene latex particles covered by sulfate groups was insensitive to the electrolyte when they were placed at an oil–water interface. A similar observation was presented by Law et al.14 for silica particles trapped at an octane–water interface. In all these cases the authors concluded that the electrostatic repulsion emerged exclusively due to residual charges at the oil-exposed surface regions of the particles.
Based on the initially observed13 electrolyte insensitivity and the perceived importance of the charges exposed to the medium of low dielectric constant, Danov et al.15–17 have modeled the electrostatic force acting on charged colloids at the oil–water interface thereby imposing a scenario of no penetration of the electric field into the aqueous medium. Computational studies with a similar scope have been presented by Zhao et al.18 and Majee et al.19 Both consider spherical particles that partition equatorially into an oil–water interface and compute electrostatic fields inside the aqueous and oil phases for asymmetric charge distributions on the particles (that is, different uniform surface charge densities on the oil- and water-exposed particle regions). While the two models accurately account for the particle shape and charge distribution, neither of them allows the electrostatic field to penetrate into the particle interior and thus to couple the electrostatic properties in the aqueous phase with those in the apolar medium.
Recent experiments have shown, however, that the repulsion between charged colloids at an oil–water interface is weakly dependent on the electrolyte concentration,20–23 putting into question the sole responsibility of the oil-exposed charges for the long-range dipole interactions. As pointed out by Frydel et al.,24 there is a possibility of the electric field produced by the charges on the water-facing side of a particle to propagate into the oil phase by passing through the particle interior instead of spreading exclusively into the aqueous medium. This idea has been pursued using a renormalization approach,12,24,25 where the charges on the water-facing side of a colloid give rise to an electrostatic potential in the air (or oil) phase that far away from the colloid can be matched with the potential produced by a dipole with an apparent dipole moment. The apparent dipole moment was determined from numerical solutions of the Poisson–Boltzmann and Laplace equations for spherical particles.24 Yet, what was not accounted for is the possibility that, first, not only the water-facing side of the colloid but also its oil-facing side is charged and, second, the dielectric constant inside the colloid can be different from that in the air.
In the present work we analyze the electrostatic properties of a spherical particle (i.e., a colloid or a nanoparticle) that partitions equatorially into the interface between water and a medium of low dielectric constant (we focus on air but the model applies similarly to an oil phase). We allow the particle to have different uniform charge densities on its water- and air-exposed regions. In contrast to previous studies we explicitly include into our model the dielectric properties inside the particle. That is, we allow the electric field to propagate into the particle interior and thus to either enhance or diminish the electric field in the air. Hence, our model is designed to predict the salt dependence of the long-ranged dipolar particle–particle interactions. Our calculations are carried out on the level of mean-field electrostatics. To this end, we solve Laplace equations in the air and inside the spherical particle, and the nonlinear Poisson–Boltzmann equation in the water phase. Two approximations are adopted. First, we assume the radius of the particle is much larger than the Debye screening length of the aqueous solution and, second, the surface potential at the air–water interface is fixed and constant. We express our results in terms of an apparent surface charge density at the air-exposed region of the particle. This apparent charge density lumps the bare charge density and the contribution of the electric field that propagates through the particle into an apparent value, thus expressing the degree of coupling between the air-exposed and water-exposed particle regions. Equivalently, the apparent charge density produces the same electric field in the air while assuming the particle interior is impenetrable to the electric field than the bare charge density does for the same, yet field-penetrable, particle. Note that this concept exactly preserves the image charges needed to produce the electric field in the air.26 Our calculations demonstrate that even with a small dielecric constant inside the particle, the charges at its water-exposed region can make a significant contribution to the long-ranged dipolar interactions between interfacially trapped particles. We analyze this behavior in terms of several parameters: the dielectric constant inside the particle, the potential difference across the air–water interface, and the salt content in the aqueous solution. We also show that a simple approximation – that of a planar capacitor with appropriate boundary conditions – yields an explicit expression for the apparent charge density at the air-exposed region of the particle, which is in qualitative agreement with our detailed numerical calculations for the spherical particle geometry.
2 Theory
We consider a particle (a nanoparticle or a colloid) of uniform dielectric constant εn that partitions into the interface between air (with dielectric constant εa = 1) and water (with dielectric constant εw = 80 and in presence of monovalent salt with bulk concentration n0). The surface of the particle carries a fixed surface charge density that we denote by σa for the air-exposed region and by σw for the water-exposed region; see Fig. 1. At this point we do not assume a specific shape of the particle, nor that the two surface charge densities σa and σw are uniform; both will be specified below. However, because we only target electrostatic interactions, we treat the air–water interface throughout this work as flat; i.e., we neglect surface perturbations due to capillary effects.
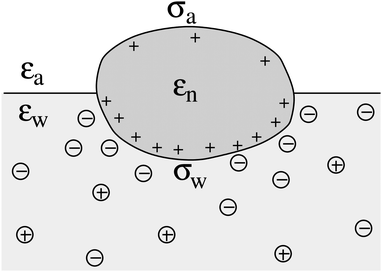 |
| | Fig. 1 Schematic illustration of a charged particle (a nanoparticle or colloid, with dielectric constant εn), located at the interface between air (with dielectric constant εa = 1) and water (with dielectric constant εw = 80). The aqueous phase contains monovalent salt ions of bulk concentration n0. The surface charge densities of the particle at its air-exposed and water-exposed regions are denoted by σa and σw, respectively. | |
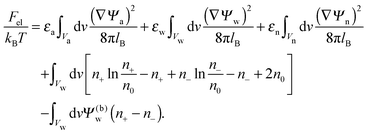
The present work is based on mean-field electrostatics, expressed in terms of the commonly used dimensionless electrostatic potential Ψ = eΦ/kBT, where Φ is the electrostatic potential, kB the Boltzmann constant, T the absolute temperature, and e the elementary charge. Note that Ψ = 1 corresponds to an electrostatic potential of Φ = 25 mV at room temperature. We use indices “a”, “w”, and “n” to label the three regions: air, water, and the inside of the nanoparticle. Hence Ψa, Ψw, and Ψn, denote the dimensionless potential in the air, water, and particle interior, respectively. With this, the electrostatic free energy, in units of kBT, of the charged particle at the air–water interface can be expressed as
| |  | (1) |
The first three volume integrals, which run over the air (volume
Va), water (volume
Vw), and nanoparticle (volume
Vn) regions, account for the energy stored in the electrostatic field;
lB =
e2/(4π
ε0kBT) = 56 nm is the Bjerrum length in vacuum (the permittivity of free space is denoted by
ε0). The fourth integral corresponds to the demixing free energy of two ideal gases, one for the mobile cations and the other for the mobile anions in the aqueous solution, expressed in terms of the local cation concentration,
n+, and local anion concentration,
n−. In the bulk of the aqueous phase
n+ =
n− =
n0.
We note that the electrostatic potential is believed to change when passing from air into the bulk of an aqueous solution. The potential difference likely reflects both the adsorption of ions (OH−versus H+) and the dipole potential from interface-induced water ordering. The magnitude and sign have been a matter of debate,27,28 but a change from a more negative potential in the air to a more positive potential in bulk water finds wide experimental29,30 and some computational31 support. In the present work we use the potential in the air, far away from the air–water interface and from the particle, as reference that we define as zero. Hence, in the bulk of the aqueous phase, the potential adopts a non-vanishing constant value that we denote by Ψ(b)w. The final term in eqn (1) introduces Ψ(b)w as a fixed (and yet unspecified) external potential in the aqueous medium. Indeed, minimization of Fel with respect to the local ion concentrations yields the Boltzmann distributions
| |  | (2) |
which recover
n+ =
n− =
n0 for
Ψw =
Ψ(b)w. When combined with the Poisson equation ∇
2Ψw = −4π
lB(
n+ −
n−),
eqn (2) gives rise to the Poisson–Boltzmann equation,
| | | lD2∇2Ψw = sinh(Ψw − Ψ(b)w), | (3) |
where
lD = (8π
lBn0/
εw)
−1/2 is the familiar Debye screening length. Minimization of
Fel also produces the Laplace equations
for the potentials in the air (
Ψa) and inside the particle (
Ψn). At the interfaces between the particle and air as well as between the particle and water, the change in the normal component of the electric displacement field equals the fixed surface charge density.
32 At the air-exposed surface
Aa of the particle this reads
| |  | (5) |
and similarly for the water-exposed surface
Aw of the nanoparticle
| |  | (6) |
where ∂/∂
N denotes the derivative in the normal direction of the particle, pointing away from the particle's interior. In the present work we assume the Debye screening length
lD is much smaller than the radius of curvature at any point of the particle. For example, a salt concentration of 1 mM gives rise to
lD ≈ 10 nm so that we would assume
R ≫ 10 nm for a spherical nanoparticle of radius
R. Generally, the assumption
R ≫
lD renders the solution of the Poisson–Boltzmann equation in the aqueous medium sufficiently close to that of a planar extended surface, allowing us to carry out the first integration
33| |  | (7) |
Eqn (7) is valid everywhere in the aqueous medium; when applying it to the water-exposed surface of the particle and using the continuity condition
Ψw|
Aw =
Ψn|
Aw,
eqn (6) reads
| |  | (8) |
Eqn (8) will serve us as one of the boundary conditions for solving the Laplace equation inside the particle.
Due to the presence of salt and the large dielectric constant of water it is a reasonable approximation to treat the aqueous solution as a perfect conductor, implying the condition Ψa = 0 at the air–water interface.
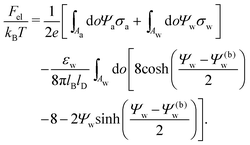
We also wish to calculate the electrostatic free energy. To this end, we insert the distributions for n± from eqn (2) into eqn (1), and then re-express Fel exclusively in terms of the particle's surface potentials using the Poisson–Boltzmann equation (eqn (3)) and the Laplace equations (eqn (4)) as well as the boundary conditions according to eqn (5) and (8),
| |  | (9) |
Here, the first integration runs over the particle's air-exposed surface region (
Aa), and the second and third integrations run over the particle's water-exposed surface region (
Aw).
The electrostatic problem is now fully defined; we need to solve the two Laplace equations in eqn (4), each in a medium with uniform but different dielectric constant, subject to the boundary conditions in eqn (5) and (8) (the latter one being nonlinear), and Ψa = 0 at both the air–water interface and at very large distance away from the particle. Once the potential at the surface of the particle is known, we may calculate the corresponding electrostatic free energy using eqn (9). In order to find explicit solutions for the potential we need to specify the shape of the particle. We will focus on a spherical particle of radius R that partitions equatorially to the air–water interface. However, prior to considering the spherical geometry explicitly, we investigate a planar capacitor-like geometry that serves us as an approximation for the spherical geometry and allows to compute simple analytical solutions for the potential.
2.1 Planar capacitor approximation
As we shall demonstrate in the Results and discussion section, the planar capacitor displayed in Fig. 2 reproduces the electrostatic properties of a spherical, interface-trapped particle reasonably well. It consists of two planar surfaces with surface charge densities σa and σw that enclose a region of dielectric constant εn. The capacitor plates are located at positions x = −R and x = 0, along the normal direction x. The region x > 0 models the water phase with its dielectric constant εw, whereas the region −2R < x < −R has dielectric constant εa and represents the air region. We point out that there are no obvious choices for the linear extensions of the particle and air regions. Our assumptions −R < x < 0 and −2R < x < −R both seem convenient but a more detailed model could attempt to further optimize these ranges. We denote the dimensionless electrostatic potential within the air, nanoparticle, and water by Ψa(x), Ψn(x), and Ψw(x), respectively. For the planar capacitor geometry the Laplace equations (see eqn (4)), Ψa′′(x) = 0 and Ψn′′(x) = 0, yield the two solutions Ψa(x) = Ψ(a)0(2 + x/R) and Ψn(x) = Ψ(a)0 + (Ψ(w)0 − Ψ(a)0)(1 + x/R), written in terms of the yet unknown surface potentials, Ψ(a)0 = Ψa(−R) = Ψn(−R) and Ψ(w)0 = Ψn(0) = Ψw(0), and fulfilling the condition Ψa(−2R) = 0. It is convenient to define the two coupling parameters| |  | (10) |
and express the surface charge densities σa and σw in terms of the dimensionless quantities| |  | (11) |
Eqn (5) and (8) then read for the planar capacitor model| |  | (12) |
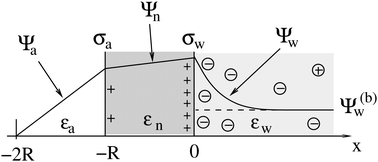 |
| | Fig. 2 Illustration of the planar capacitor model that serves us as an approximation for a spherical particle of radius R. Three regions, air (for −2R < x < −R, with dielectric constant εa and dimensionless potential Ψa), the inside of the particle (for −R < x < 0, with dielectric constant εn and dimensionless potential Ψn), and water (x > 0, with dielectric constant εw and dimensionless potential Ψw), are separated by two planar surfaces, located at x = −R and x = 0, that are oriented normal to the x-axis. The location x = −2R is kept at fixed potential Ψa = 0, and the two surfaces at constant surface charge density: σa, at the surface exposed to the air, and σw at the surface facing the aqueous medium. The dimensionless electrostatic potential in bulk water (at x → ∞) is denoted by Ψ(b)w (dashed line). | |
Upon inserting the potentials Ψa(x) and Ψn(x) we obtain two algebraic equations for the two surface potentials
| |  | (13) |
Note that for
Hn = 0 the air and water regions decouple and we immediately obtain
| |  | (14) |
for the surface potential at the water-exposed plate. For
Hn ≪ 1 (that is,
εnlD ≪
εwR) we can expand
Ψ(w)0 =
Ψ(w)0(
Hn = 0) +
HnΔ
Ψ(w)0 up to linear order in
Hn and thus re-express
eqn (13) as a linear system in terms of
Ψ(a)0 and Δ
Ψ(w)0. The solution yields explicit relations for the two surface potentials
| | 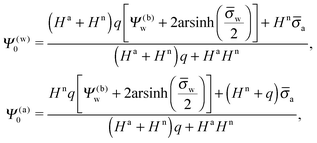 | (15) |
where we have defined

.
We are interested in the apparent surface charge density σappa of the particle as observed from the air. We define σappa as the surface charge density at the air-exposed region of the particle that preserves the electric field in the air while imposing εn = 0. Similar to eqn (11), we define a dimensionless apparent charge density ![[small sigma, Greek, macron]](https://www.rsc.org/images/entities/i_char_e0d2.gif) appa = 4πlBlDσappa/(eεw), which we can compute according to eqn (12) through
appa = 4πlBlDσappa/(eεw), which we can compute according to eqn (12) through ![[small sigma, Greek, macron]](https://www.rsc.org/images/entities/i_char_e0d2.gif) appa =
appa = ![[small sigma, Greek, macron]](https://www.rsc.org/images/entities/i_char_e0d2.gif) a + HnRΨn′(−R), or equivalently using eqn (13),
a + HnRΨn′(−R), or equivalently using eqn (13), ![[small sigma, Greek, macron]](https://www.rsc.org/images/entities/i_char_e0d2.gif) appa = HaΨ(a)0. Hence, the surface potential at the air-exposed region of the nanoparticle determines the apparent surface charge density (in units of the elementary charge e)
appa = HaΨ(a)0. Hence, the surface potential at the air-exposed region of the nanoparticle determines the apparent surface charge density (in units of the elementary charge e)
| |  | (16) |
Of course, for
Hn = 0 we recover
σappa =
σa. Also, in the limit of large surface charge density at the water-exposed surface,
![[small sigma, Greek, macron]](https://www.rsc.org/images/entities/i_char_e0d2.gif) w
w ≫ 1, we obtain
| |  | (17) |
which exhibits additivity of the contributions from the bare surface charge density
σa and from the field due to both the charges that face the aqueous medium and the potential difference
Ψ(b)w across the air–water surface. Moreover, if in addition we demand
Ψ(b)w = 0,
![[small sigma, Greek, macron]](https://www.rsc.org/images/entities/i_char_e0d2.gif) a
a = 0, and
εn =
εa,
eqn (16) reduces to
σappa =
εa![[thin space (1/6-em)]](https://www.rsc.org/images/entities/char_2009.gif)
ln(
![[small sigma, Greek, macron]](https://www.rsc.org/images/entities/i_char_e0d2.gif) w
w)/(4π
lBR), which is smaller by a factor of four than the prediction for the renormalized surface charge density at the particle-air interface that Oettel and Dietrich
12 have derived.
We note that the surface potentials in eqn (15) become an exact solution of eqn (13) if the scaled surface charge density ![[small sigma, Greek, macron]](https://www.rsc.org/images/entities/i_char_e0d2.gif) w ≪ 1 is sufficiently small. This case corresponds to the linear Debye–Hückel limit of Poisson–Boltzmann theory, leading to
w ≪ 1 is sufficiently small. This case corresponds to the linear Debye–Hückel limit of Poisson–Boltzmann theory, leading to
| | 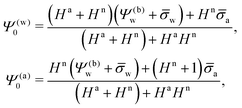 | (18) |
and thus
| |  | (19) |
In the Results and discussion section we will analyze and discuss the behavior of
σappa as predicted by the planar capacitor approximation.
2.2 Spherical geometry
We now focus on the spherical geometry; that is, a spherical particle of radius R partitioning equatorially to the air–water interface as illustrated in Fig. 3. Recall that σa and σw denote the surface charge densities on the air-exposed and water exposed regions of the particle, respectively. In the following we assume that each of these two surface charge densities is uniform. We also recall that the potentials in the air, Ψa, and inside the particle, Ψn, fulfill the Laplace equation (see eqn (4)), subject to the boundary conditions in eqn (5) and (8), and Ψa = 0 at both the air–water interface and at very large distance away from the particle. Due to the spherical geometry and because of the rotational symmetry with respect to an axis through the center of the sphere directed normal to the air–water interface, we can express the solutions for Ψa and Ψn in terms of Legendre polynomials Pl(s) of order l through| |  | (20) |
where r is the distance to the center of the particle, s = cos![[thin space (1/6-em)]](https://www.rsc.org/images/entities/char_2009.gif) θ is the cosine of the angle with respect to the direction normal to the air–water interface, and Al and Bl are yet to be determined sets of constants. Note that Ψn(r,s) is defined for 0 ≤ r ≤ R and −1 ≤ s ≤ 1. Similarly, Ψa(r,s) is defined for r ≥ R and 0 ≤ s ≤ 1. Because we require the potential at the air–water interface Ψa(r > R, s = 0) = 0 to vanish, the sum in eqn (20) runs only over uneven Legendre polynomials. Continuity Ψa(R,s) = Ψn(R,s) at the air-exposed region of the particle, i.e. for 0 ≤ s ≤ 1, must allow us to express the coefficients Al and Bl in terms of a single set of coefficients that we denote by Cl. Indeed continuity is ensured by choosing
θ is the cosine of the angle with respect to the direction normal to the air–water interface, and Al and Bl are yet to be determined sets of constants. Note that Ψn(r,s) is defined for 0 ≤ r ≤ R and −1 ≤ s ≤ 1. Similarly, Ψa(r,s) is defined for r ≥ R and 0 ≤ s ≤ 1. Because we require the potential at the air–water interface Ψa(r > R, s = 0) = 0 to vanish, the sum in eqn (20) runs only over uneven Legendre polynomials. Continuity Ψa(R,s) = Ψn(R,s) at the air-exposed region of the particle, i.e. for 0 ≤ s ≤ 1, must allow us to express the coefficients Al and Bl in terms of a single set of coefficients that we denote by Cl. Indeed continuity is ensured by choosing| |  | (21) |
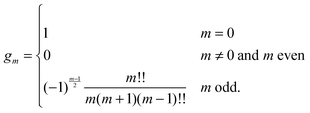
where the numbers| |  | (22) |
are defined for any combination of non-negative integers m and n. The integral in eqn (22) yields34
with| |  | (23) |
where m is an even and n an odd integer. The coefficients Cl in eqn (21) appear in an expansion of the dimensionless surface potential Ψ0(s) = Ψa(R,s) = Ψn(R,s) in terms of Legendre polynomials,  with −1 ≤ s ≤ 1.
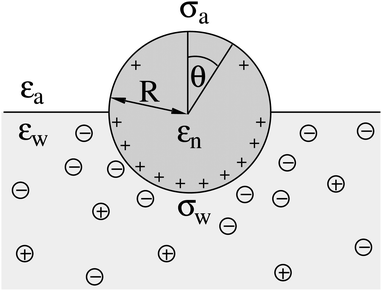 |
| | Fig. 3 The same system as illustrated in Fig. 1 but for a spherical particle of radius R that partitions equatorially to the air–water interface; θ is the polar angle measured with respect to the normal direction as indicated. | |
In order to determine the coefficients Cl, which contain all the information needed to specify the electrostatic potential everywhere, we proceed as for the planar capacitor approximation (see the preceding Section 2.1) by expanding the surface potential at the water-exposed region of the particle in terms of Hn up to first order. The two boundary conditions in eqn (5) and (8) then read
| |  | (24) |
where we have used the definitions in
eqn (10) and (11) for
Hn,
Ha,
![[small sigma, Greek, macron]](https://www.rsc.org/images/entities/i_char_e0d2.gif) n
n and
![[small sigma, Greek, macron]](https://www.rsc.org/images/entities/i_char_e0d2.gif) a
a. Also,

as previously defined. We point out that the first and second line in
eqn (24) apply to 0 ≤
s ≤ 1 and −1 ≤
s ≤ 0, respectively. Because
eqn (24) are linear in the dimensionless potentials, we can use
Ψn(
r,
s) and
Ψa(
r,
s) from
eqn (20) together with the coefficients in
eqn (21) to extract the following linear system of equations
| | 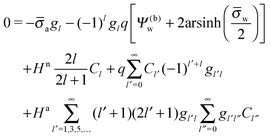 | (25) |
for the coefficients
Cl with
l = 0, 1, 2,…. In
eqn (25) we have introduced the definition

for any non-negative integer
m, which amounts to
34
To derive eqn (25) we have also used orthogonality  , where δmn denotes the Kronecker delta, and symmetry
  of the Legendre polynomials.
Solutions of eqn (25) can be found numerically for a finite set of coefficients Cl with l = 0, 1, 2,…, lmax. The choice of lmax will determine the accuracy of the electrostatic potential. We will determine lmax such that the free energy Fel = Fel(lmax), calculated on the basis of the surface potential  , converges to Fel(lmax → ∞) up to a certain numerical accuracy. Recall that Fel is fully determined by the surface potential; see eqn (9). For spherical particle geometry, eqn (9) reads
| | 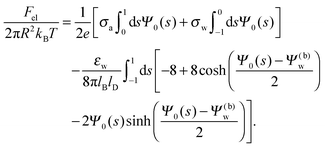 | (26) |
We finally investigate the linearized Debye–Hückel limit, valid if the dimensionless potential in the aqueous phase, measured with respect to the bulk, is sufficiently small, |
Ψw −
Ψ(0)w| ≪ 1. In this case
q = 1 and 2
![[thin space (1/6-em)]](https://www.rsc.org/images/entities/char_2009.gif)
arsinh(
![[small sigma, Greek, macron]](https://www.rsc.org/images/entities/i_char_e0d2.gif) w
w/2) =
![[small sigma, Greek, macron]](https://www.rsc.org/images/entities/i_char_e0d2.gif) w
w, and the system of equations,
eqn (25), reads
| | 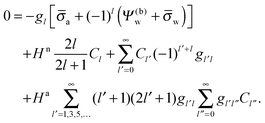 | (27) |
The electrostatic free energy in the linearized Debye–Hückel limit becomes
| |  | (28) |
3 Results and discussion
We consider a spherical particle of radius R = 50 nm, immersed at the interface between air (with dielectric constant εa = 1) and water (with dielectric constant εw = 80); see Fig. 3. We first compute the electrostatic free energy Fel, as specified in eqn (26), as function of the number of coefficients lmax that are used to numerically solve the linear system in eqn (25). Fig. 4 displays the free energy difference ΔFel(εn,lmax) = Fel(εn,lmax) − Fel(εn = 5,lmax = 70) as function of lmax for a particle with representative surface charge densities of σa = 3.2 nC cm−2 and σw = 3.2 μC cm−2. Note that 3.2 μC cm−2 corresponds to 0.2 e nm−2. We have also chosen a Debye screening length lD = 5 nm (which corresponds to a 4 mM concentration of monovalent salt cations and anions in the bulk), and a reference potential Ψ(b)w = 0 in the aqueous phase. The three different curves refer to the dielectric constants of εn = 0 (top), εn = 2 (middle), and εn = 5 (bottom) inside the spherical particle.
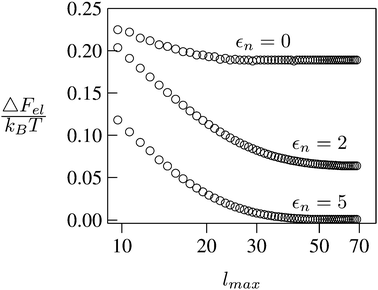 |
| | Fig. 4 Electrostatic free energy difference ΔFel(εn,lmax) = Fel(εn,lmax) − Fel(εn = 5,lmax = 70) as function of the number of coefficients lmax for a spherical particle of radius R = 50 nm with uniform surface charge densities σa = 3.2 nC cm−2 = 0.0002 e nm−2 at the air-exposed region and σw = 3.2 μC cm−2 = 0.2 e nm−2 at the water-exposed region. The three different curves refer to εn = 0 (top), εn = 2 (middle), and εn = 5 (bottom). The Debye screening length is lD = 5 nm. | |
Clearly, in the hypothetical limit of εn = 0 the inside of the particle becomes impenetrable to the electric field; this renders the electrostatic properties of the air-exposed and water-exposed regions of the particle independent from each other. Increasing εn allows the electric field to enter the particle and thus decreases the free energy. The free energy also decreases with lmax because each Cl adds a degree of freedom to the system. Most importantly, Fel(lmax) converges to a fixed constant (within the thickness of the printed symbol) for a value of lmax smaller than about 70. Consequently, we have carried out all our calculations for lmax = 70. That is, we have solved eqn (25) (in the nonlinear regime) and eqn (27) (in the linear regime) for l = 0…70, yielding the dimensionless surface potential  and thus, using eqn (21), the dimensionless potentials
  (with r ≤ R and −1 ≤ s ≤ 1) inside the spherical particle and
  (with r ≥ R and 0 ≤ s ≤ 1) in the air.
The main objective of the present work is to predict the apparent charge of the spherical particle on its air-exposed region. In addition to the bare charge, this renormalized charge contains a contribution from the electric field that penetrates through the particle's interior and determines the salt dependence of the long-ranged dipolar interactions among interface-trapped particles. For the planar capacitor approximation we have already defined in eqn (16) the apparent surface charge density σappa. In a similar manner we define the average apparent surface charge density
| |  | (29) |
of the air-exposed region for a spherical particle. Equivalently, we refer to
Qappa = 2π
R2σappa as the apparent total charge that the particle carries at its air-exposed region. With our particle radius
R = 50 nm this can be re-expressed as
| |  | (30) |
Hence, when measured in units of nC cm
−2, the numerical value of
σappa is almost identical to the total number of elementary charges that appear to be attached to the air-exposed region of the
R = 50 nm particle.
Fig. 5 shows two contour plots of the dimensionless electrostatic potential, calculated for particle radius R = 50 nm, Debye length lD = 5 nm, surface charge density at the water-exposed region of the particle σw = 3.2 μC cm−2 = 0.2 e nm−2, dielectric constant inside the particle εn = 2, and Ψ(b)w = 0. The two diagrams are computed for surface charge densities at the air-exposed particle region σa = 0 (left) and σa = 3.2 nC cm−2 = 0.0002 e nm−2 (right). At the water-exposed region, both particles possess an almost identical constant potential of Ψ0(s) = 4.36, which is slightly smaller than the prediction from the Poisson–Boltzmann model for a planar isolated surface Ψ0(s) = Ψ(b)w + 2![[thin space (1/6-em)]](https://www.rsc.org/images/entities/char_2009.gif) arsinh(
arsinh(![[small sigma, Greek, macron]](https://www.rsc.org/images/entities/i_char_e0d2.gif) w/2) = 4.37 (the close proximity is expected and, in fact, was our motivation for the expansion of the surface potential with respect to Hn, employed in the derivations of eqn (24) and (25)). At the air-exposed surface, however, Ψ0(s) adopts a minimum at s = 1 when σa = 0 (left), whereas it adopts a maximum at s = 1 when σa = 3.2 nC cm−2 (right). These differences result from the interplay between the charges attached to the water-exposed and air-exposed faces of the particle and the vanishing potential at the air–water interface. This interplay is also reflected in the apparent surface charge densities at the air-exposed region, for which we obtain according to eqn (29)σappa = 3.6 nC cm−2 (left) and σappa = 5.9 nC cm−2 (right). We can thus state that, according to eqn (30), the ≈3200 charges attached to the water-exposed region of the particle cause an increase in the number of apparent charges on the air-exposed particle region from zero to 3.6 for the left diagram in Fig. 5 and from 3.2 to 5.9 for the right diagram in Fig. 5. Of course, an isolated consideration of the two arbitrarily selected systems in Fig. 5 does not yield a systematic understanding of the relation between σa and σappa. In the following we provide a more comprehensive analysis.
w/2) = 4.37 (the close proximity is expected and, in fact, was our motivation for the expansion of the surface potential with respect to Hn, employed in the derivations of eqn (24) and (25)). At the air-exposed surface, however, Ψ0(s) adopts a minimum at s = 1 when σa = 0 (left), whereas it adopts a maximum at s = 1 when σa = 3.2 nC cm−2 (right). These differences result from the interplay between the charges attached to the water-exposed and air-exposed faces of the particle and the vanishing potential at the air–water interface. This interplay is also reflected in the apparent surface charge densities at the air-exposed region, for which we obtain according to eqn (29)σappa = 3.6 nC cm−2 (left) and σappa = 5.9 nC cm−2 (right). We can thus state that, according to eqn (30), the ≈3200 charges attached to the water-exposed region of the particle cause an increase in the number of apparent charges on the air-exposed particle region from zero to 3.6 for the left diagram in Fig. 5 and from 3.2 to 5.9 for the right diagram in Fig. 5. Of course, an isolated consideration of the two arbitrarily selected systems in Fig. 5 does not yield a systematic understanding of the relation between σa and σappa. In the following we provide a more comprehensive analysis.
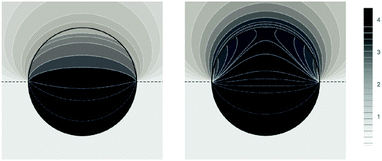 |
| | Fig. 5 Contour plots of the dimensionless electrostatic potential, calculated for σa = 0 (left) and σa = 3.2 nC cm−2 = 0.0002 e nm−2 (right). Both plots are computed for a particle radius R = 50 nm, Debye length lD = 5 nm, surface charge density at the water-exposed region of the particle σw = 3.2 μC cm−2 = 0.2 e nm−2, dielectric constant inside the particle εn = 2, and vanishing potential difference Ψ(b)w = 0 between bulk water and air. Darker shading corresponds to a more positive dimensionless potential Ψ as marked in the legend. | |
In Fig. 6 we show the results of a detailed analysis of σappa as function of εn for eleven different choices of σa in each diagram. All results in Fig. 6 refer to a Debye screening length lD = 5 nm (that is, a 4 mM salt concentration in the aqueous medium). Each diagram corresponds to a specific combination of σw and Ψ(b)w, with σw = 0 in the left column and σw = 3.2 μC cm−2 in the right column, as well as Ψ(b)w = −2 in the upper row of diagrams, Ψ(b)w = 0 in the middle row, and Ψ(b)w = +2 in the bottom row. All solid lines refer to calculations based on the nonlinear Poisson–Boltzmann model; see eqn (25). The dashed lines, visible only in the right column of diagrams are computed for the linearized Debye–Hückel model; see eqn (27). On the left column of diagrams, the dashed lines coincide with the solid lines and are thus not visible individually. In the limit εn = 0 there is no interaction between the air- and water-exposed regions of the particle, implying σappa = σa. Hence, the value of σa for which each curve in Fig. 6 is derived corresponds to the value of σappa at εn = 0. Note also that the two specific systems represented in Fig. 5 are marked in Fig. 6 by the symbol ●.
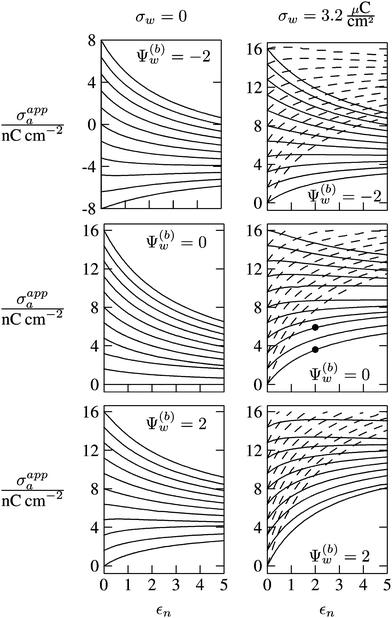 |
| | Fig. 6 Apparent charge density σappa at the air-exposed surface of a spherical particle as function of the particle's dielectric constant εn. Solid and dashed lines correspond, respectively, to results in the nonlinear Poisson–Boltzmann and the linear Debye–Hückel regimes. Different curves in each diagram refer to different σa = σappa(εn = 0). The two columns of diagrams are computed for σw = 0 (left) and σw = 3.2 μC cm−2 (right); the three rows refer to Ψ(b)w = −2 (top), Ψ(b)w = 0 (middle), and Ψ(b)w = 2 (bottom). All results are derived for R = 50 nm and lD = 5 nm. The two bullets in the middle-right diagram refer to the contour plots displayed in Fig. 5. | |
Let us now discuss the findings in Fig. 6. Consider first the middle diagram on the left column, derived for σw = 0 and Ψ(b)w = 0. For σa = 0 the particle is completely uncharged, the potential is zero everywhere, and thus σappa = 0 for any choice of εn. For σa > 0 the apparent value σappa decreases with growing εn because a part of the electric field propagates through the inside of the particle and interacts with negative charges in the aqueous solution that are polarized at the water-exposed region of the particle. This is more favorable than passing exclusively through the air and interacting with negative charges in the aqueous solution that are polarized at the air–water interface. We note that the ratio σappa/σa reaches 50% roughly at εn ≈ 4. We also note that the potential inside the aqueous phase, which is only caused by the few charges at the air-exposed region of the particle, is small so that it practically makes no difference to use the linear Debye–Hückel model or the nonlinear Poisson–Boltzmann approach.
Next, we consider the middle diagram on the right column, derived for σw = 3.2 μC cm−2 and Ψ(b)w = 0. For σa = 0 all charges carried by the particle (about 3200) are attached to the water-exposed region. These charges are very effectively screened by the mobile salt ions in the aqueous solution, which are present with a bulk concentration of 4 mM. However, as εn grows, a small (but increasing) part of the electric field produced by σw is able to propagate through the particle interior into the air and thus appears as an apparent charge density σappa. For example, at εn = 2, we find σappa = 3.6 nC cm−2, corresponding to an apparent number of 3.6 elementary charges attached to the air-exposed particle region. This, in fact is the example already presented in Fig. 5 (left diagram) and marked by the lower of the two bullets in the middle-right diagram of Fig. 6. Although few in number, these apparent charges are unscreened and thus highly effective in influencing the long-ranged interactions between interface-trapped particles. As σa grows, the increase in σappa(εn) becomes weaker and eventually reverses into a decreasing function. Indeed, with growing σa the particle-propagating part of the electric field produced by the air-exposed charges becomes stronger and eventually reverses the direction of the total electric field in the particle interior. The reversal occurs roughly at σa = 12 nC cm−2. At this particular combination of charge densities – about 3200 charges at the water-exposed region and 12 charges at the air-exposed region of the particle – the dielectric constant εn becomes practically irrelevant and thus does not affect the interactions between interface-trapped particles. It is one of the central conclusions of the present work that the ability of the electric field to propagate into the particle interior can enhance or diminish the interaction strength of particles at the air–water (and similar for oil–water) interface. That is, already a few air-exposed charges will reverse the direction of the electric field inside the particle and thus qualitatively change the influence of the particle's dielectric constant on the long-ranged particle–particle interactions.
As pointed out in the Introduction, sign and magnitude of the change in electrostatic potential upon crossing from air into bulk water have received significant attention in recent years.27–31 The implications of this potential difference on the electrostatic properties of interface-trapped particles, however, have not been analyzed previously. We have therefore incorporated the presence of an arbitrary bulk potential Ψ(b)w into our theoretical approach (recall that Ψ(b)w denotes the difference of the dimensionless electrostatic potential in bulk water and in air, both far away from the air–water interface). Note that we have not introduced an additional change in potential when passing from the interior of the particle into the aqueous medium. In fact, there is no need to introduce such an additional change in potential if we interpret Ψ(b)w as the difference in the change of the (dimensionless) electrostatic potential at the bare air–water interface and particle–water interface. We do not know the sign and magnitude of Ψ(b)w but we can analyze its general impact on σappa. This is shown in the upper and lower rows of Fig. 6 for Ψ(b)w = −2 and Ψ(b)w = 2, respectively. Our motivation to use the specific magnitude |Ψ(b)w| = 2 for the displayed examples goes back to a suggestion of Gehring and Fischer.30 Yet, we emphasize that the actual value and sign of Ψ(b)w remain a matter of debate. A negative value of Ψ(b)w mimics the presence of additional negative charges at the water-exposed region of the particle, implying more negative slope of the function σappa(εn). This is most clearly seen for the case σw = σa = 0, where the increase of εn from 0 to 2 changes σappa from 0 to about −1.8 nC cm−2; see the upper-left diagram of Fig. 6. Hence, even a completely uncharged particle carries a small apparent negative charge on its air-exposed face. All curves (solid lines) in the two top and two bottom diagrams of Fig. 6 can be rationalized by translating a negative or positive bulk potential Ψ(b)w into, respectively, an additional negative or positive charge at the water-exposed particle region. We add two comments. First, changing the magnitude of |Ψ(b)w| from 0 to 2 (which corresponds to a change of 50 mV) typically causes Qappa to adjust by 2–5 elementary charges for a fixed εn in the region 2 < εn < 5. Second, the relation σappa(εn) can pass through a local maximum (which, however, is not very pronounced). This implies that, perhaps somewhat unexpectedly, the apparent charge Qappa may be observed to first increase and then decrease as function of increasing εn.
We have carried out calculations of σappa on the basis of the nonlinear Poisson–Boltzmann model (solid lines in Fig. 6) and the linearized Debye–Hückel approximation (dashed lines in Fig. 6). For σw = 0 (left column of diagrams in Fig. 6) both models yield virtually identical results, but for σw = 3.2 μC cm−2 (right column of diagrams in Fig. 6) this is no longer the case. Indeed, the surface potential at the water-exposed region of the particle is only slightly smaller than 4.37, implying that the linearization of the Poisson–Boltzmann equation is a poor approximation and, in fact, overestimates the magnitude of the surface potential.33 Hence, in the linearized model, we expect the more positive surface potential at the water-exposed particle region to cause a larger σappa than the nonlinear model predicts, and this is indeed what we observe in Fig. 6. Despite this overestimation, however, the qualitative nature of the results for σappa is preserved in the linear Debye–Hückel approximation; this includes the reversal of the slope of the function σappa(εn) for sufficiently large σa as can be observed directly in the top-right diagram of Fig. 6 (at about σa = 16 nC cm−2).
Numerical results like those in Fig. 6 are computed for a specific set of parameters, of which some are kept constant and others varied across a small set of discrete values. Analytic expressions offer the advantage of allowing a systematic analysis and hence a clearer understanding of the relationships between parameters. In Section 2.1 we have proposed a planar capacitor approximation and derived a simple expression for σappa; see eqn (16) (as well as eqn (17) for large σw and eqn (19) for small σw). Recall that the planar capacitor approximation is based on representing the interface-trapped spherical particle by the geometry of a planar capacitor; see Fig. 2. In Fig. 7 we present predictions for σappa as function of εn according to the planar capacitor approximation for exactly the same set of parameters as in Fig. 6. Here too, solid lines refer to nonlinear Poisson–Boltzmann theory (calculated using eqn (16)), whereas the dashed lines correspond to the linear Debye–Hückel limit (calculated using eqn (19)). A comparison of Fig. 6 and 7 reveals good qualitative agreement. This includes (i) the slope-reversion of σappa (that is, σappa being a decreasing function for sufficiently large σa and an increasing function for sufficiently small σa), (ii) the down-shift of the point where the slope-reversion occurs for negative Ψ(b)w and its up-shift for positive Ψ(b)w, (iii) the excellent agreement between the nonlinear and linear models for σw = 0, and (iv) the overestimation of σappa for large σw when comparing the linear and nonlinear models. There are also notable differences between Fig. 6 and 7. First, the dependence of σappa on εn tends to be stronger in the planar capacitor approximation as compared to the spherical geometry. For example, for σw = 0, Ψ(b)w = 0, σa = 16 nC cm−2, and εn = 5 our calculations predict σappa = 7 nC cm−2 for spherical geometry and σappa = 3 nC cm−2 for the planar capacitor approximation. A second difference is the lack of any local maxima of the function σappa(εn). Instead, at one specific value for σa (the slope-reversion point) the function σappa(εn) becomes independent of εn; the corresponding locations are marked by pairs of open circles in Fig. 7 (the two pairs of open circles on the diagrams refer to the nonlinear and linear models). From eqn (16) we find the condition σappa = σa to be fulfilled for
| |  | (31) |
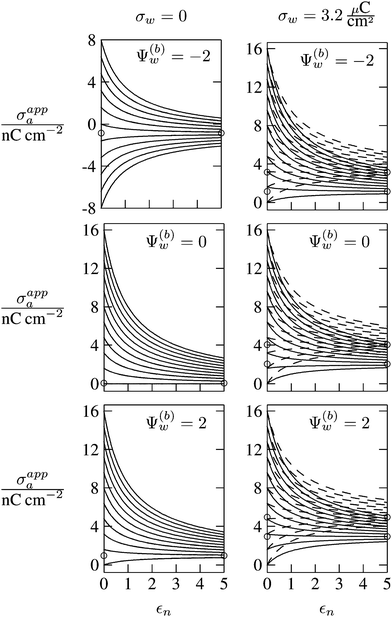 |
| | Fig. 7 Apparent surface charge density σappa at the air-exposed surface as function of εn according to the planar capacitor approximation, calculated according to eqn (16) (solid lines) on the level of nonlinear Poisson–Boltzmann theory and according to eqn (19) (dashed lines) in the linear Debye–Hückel limit. All results are computed for exactly the same set of parameters as in Fig. 6. Specifically, different curves in each diagram refer to different σa = σappa(εn = 0). The two columns of diagrams are computed for σw = 0 (left) and σw = 3.2 μC cm−2 (right); the three rows refer to Ψ(b)w = −2 (top), Ψ(b)w = 0 (middle), and Ψ(b)w = 2 (bottom). All results are derived for R = 50 nm and lD = 5 nm. | |
This marks the point where for εn = 0 the potential produced by σa at the air-exposed surface is equal to the potential produced by σw at the water-exposed surface. The electrostatic properties of the air-exposed and water-exposed regions are then decoupled and thus do not depend on εn. A similar rationale applies to the slope reversion of spherical particles observed in Fig. 6.
As discussed in the Introduction, experimental investigations of how the salt concentration in the aqueous medium affects the observed long-ranged repulsive forces between interface-trapped colloidal particles have not led to conclusive results. A number of studies suggest the interaction is insensitive to the salt concentration,13,35,36 while others report a weak dependence.20–23,37 Note that the force between two interface-trapped particles is proportional to the square of the apparent surface charge density σappa, which depends on the salt concentration. In Fig. 8 we display the dependence of σappa on the Debye screening length lD for spherical particle geometry (left diagrams) and for the planar capacitor approximation (right diagrams). The two sets of curves in each diagram (σa = 0 for dashed lines in upper diagrams, σa = 3.2 nC cm−2 for solid lines in upper diagrams, σa = 16 nC cm−2 for dashed lines in lower diagrams, and σa = 32 nC cm−2 for solid lines in lower diagrams) refer to εn = 0 (symbol ○), εn = 1 (◁), εn = 2 (●), εn = 5 (▷). We have placed the symbols ○, ◁, ●, ▷ at the position lD = 5 nm, which corresponds to the results in Fig. 6 and 7. Note that for spherical geometry we only consider Debye lengths up to lD = 10 nm to ensure lD ≪ R.
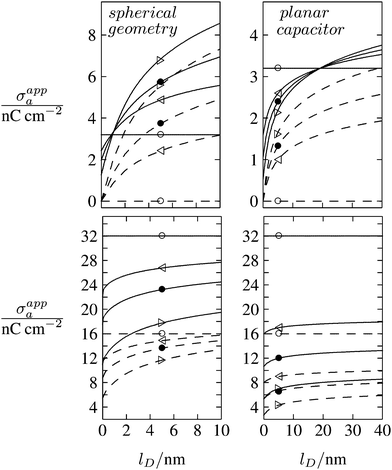 |
| | Fig. 8 Apparent surface charge density σappa at the air-exposed particle region as function of the Debye screening length lD for fixed σw = 3.2 μC cm−2, R = 50 nm, and Ψ(b)w = 0. Dashed and solid lines in the upper two diagrams refer to σa = 0 and σa = 3.2 nC cm−2, respectively. Dashed and solid lines in the lower two diagrams refer to σa = 16 nC cm−2 and σa = 32 nC cm−2, respectively. Left and right diagrams correspond, respectively, to calculations for the spherical geometry (see Section 2.2) and the planar capacitor approximation (see Section 2.1). The four different curves for each set are derived for εn = 0 (symbol ○), εn = 1 (◁), εn = 2 (●), εn = 5 (▷). We have placed the symbols at position lD = 5 nm, for which all calculations in Fig. 6 and 7 were carried out. | |
All curves in Fig. 8 indicate nondecreasing behavior of σappa as function of lD. That is, adding salt is never predicted to increase the apparent particle charge (yet, it could do so in the hypothetical case that the bare charge densities σa and σw were of different sign). Let us discuss decreasing the salt concentration from 100 mM (lD = 1 nm) to 1 mM (lD = 10 nm) for a particle of dielectric constant εn = 5. For σa = 0 this induces an increase of σappa from 2.0 nC cm−2 to 7.3 nC cm−2 and thus a 13.5-fold increase in the force between two particles (the force increase calculated within the planar capacitor approximation is 13.1). For large σa the absolute increase in σappa is similar but the relative increase in the force is much lower. For example, σa = 32 nC cm−2 leads to an increase in σappa from 14.1 nC cm−2 to 19.5 nC cm−2, implying a 1.9-fold increase of the force (and a 1.6-fold increase predicted by the planar capacitor approximation). Because the planar capacitor model makes reasonable predictions, we may insert the parameters used in our specific example into eqn (17) (namely σw = 3.2 μC cm−2, R = 50 nm, lB = 56 nm, εa = 1, εw = 80, εn = 5, and Ψ(0)w = 0), yielding
| | σappa = c1σa + c2![[thin space (1/6-em)]](https://www.rsc.org/images/entities/char_2009.gif) ln(c3lD), ln(c3lD), | (32) |
with
c1 = 0.17,
c2 = 0.75 nC cm
−2, and
c3 = 1.76/nm. Such a relation could, in principle, be used to estimate the bare charge density
σa from the measured salt-dependence of the force between interface-trapped particles.
To be specific, we attempt to model the salt concentration dependence of the force F ∼ (σappa)2/r4 between charge-stabilized polystyrene particles (R = 1.5 μm, εn = 2.5, σw = 9.1 μC cm−2) at a decane–water interface (εa = 2.0, εw = 80) as measured by Park et al.23 For this system we obtain c1 = 0.44, c2 = 2.03 × 10⁻⁶ nC cm−2, and c3 = 5.0/nm. Decreasing the salt concentration from 1 mM (implying l(1)D = 10 nm) to 0.01 mM (implying l(2)D = 100 nm) at a particle-to-particle separation of r = 9 μm was reported to increase the force from about F1 = 0.2 pN to about F2 = 0.6 pN. Using the dependence of the force F on σappa together with eqn (32) yields
| |  | (33) |
This (very rough) estimate predicts the surface charge density at the oil-exposed region of the particle to be 150
![[thin space (1/6-em)]](https://www.rsc.org/images/entities/char_2009.gif)
000 times smaller than that at the water-exposed region. This implies the particle carries a total of about 50 elementary charges on its oil-exposed surface.
We finally point out that in Fig. 6 we had discussed the possibility of adjusting σa to render σappa virtually independent of εn. Fig. 8 reveals that this may also be accomplished by adjusting the salt concentration. For example for σa = 3.2 nC cm−2 (see the upper left diagram in Fig. 8) the solid lines all intersect in a region close to lD = 1 nm, implying σappa does not depend on εn. Note that the planar capacitor approximation also predicts such a point, yet fails to correctly predict the corresponding salt concentration.
4 Conclusion
This work has studied the electrostatic properties of a spherical nanoparticle with dielectric constant εn, trapped at an air–water interface using mean-field electrostatics. Our specific goal was to characterize how the interplay between the electrostatic properties in the aqueous medium and in the air influence each other and may lead to the observed weak salt dependence of long-ranged dipolar forces that stabilize ordered arrays of particles at dielectric interfaces. We have expressed this interplay by introducing an apparent surface charge density σappa of the nanoparticle at its air-exposed region. Indeed, the apparent surface charge density is generally different from the bare surface charge density σa at the air-exposed region. The difference arises from the ability of the electric field to propagate through the particle interior; this may either enhance or diminish σappa, depending on how large the surface charge density σw of the particle at its water-exposed region is and how effectively salt ions in the aqueous medium screen these charges. For a particle size of 100 nm with several thousands of charges attached to the water-facing side, decreasing the salt concentration from 100 mM to 1 mM increases the apparent number of elementary charges at the air-exposed region by only a few. Yet, these charges are unscreened and thus very effective in modulating long-ranged dipolar interactions between particles. If the bare charge density σa on the air-exposed face of the particle amounts to not many more than those added apparent charges, a salt dependence should be observable experimentally. In fact the salt dependence may then be used to estimate σa in the first place. In order to facilitate calculations, we have introduced a simple planar capacitor approximation that allows to calculate an estimate of σappa analytically. Note that our theoretical model makes significant approximations that we have adopted to simplify the mathematical formalism. They include equatorial partitioning of the particle and a constant electrostatic potential at the air–water interface. Note also that we have focused only on electrostatic interactions; capillary forces may further affect interactions between interface-trapped particles if the particles are sufficiently large. In addition, we have ignored ion-specific effects, which have been suggested to modify the salt concentration dependence of the interaction between interfacially trapped colloids.20,37 Interface-induced solvent polarization, which may further modulate this dependence,38 is approximately accounted for in our model through Ψ(b)w.
Acknowledgements
G. V. B. acknowledges a doctoral scholarship from CAPES Foundation/Brazil Ministry of Education (Grant No. 9466/13-4).
References
- C. Duclairoir, A.-M. Orecchioni, P. Depraetere, F. Osterstock and E. Nakache, Int. J. Pharm., 2003, 253, 133–144 CrossRef CAS PubMed.
- R. Aveyard, B. P. Binks and J. H. Clint, Adv. Colloid Interface Sci., 2003, 100, 503–546 CrossRef.
-
P. M. Ajayan, L. S. Schadler and P. V. Braun, Nanocomposite science and technology, John Wiley & Sons, 2006 Search PubMed.
- K. C. Krogman, T. Druffel and M. K. Sunkara, Nanotechnology, 2005, 16, S338 CrossRef PubMed.
- J. Hiller, J. D. Mendelsohn and M. F. Rubner, Nat. Mater., 2002, 1, 59–63 CrossRef CAS PubMed.
- F. H. Stillinger Jr, J. Chem. Phys., 1961, 35, 1584–1589 CrossRef.
- P. Pieranski, Phys. Rev. Lett., 1980, 45, 569 CrossRef CAS.
- A. J. Hurd, J. Phys. A: Math. Gen., 1985, 18, L1055 CrossRef CAS.
- A. E. Nel, L. Mädler, D. Velegol, T. Xia, E. M. Hoek, P. Somasundaran, F. Klaessig, V. Castranova and M. Thompson, Nat. Mater., 2009, 8, 543–557 CrossRef CAS PubMed.
- M. Lundqvist, J. Stigler, G. Elia, I. Lynch, T. Cedervall and K. A. Dawson, Proc. Natl. Acad. Sci. U. S. A., 2008, 105, 14265–14270 CrossRef CAS PubMed.
-
B. P. Binks and T. S. Horozov, Colloidal particles at liquid interfaces, Cambridge University Press, 2006 Search PubMed.
- M. Oettel and S. Dietrich, Langmuir, 2008, 24, 1425–1441 CrossRef CAS PubMed.
- R. Aveyard, B. Binks, J. Clint, P. Fletcher, T. Horozov, B. Neumann, V. Paunov, J. Annesley, S. Botchway and D. Nees,
et al.
, Phys. Rev. Lett., 2002, 88, 246102 CrossRef CAS PubMed.
- A. D. Law, M. Auriol, D. Smith, T. S. Horozov and D. M. A. Buzza, Phys. Rev. Lett., 2013, 110, 138301 CrossRef PubMed.
- K. D. Danov and P. A. Kralchevsky, J. Colloid Interface Sci., 2006, 298, 213–231 CrossRef CAS PubMed.
- K. D. Danov and P. A. Kralchevsky, J. Colloid Interface Sci., 2013, 405, 269–277 CrossRef CAS PubMed.
- K. D. Danov, P. A. Kralchevsky and M. P. Boneva, Langmuir, 2004, 20, 6139–6151 CrossRef CAS PubMed.
- S. Uppapalli and H. Zhao, Soft Matter, 2014, 10, 4555–4560 RSC.
- A. Majee, M. Bier and S. Dietrich, J. Chem. Phys., 2014, 140, 164906 CrossRef PubMed.
- C. L. Wirth, E. M. Furst and J. Vermant, Langmuir, 2014, 30, 2670–2675 CrossRef CAS PubMed.
- B. J. Park and E. M. Furst, Soft Matter, 2011, 7, 7676–7682 RSC.
- B. J. Park, J. Vermant and E. M. Furst, Soft Matter, 2010, 6, 5327–5333 RSC.
- B. J. Park, J. P. Pantina, E. M. Furst, M. Oettel, S. Reynaert and J. Vermant, Langmuir, 2008, 24, 1686–1694 CrossRef CAS PubMed.
- D. Frydel, S. Dietrich and M. Oettel, Phys. Rev. Lett., 2007, 99, 118302 CrossRef PubMed.
- A. Dominguez, D. Frydel and M. Oettel, Phys. Rev. E: Stat., Nonlinear, Soft Matter Phys., 2008, 77, 020401 CrossRef CAS PubMed.
- M. Girotto, A. P. dos Santos and Y. Levin, J. Phys. Chem. B, 2015 DOI:10.1021/acs.jpcb.5b10105.
- V. Buch, A. Milet, R. Vácha, P. Jungwirth and J. P. Devlin, Proc. Natl. Acad. Sci. U. S. A., 2007, 104, 7342–7347 CrossRef CAS PubMed.
- J. K. Beattie, A. M. Djerdjev and G. G. Warr, Faraday Discuss., 2009, 141, 31–39 RSC.
- M. Paluch, Adv. Colloid Interface Sci., 2000, 84, 27–45 CrossRef CAS PubMed.
- T. Gehring and T. M. Fischer, J. Phys. Chem. C, 2011, 115, 23677–23681 CAS.
- S. M. Kathmann, I. F. W. Kuo and C. J. Mundy, J. Am. Chem. Soc., 2008, 130, 16556–16561 CrossRef CAS PubMed.
-
J. D. Jackson, Classical Electrodynamics, Wiley, New York etc., 1962, vol. 3 Search PubMed.
-
S. May, in Encyclopedia of Surface and Colloid Science, ed. P. Somasundaran, Taylor and Francis, 2nd edn, 2012, ch. 275, pp. 1–15 Search PubMed.
-
W. Byerly, An elementary treatise on Fourier's series: and spherical, cylindrical, and ellipsoidal harmonics, with applications to problems in mathematical physics, Dover Publications, New York, 1959 Search PubMed.
- R. Aveyard, J. H. Clint, D. Nees and V. N. Paunov, Langmuir, 2000, 16, 1969–1979 CrossRef CAS.
- T. S. Horozov, R. Aveyard, J. H. Clint and B. P. Binks, Langmuir, 2003, 19, 2822–2829 CrossRef CAS.
- K. Masschaele, B. J. Park, E. M. Furst, J. Fransaer and J. Vermant, Phys. Rev. Lett., 2010, 105, 048303 CrossRef PubMed.
- D. Frydel and M. Oettel, Phys. Chem. Chem. Phys., 2011, 13, 4109–4118 RSC.
|
| This journal is © The Royal Society of Chemistry 2016 |
Click here to see how this site uses Cookies. View our privacy policy here.  Open Access Article


 .
.
![[small sigma, Greek, macron]](https://www.rsc.org/images/entities/i_char_e0d2.gif) appa = 4πlBlDσappa/(eεw), which we can compute according to eqn (12) through
appa = 4πlBlDσappa/(eεw), which we can compute according to eqn (12) through ![[small sigma, Greek, macron]](https://www.rsc.org/images/entities/i_char_e0d2.gif) appa =
appa = ![[small sigma, Greek, macron]](https://www.rsc.org/images/entities/i_char_e0d2.gif) a + HnRΨn′(−R), or equivalently using eqn (13),
a + HnRΨn′(−R), or equivalently using eqn (13), ![[small sigma, Greek, macron]](https://www.rsc.org/images/entities/i_char_e0d2.gif) appa = HaΨ(a)0. Hence, the surface potential at the air-exposed region of the nanoparticle determines the apparent surface charge density (in units of the elementary charge e)
appa = HaΨ(a)0. Hence, the surface potential at the air-exposed region of the nanoparticle determines the apparent surface charge density (in units of the elementary charge e)
![[small sigma, Greek, macron]](https://www.rsc.org/images/entities/i_char_e0d2.gif) w ≫ 1, we obtain
w ≫ 1, we obtain
![[small sigma, Greek, macron]](https://www.rsc.org/images/entities/i_char_e0d2.gif) a = 0, and εn = εa, eqn (16) reduces to σappa = εa
a = 0, and εn = εa, eqn (16) reduces to σappa = εa![[thin space (1/6-em)]](https://www.rsc.org/images/entities/char_2009.gif) ln(
ln(![[small sigma, Greek, macron]](https://www.rsc.org/images/entities/i_char_e0d2.gif) w)/(4πlBR), which is smaller by a factor of four than the prediction for the renormalized surface charge density at the particle-air interface that Oettel and Dietrich12 have derived.
w)/(4πlBR), which is smaller by a factor of four than the prediction for the renormalized surface charge density at the particle-air interface that Oettel and Dietrich12 have derived.
![[small sigma, Greek, macron]](https://www.rsc.org/images/entities/i_char_e0d2.gif) w ≪ 1 is sufficiently small. This case corresponds to the linear Debye–Hückel limit of Poisson–Boltzmann theory, leading to
w ≪ 1 is sufficiently small. This case corresponds to the linear Debye–Hückel limit of Poisson–Boltzmann theory, leading to


![[thin space (1/6-em)]](https://www.rsc.org/images/entities/char_2009.gif) θ is the cosine of the angle with respect to the direction normal to the air–water interface, and Al and Bl are yet to be determined sets of constants. Note that Ψn(r,s) is defined for 0 ≤ r ≤ R and −1 ≤ s ≤ 1. Similarly, Ψa(r,s) is defined for r ≥ R and 0 ≤ s ≤ 1. Because we require the potential at the air–water interface Ψa(r > R, s = 0) = 0 to vanish, the sum in eqn (20) runs only over uneven Legendre polynomials. Continuity Ψa(R,s) = Ψn(R,s) at the air-exposed region of the particle, i.e. for 0 ≤ s ≤ 1, must allow us to express the coefficients Al and Bl in terms of a single set of coefficients that we denote by Cl. Indeed continuity is ensured by choosing
θ is the cosine of the angle with respect to the direction normal to the air–water interface, and Al and Bl are yet to be determined sets of constants. Note that Ψn(r,s) is defined for 0 ≤ r ≤ R and −1 ≤ s ≤ 1. Similarly, Ψa(r,s) is defined for r ≥ R and 0 ≤ s ≤ 1. Because we require the potential at the air–water interface Ψa(r > R, s = 0) = 0 to vanish, the sum in eqn (20) runs only over uneven Legendre polynomials. Continuity Ψa(R,s) = Ψn(R,s) at the air-exposed region of the particle, i.e. for 0 ≤ s ≤ 1, must allow us to express the coefficients Al and Bl in terms of a single set of coefficients that we denote by Cl. Indeed continuity is ensured by choosing


 with −1 ≤ s ≤ 1.


![[small sigma, Greek, macron]](https://www.rsc.org/images/entities/i_char_e0d2.gif) n and
n and ![[small sigma, Greek, macron]](https://www.rsc.org/images/entities/i_char_e0d2.gif) a. Also,
a. Also,  as previously defined. We point out that the first and second line in eqn (24) apply to 0 ≤ s ≤ 1 and −1 ≤ s ≤ 0, respectively. Because eqn (24) are linear in the dimensionless potentials, we can use Ψn(r,s) and Ψa(r,s) from eqn (20) together with the coefficients in eqn (21) to extract the following linear system of equations
 for any non-negative integer m, which amounts to34
 , where δmn denotes the Kronecker delta, and symmetry
  of the Legendre polynomials.
 , converges to Fel(lmax → ∞) up to a certain numerical accuracy. Recall that Fel is fully determined by the surface potential; see eqn (9). For spherical particle geometry, eqn (9) reads
![[thin space (1/6-em)]](https://www.rsc.org/images/entities/char_2009.gif) arsinh(
arsinh(![[small sigma, Greek, macron]](https://www.rsc.org/images/entities/i_char_e0d2.gif) w/2) =
w/2) = ![[small sigma, Greek, macron]](https://www.rsc.org/images/entities/i_char_e0d2.gif) w, and the system of equations, eqn (25), reads
w, and the system of equations, eqn (25), reads

 and thus, using eqn (21), the dimensionless potentials
  (with r ≤ R and −1 ≤ s ≤ 1) inside the spherical particle and
  (with r ≥ R and 0 ≤ s ≤ 1) in the air.

![[thin space (1/6-em)]](https://www.rsc.org/images/entities/char_2009.gif) arsinh(
arsinh(![[small sigma, Greek, macron]](https://www.rsc.org/images/entities/i_char_e0d2.gif) w/2) = 4.37 (the close proximity is expected and, in fact, was our motivation for the expansion of the surface potential with respect to Hn, employed in the derivations of eqn (24) and (25)). At the air-exposed surface, however, Ψ0(s) adopts a minimum at s = 1 when σa = 0 (left), whereas it adopts a maximum at s = 1 when σa = 3.2 nC cm−2 (right). These differences result from the interplay between the charges attached to the water-exposed and air-exposed faces of the particle and the vanishing potential at the air–water interface. This interplay is also reflected in the apparent surface charge densities at the air-exposed region, for which we obtain according to eqn (29)σappa = 3.6 nC cm−2 (left) and σappa = 5.9 nC cm−2 (right). We can thus state that, according to eqn (30), the ≈3200 charges attached to the water-exposed region of the particle cause an increase in the number of apparent charges on the air-exposed particle region from zero to 3.6 for the left diagram in Fig. 5 and from 3.2 to 5.9 for the right diagram in Fig. 5. Of course, an isolated consideration of the two arbitrarily selected systems in Fig. 5 does not yield a systematic understanding of the relation between σa and σappa. In the following we provide a more comprehensive analysis.
w/2) = 4.37 (the close proximity is expected and, in fact, was our motivation for the expansion of the surface potential with respect to Hn, employed in the derivations of eqn (24) and (25)). At the air-exposed surface, however, Ψ0(s) adopts a minimum at s = 1 when σa = 0 (left), whereas it adopts a maximum at s = 1 when σa = 3.2 nC cm−2 (right). These differences result from the interplay between the charges attached to the water-exposed and air-exposed faces of the particle and the vanishing potential at the air–water interface. This interplay is also reflected in the apparent surface charge densities at the air-exposed region, for which we obtain according to eqn (29)σappa = 3.6 nC cm−2 (left) and σappa = 5.9 nC cm−2 (right). We can thus state that, according to eqn (30), the ≈3200 charges attached to the water-exposed region of the particle cause an increase in the number of apparent charges on the air-exposed particle region from zero to 3.6 for the left diagram in Fig. 5 and from 3.2 to 5.9 for the right diagram in Fig. 5. Of course, an isolated consideration of the two arbitrarily selected systems in Fig. 5 does not yield a systematic understanding of the relation between σa and σappa. In the following we provide a more comprehensive analysis.


![[thin space (1/6-em)]](https://www.rsc.org/images/entities/char_2009.gif) ln(c3lD),
ln(c3lD),
![[thin space (1/6-em)]](https://www.rsc.org/images/entities/char_2009.gif) 000 times smaller than that at the water-exposed region. This implies the particle carries a total of about 50 elementary charges on its oil-exposed surface.
000 times smaller than that at the water-exposed region. This implies the particle carries a total of about 50 elementary charges on its oil-exposed surface.


