Enhancing internal mass transport in Fischer–Tropsch catalyst layers utilizing transport pores†
Received
25th June 2015
, Accepted 3rd September 2015
First published on 7th September 2015
Abstract
Internal mass transport limitations inside Fischer–Tropsch catalysts due to the slow diffusion of reactants in the liquid-filled pores may significantly alter the selectivity and achievable productivity. In this work, diffusive restrictions for planar catalyst layers were investigated by mathematical modeling and simulation. A one-dimensional model utilizing empirical kinetics, incorporating transport pores as an additional pathway for mass transport and taking into account heat production, allows for calculation of catalyst efficiency and productivity towards C5+ products. As diffusional mass transport leads to strong concentration gradients that impair selectivity, an optimum layer thickness with maximum C5+ productivity can be found. Additional transport pores enhance the mass transport but reduce the amount of active phase, which requires a trade-off by optimizing the fraction of transport pores and layer thickness. For reference conditions, the catalyst layer with an ideal amount of transport pores and ideal thickness exhibits a productivity that is about 47% higher than that for the best layer without transport pores. This improvement requires transport pores with diameters not larger than about 60 μm. While the improvement potential significantly depends on the effective diffusivities, the effect of heat generation was found to be negligible.
Introduction
Conversion of synthesis gas in low-temperature Fischer–Tropsch (FT) reaction yields a broad spectrum of hydrocarbons that can be used for various further applications such as the production of diesel fuels. An efficient process requires a high selectivity to long-chain hydrocarbons over the commonly used cobalt-based catalysts.1 Thus, products with high carbon numbers remain in liquid phase under the reaction conditions. Consequently, reactors for the low-temperature FT process must be suitable for the resulting three-phase system2 with fixed-bed reactors and slurry bubble columns being commercially established.3,4 Considering diffusion limitations, pressure drop and thermal behavior, the dimensions of catalyst pellets and tubes have to be optimized for conventional fixed-bed reactors.5,6 A further option is the use of micro-packed bed reactors, which are beneficial due to increased heat removal at moderate pressure drop.7 In reactors of this type, highly active catalysts exhibit excellent performance,8 but depending on the catalyst particle size, one can either improve the pressure drop9,10 or the mass transport. Micro-structured reactors with a wall coating of a catalyst offer an extraordinarily low pressure drop and high catalyst efficiency but suffer from low catalyst inventory and therefore low reactor productivity.11 The low catalyst inventory results from diffusion limitations that restrict the thickness of the catalyst coating.12,13 Diffusion inside the FT catalyst is slow due to the liquid products that remain inside the pores of the catalyst during the reaction.14 Moreover, these severe internal mass transport effects do not only retard the reaction but also hamper selectivity.15–19
Different approaches have been made to deal with the restrictions in catalyst size caused by limited diffusion length. To achieve a low diffusion length, the use of eggshell catalysts or structured packings and open foams as catalyst supports was proposed.20–23 This reduces the negative impact of internal diffusion limitations, results in a low pressure drop and, especially for foams and packings, also good heat removal. Nonetheless, these approaches suffer from low catalyst inventory and do not directly enhance internal mass transport. For improvement of the diffusive transport inside the catalyst, a bimodal pore structure can be used. Xu et al.24 compared experimental results from FT synthesis with a mathematical model, indicating that a bimodal catalyst gives rise to high activity at low diffusion resistance.24
Since diffusion occurs in a porous system, the shape and size of the pores are crucial for a productive catalyst. On the one hand, small pores of the catalyst support are necessary in order to obtain catalysts with high activity,25–28 since small pores confine the cobalt species to nanometer-sized particles with high specific surface areas. On the other hand, diffusion becomes very slow in liquid-filled catalyst support pores of small size, as shown by Preising and Enke29 for porous glasses. This can be attributed to restricted diffusion as a result of a solute with a critical molecular diameter in the range of the pore diameter.30–34 This pore size effect is similar to the well-known Knudsen diffusion regime during gas-phase mass transport. Although a comprehensive, exact matching correlation for the description of these effects could not yet be developed, the work of the abovementioned authors emphasizes that nanometer-sized pores additionally hinder diffusion in the liquid phase. Therefore, optimized catalyst designs require larger pores to improve the accessibility of the catalyst for the reactants in addition to smaller pores providing high surface area and activity.
Different approaches to describe the effect of pore structures on effective diffusion are reported in the literature. From general analytical solutions of simplified models for bidisperse systems35,36 or fractal pore models37,38 to numerical approaches regarding three-dimensional pore networks,39,40 catalyst efficiency depends on effective diffusivity and thus on structural parameters like tortuosity or pore connectivity.41 Although these parameters can be measured,42,43 the validity, especially for tortuosity, under the reaction conditions is not necessarily given. A three-dimensional multiscale simulation approach tries to avoid these uncertainties by starting with a nanometer scale model to evaluate the effective diffusivities for a mesoporous structure, which can then be used for further simulation of effective diffusivities and reaction rates on the micrometer scale. In the last step, these results are then applied to evaluate a reactor model. For CO oxidation, this approach by Pereira et al.44 leads to a good agreement between the experimental results and the simulation. But even here, the validity of effective diffusivities depends on the reliability of the nanoscopic structure. An optimization by Gheorghiu and Coppens45 of two-dimensional bimodal pore networks for a simple first-order gas-phase reaction illustrates the trade-off between ease of access and productivity, which depends on the pore fraction and pore size. It is shown that transport pores are especially interesting if diffusion in micro- and mesopores is slow due to Knudsen diffusion. Further systematic evaluation by Wang et al.46 and Johannessen et al.47 has revealed that uniform transport pore size and fraction can yield almost the same improvement as an optimized distribution of transport pores. These results obtained for simple first-order kinetics were applied to calculate the optimal porous structure of a catalyst layer for methane reforming,48 indicating a considerable increase in activity for a commercial catalyst.
In the present work, a simplified mathematical model is used to describe the effects of reactant diffusion in catalyst layers with small and large pores on the activity and selectivity of the FT reaction. Using the approach of Vervloet et al.18 for description of the chain growth probability as a function of reactant concentration and temperature, we have already shown that it is possible to find an ideal layer thickness, where the yield with respect to the desired products reaches a maximum.49 In the present paper, the optimization potential is analyzed in detail with respect to the effective diffusivities in the catalyst and the transport pore phase by adjusting the transport pore fraction. Furthermore, the relevance of temperature gradients and the maximum allowable transport pore diameter are evaluated. In other words, by applying realistic, experimentally based kinetics and transport parameters to optimization of the pore structure, we demonstrate how and up to what extent transport pores can enhance the productivity in Fischer–Tropsch synthesis.
Model description
The general idea is that transport pores inside a catalyst provide a bypass for diffusive transport of reactants inside the catalyst and thus improve the effective mass transport. However, since the volume fraction of transport pores does not contribute to the reaction, an increased transport pore fraction improves mass transport at the expense of a reduced amount of the catalytically active phase. This emphasizes the necessity of a compromise that has to take into account the reduced volume fraction of the active phase and the benefit of an improved mass transport.
The developed model is based on a planar geometry of a catalyst coated onto the wall of a microchannel reactor, but can also be applied to washcoated monoliths and eggshell catalysts, as long as the active catalyst layer remains thin. The catalyst layer is assumed to consist of a mesoporous active catalyst and cylindrical macropores denoted as transport pores.
Above the catalyst layer lies the free cross-section area of the channel. In order to investigate the effects of the diffusion in the catalyst and the transport pores only, axial convection and external mass transport are neglected. This leads to the assumption of constant reactant concentrations at the gas–solid boundary and simplifies the model to only one dimension (Fig. 1). Although this reduction to a differential reactor does not lead to results which could directly be compared to experimental data, it allows results with general significance to be derived, which are also applicable to different reactor concepts. For the solution of the model equations, gPROMS® ModelBuilder 4.0.0 of Process Systems Enterprise Ltd. was used. The transport equations were distributed over 50 elements using a second-order “orthogonal collocation on finite elements method” (OCFEM) for discretisation.
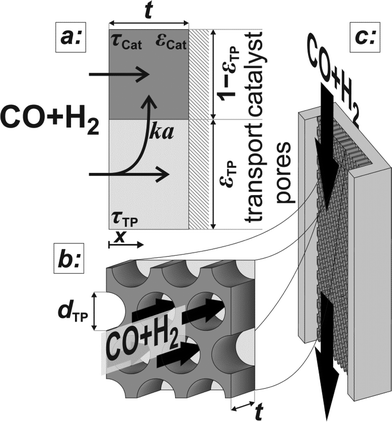 |
| | Fig. 1 Schematic of the catalyst layer with the porous catalyst and the transport pores as two separate phases: transport pathways inside the reference volume of the model (a), geometry of the cylindrical transport pores (b), and the microchannel reactor with the catalyst layer (c). | |
Transport equations
The reaction takes place on the active surface inside the catalyst. Therefore, the reactants, carbon monoxide and hydrogen, have to be transported into the catalyst layer. This diffusive transport occurs as a result of a concentration gradient between the gas–solid boundary and the depth of the catalyst. Since two types of pores concurrently contribute to diffusive mass transport but the reaction occurs on the active surface only, the catalyst phase and the transport pore phase must be distinguished within the catalyst layer. The volume fraction of the transport pores is defined by εTP. This virtual separation of the transport phase and the active phase is a main idea of the simulation approach (Fig. 1(a)).
The representative volume element for the mass balance is the whole catalyst layer (Fig. 1(a)) comprising the active and transport phases. Mass transport is described according to eqn (1) with a term considering the effective diffusion inside the catalyst and the transport pore phase, and a reaction term. As the transport pores are inert, the active catalyst fraction (1 − εTP) has to be considered for the reaction term. The diffusion term simplifies the original two-dimensional problem to a one-dimensional equation, accounting for the different effective diffusivities inside the catalyst and the transport pores. This effective one-dimensional model is valid as long as the transport pores are sufficiently small, thereby leading to the same concentration profiles in the catalyst and transport pores.47
| |  | (1) |
The effective diffusion is assumed to obey Fick's law which is modified with porosity and tortuosity. It has to be mentioned that the reference volume for the catalyst porosity is the catalyst phase, while that for the transport pore fraction is the whole catalyst layer. Thus, the sum of the transport pore fraction and catalyst porosity is not unity. The assumed reference values for porosity and the tortuosities are listed in Table 1. As the transport pores are cylindrical and parallel to the direction of the diffusion, the tortuosity of the transport pores equals one. This is an ideal assumption, since the transport pores of real catalyst layers will not easily exhibit such a simplified best case geometry. The reference tortuosity of the catalyst is assigned a value of 3, which is in the typical range.29,50 The supposed reaction kinetics in eqn (1) are dependent on the concentration of carbon monoxide and hydrogen; consequently, only these species are relevant for mass transport and needed to be considered for the boundary conditions (eqn (2) and (3)).
| |  | (2) |
| |  | (3) |
Table 1 Structural transport parameters of the active catalyst and the transport pore phase
| Parameter |
Value |
Unit |
|
ε
Cat
|
0.4 |
mpore3 mCat−3 |
|
τ
Cat
|
3 |
— |
|
τ
TP
|
1 |
— |
|
λ
eff
|
0.1 |
W m−1 K−1 |
Since the FT reaction is quite exothermic, the removal of heat may have a significant impact. Therefore, the heat balance was taken into account. The corresponding differential eqn (4) neglects the influence of a varying transport pore fraction on the effective thermal conductivity and incorporates the transport pore fraction only via the residual amount of catalyst (1 − εTP), which scales the heat source term.
| |  | (4) |
Similar to mass transport, the boundary conditions assume that all heat is removed through an isothermal wall and the heat flux to the gas boundary is zero (eqn (5) and (6)).
| |  | (6) |
For the reaction enthalpy, a value of 170 kJ molCO−1 was chosen, which is a quite high estimate compared to the literature.5,6,11,51 For the effective thermal conductivity, a value was chosen, which is significantly lower than the conductivities of the solid catalyst phase,48,52 the liquid phase,53 the gas phase in the Fischer–Tropsch reaction54 or the estimated effective bed conductivity.55 Hence, the chosen approach should give rise to a worst case assessment of possible heat transport effects.
Kinetics and selectivity
For the description of the CO consumption rate, an approach by Yates and Satterfield56 is used (eqn (7)), where a temperature dependence analogous to the Arrhenius equation as proposed by Maretto and Krishna57 is utilized (eqn (8) and (9)).| |  | (7) |
| |  | (8) |
| |  | (9) |
Assuming paraffins to be the only hydrocarbon products (eqn (10)), the chain growth probability allows the calculation of the stoichiometric coefficients for all species participating in the reaction.
| | | νCO CO + νH2H2 → νH2O H2O + νCn CnH2n+2 | (10) |
The relationship developed by Vervloet et al.18 describes the chain growth probability as a function of reactant concentration and temperature (eqn (11)). Constants for the reaction rate and chain growth probability are specified in Table 2. The stoichiometric coefficients of carbon monoxide and water are independent of the hydrocarbon chain length (eqn (12) and (13)). However, this is not the case for the consumption of hydrogen, for which the stoichiometric coefficient is accessible via eqn (14).18 For a chain growth probability of zero, all carbon monoxide is converted to methane, thus leading to a stoichiometric coefficient of three for hydrogen, whereas for a chain growth probability close to unity, long-chain hydrocarbons are formed almost exclusively, hence resulting in a hydrogen coefficient of virtually two. The stoichiometric coefficients of the hydrocarbons follow the ASF distribution according to eqn (15).
| |  | (11) |
Table 2 Constants for the equations describing the reaction rate and the chain growth probability18,56,57
| Parameter |
Value |
Unit |
|
ρ
Cat
|
1000 |
kg m−3 |
|
a
0
|
8.853 × 10⁻³ |
mol s−1 bar−2 |
|
b
0
|
2.226 |
1 bar−1 |
|
E
Aa
|
37.37 |
kJ mol−1 |
|
E
Ab
|
−68.48 |
kJ mol−1 |
|
β
|
1.76 |
— |
|
k
α
|
0.0567 |
— |
| ΔEα |
120.4 |
kJ mol−1 |
The expressions for the chain growth probability and the overall reaction rate are functions of temperature and the concentrations of hydrogen and carbon monoxide only. As the stoichiometric coefficients solely depend on the chain growth probability, it is sufficient to solve the mass transport eqn (1) and (2) exclusively for hydrogen and carbon monoxide.
Objective of the simulation
Simulation of the reaction–diffusion equations computes coupled variables as spatial distribution over the catalyst layer thickness. These variables are the hydrogen and carbon monoxide concentrations, reaction rate, temperature, chain growth probability and the resulting stoichiometry. Computation utilizes transport equations, kinetic equations, material properties and parameters to estimate the values for all distributed variables. For evaluation and comparison of the overall reactivity of different catalyst layers, the catalyst efficiency is a measure, which compares the apparent reaction rate with the surface reaction rate (eqn (16)). Since catalyst layers with a certain amount of transport pores exhibit a lowered amount of the catalytically active phase, the efficiency has to be corrected by the residual fraction of the catalytically active phase (eqn (17)) leading to the layer efficiency. For this new quantity, the volume of the catalyst layer serves as the reference volume, which facilitates a reliable comparison of different layer productivities.| |  | (16) |
| |  | (17) |
To evaluate the fraction of the desired products, which are assumed to consist of hydrocarbons with carbon numbers of 5 or higher, the C5+ selectivity on a carbon mass basis is calculated as a function of spatial stoichiometric coefficients, which directly depend on the chain growth probability (eqn (18) and (19)). For further classification of the values obtained with this equation, the methane selectivity is calculated according to eqn (20). From these equations, the effective selectivities are accessible via integration over the whole layer thickness and averaging with the reaction rates (eqn (21) and (22)).
| | | SCn(x) = nα(x)n−1(1 − α(x))2 | (18) |
| |  | (19) |
| |  | (21) |
| |  | (22) |
Typically, the space time yield, STY, is used to compare the productivity of different reaction systems. In this particular case—due to the flat geometry of the catalyst layers and fixed gas composition—gradients in concentration will only appear in the direction of the layer thickness. This means that the absolute overall productivity scales nonlinearly with the thickness but is proportional to the geometric surface area of the catalyst layer. Thus, an area-specific quantity denoted by areal time yield, ATY, is a better reference and therefore used as an objective function for evaluation of the transport pore effects on mass transport. ATY can be calculated from the distributed variables of the reaction rate and C5+ selectivity (eqn (23)) and is also equal to the molar flux of C5+ carbon species leaving the layer.
| |  | (23) |
The focus of this investigation is to find the maximum productivity of an optimally designed catalyst layer. For wall-coated micro-reactors as well as eggshell catalysts and washcoated monoliths, catalyst inventory rises with increasing layer thickness. This implies the demand to fill as much catalyst as possible into the reactor by increasing the layer thickness, but simultaneously avoiding diffusion limitations. Hence, one objective is to find the layer thickness that yields the highest productivity. The other objective is to evaluate the influence of the transport pore fraction on the achievable productivity. Therefore, two degrees of freedom are available, namely the catalyst layer thickness and the transport pore fraction. The ATY is advantageous for the desired evaluation since it allows the optimization towards both parameters to be performed, while evaluating the catalyst efficiency or STY only is insufficient for this task (see detailed discussion in the ESI†). However, for comparison of layers with the same thickness, only the efficiency and selectivity have to be considered as the thickness and surface reaction rate remain constant.
Physical properties
Computation of the mass transport equation requires certain properties of hydrogen and carbon monoxide. The gas phase is supposed to be ideal and contain only hydrogen and carbon monoxide in a fixed H2/CO ratio of 2 at a temperature of 493.15 K and a pressure of 21 bar. Thus, the concentration and diffusivity of the reactants in the liquid phase only depend on the liquid solvent. Although the reaction produces a broad distribution of hydrocarbons, the liquid phase is assumed to consist of only one species for the estimation of liquid solubility and diffusivity. For a paraffin with a carbon number of 28, the liquid molar volume and the Henry constants for hydrogen and carbon monoxide are calculated as reported by Marano and Holder.58 Diffusivities of hydrogen and carbon monoxide are calculated in accordance with an approach by Erkey et al.59 The resulting properties for the reaction conditions are listed in Table 3.
Table 3 Reaction conditions and properties of the solutes (hydrogen and carbon monoxide) for n-octacosane as solvent
| Parameter |
Value |
Unit |
|
T
0
|
493.15 |
K |
|
p
|
21 |
bar |
| H2/CO |
2.0 |
mol mol−1 |
|
c
H2
|
52.46 |
mol m−3 |
|
c
CO
|
33.07 |
mol m−3 |
|
H
H2
|
458.6 |
bar |
|
H
CO
|
363.8 |
bar |
|
v
L
|
0.5818 × 10⁻³ |
m3 mol−1 |
|
D
CO
|
14.30 × 10⁻⁹ |
m2 s−1 |
|
D
H2
|
36.05 × 10⁻⁹ |
m2 s−1 |
Simulation results
Intrinsic reaction rates
Fig. 2 displays the consumption rate of CO, the C5+ selectivity and the resulting formation rate of C5+ hydrocarbons as functions of reactant gas composition.
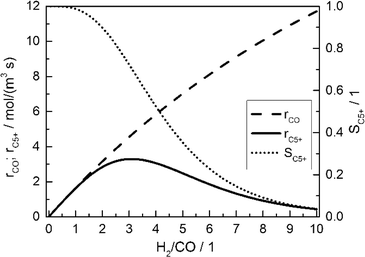 |
| | Fig. 2 Calculated CO consumption rate, C5+ selectivity and formation rate of C5+ hydrocarbons for different H2/CO ratios in the gas phase without diffusion effects and based on literature kinetics;18,56,57 conditions as in Table 3. | |
Since no mass transport effects are considered and only the kinetic expressions are relevant, the rates are denoted as intrinsic. At small H2/CO ratios, where the concentration of carbon monoxide is high, the C5+ selectivity reaches maximum values. However, the inhibiting effect of carbon monoxide in the kinetic expression (eqn (7)) limits the achievable reaction rate. On the contrary, a low carbon monoxide concentration promotes the overall reaction rate but confines the C5+ selectivity due to the high H2/CO ratio. These opposite trends lead to a maximum of the formation rate of the desired products at a distinct value for the H2/CO ratio of slightly above 3. Although diffusional effects will lower the concentration of both reactants in the catalyst layer, a shift in the reactant ratio will also appear, especially as CO and H2 exhibit different diffusivities.
Reaction–diffusion effects – limitation of layer thickness
Fig. 3 illustrates the effect of coupled reaction and diffusion on the spatial concentration profiles inside catalyst layers of different thicknesses without any transport pores. The concentration is normalized to the concentration of hydrogen at the gas–solid boundary, which is given in Table 3. As this is the highest observed concentration, the normalized concentration profiles in Fig. 3 range between the values of zero and unity. Additionally, the resulting chain growth probability is plotted in the same figure. For the smallest thickness of 10 μm, gradients in concentration are almost absent and the normalized concentrations remain constant at a value of unity for hydrogen and about 0.63 for carbon monoxide (Fig. 3, top left). This increased carbon monoxide concentration results from the lower Henry coefficient of CO compared to H2 (Table 3), which leads to a better solubility of CO (eqn (2)). Thus, the H2/CO ratio inside the liquid is 1.59 for a value of 2 in the gas phase. The chain growth probability also stays at a level of about 0.89 due to the absence of gradients.
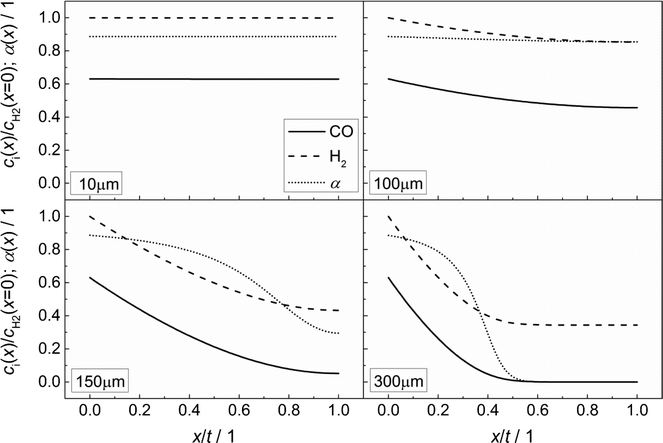 |
| | Fig. 3 Concentration profiles of hydrogen and carbon monoxide as well as the corresponding chain growth probability for catalyst layers of different thicknesses without transport pores; concentration normalized to the surface concentration of hydrogen. | |
With increasing diffusion length, concentration gradients start to form as can be seen for a layer thickness of 100 μm (Fig. 3, top right). Although the relative concentrations of hydrogen and carbon monoxide drop to 0.85 and 0.45, respectively, the influence on the chain growth probability is almost negligible. However, after a further increase of the layer thickness to 150 μm (Fig. 3, bottom left), a severe drop of reactant concentrations occurs. At the wall boundary, the normalized concentration of carbon monoxide is decreased to 0.05, whereas the concentration of hydrogen still remains above 40% of the original value. As a result, the H2/CO ratio reaches a value of about 8 at this position, thereby diminishing the chain growth probability to 0.30. For an even larger layer thickness of 300 μm (Fig. 3, bottom right), the concentration of carbon monoxide reaches a value of virtually zero directly behind the middle of the layer thickness and from this point on, the concentration of hydrogen persists at about one third of its initial value. This almost total absence of CO causes a drastic increase of the H2/CO ratio which leads to a chain growth probability of effectively zero. In particular, the last two cases illustrate that the better diffusivity of hydrogen compared to carbon monoxide leads to an increased H2/CO ratio, which negatively affects the chain growth probability. Neither the better solubility of carbon monoxide nor the more than twice as high consumption rate of hydrogen compensates this effect.
In accordance with Fig. 3, the CO consumption rates as well as the methane and C5+ selectivity profiles are depicted in Fig. 4 for four catalyst layers of different thicknesses. The reaction rate is normalized to the intrinsic value at the surface boundary. Since no substantial concentration gradients occur at a layer thickness of 10 μm, the reaction rates and selectivities exhibit a constant value (Fig. 4, top left). For the 100 μm layer, the minor concentration gradients with a slight increase in the local H2/CO ratio result in an only minor change of methane selectivity from 0.01 at the surface to a value of 0.02 at the wall boundary. Nonetheless, the C5+ selectivity is already quite clearly influenced and decreases from 0.90 to 0.84. However, due to the increased H2/CO ratio, the inhibiting effect of CO on the reaction rate is reduced and the rate rises to 12% above the intrinsic value (Fig. 4, top right). These contrary trends for the C5+ selectivity and reaction rate become more relevant at a layer thickness of 150 μm. Although the concentration of carbon monoxide is only marginally above zero in proximity to the wall, a normalized rate of 1.87 is calculated at this position (Fig. 4, bottom left). Because of the increased local H2/CO ratio, the C5+ selectivity is now severely diminished and at the wall, only 3% of the converted carbon monoxide participates in the production of the desired C5+ products, whereas almost 50% is converted to methane. At a layer thickness of 300 μm, the concentration profile of carbon monoxide reaches zero at approximately half of the thickness and consequently the reaction is stopped. However, the profile of the reaction rate exhibits a strong increase up to this point which drastically drops when almost all carbon monoxide is consumed. This leads to a distinctive maximum in the reaction rate profile for catalyst layers with strong mass transfer limitations. At the point of the maximum reaction rate, the C5+ selectivity reaches zero and the methane selectivity considerably increases towards unity. This means that an effective contribution to the production of C5+ hydrocarbons is limited to the first third of the catalyst layer. Any additional catalyst thickness can be denoted as dead volume since the formation rate of C5+ is practically zero. The profiles of the selectivity and reaction rate reveal that increasing the layer thickness has a negative effect on the selectivity to the desired products and a more complex effect on the efficiency as the reaction rate displays a maximum. Especially, the last case with 300 μm thickness is in good agreement with the previously reported results by Vervloet et al.18 The concentration profiles are quite similar, but since the reaction conditions differ slightly and a spherical model instead of a planar geometry was used, the dimensionless rate profile exhibits a higher maximum with a normalized rate above 2.5 in the work of Vervloet et al.
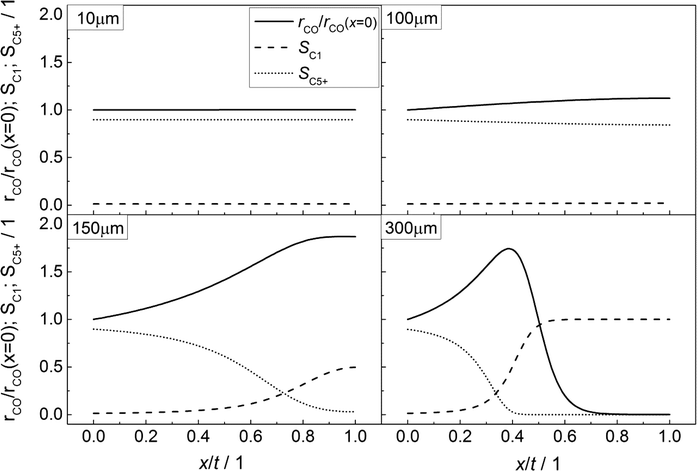 |
| | Fig. 4 Spatial distribution of the normalized CO consumption rate, methane selectivity and selectivity to C5+ hydrocarbons for catalyst layers of different thicknesses without transport pores. | |
For comparison of the productivity of catalyst layers with different thicknesses, the effective selectivities, efficiencies and ATY are shown in Fig. 5. On the basis of the ATY, the productivity can be divided into three different regions. In the first one ranging up to a layer thickness of approximately 100 μm, concentration gradients are not relevant. This means that the ATY is directly proportional to the layer thickness as the C5+ selectivity and reaction rate remain close to the intrinsic values, which transforms the integral in eqn (23) into the expression ATY = (1 − εTP) rCOSC5+t. In the next region for thicknesses ranging from ca. 100 μm to 160 μm, concentration gradients develop leading to partially opposing tendencies for efficiency and selectivity. As the increase in layer efficiency compensates for the decreased selectivity only to some extent, a maximum for the ATY at a layer thickness of 139 μm occurs. Although from this point on the layer efficiency still increases to its maximum of 1.45 at 151 μm, a higher efficiency does not lead to a higher ATY as the drop in C5+ selectivity is too severe. Above a layer thickness of about 160 μm, the C5+ selectivity and ATY remain constant. This marks the third and last region from which any further increase in layer thickness would only result in an additional amount of the active phase that does not contribute to the formation of the desired products. Fig. 5 displays a characteristic profile of the ATY that allows a certain layer thickness which produces the highest achievable amount of desired products for catalyst layers without transport pores to be found. Hence, it provides a reference for evaluating the effect of transport pores on mass transport enhancement and improving the catalyst layer productivity. This reference is denoted as optimum for “dense” layers.
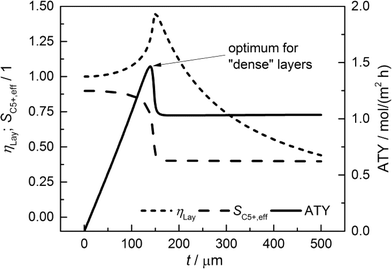 |
| | Fig. 5 Integral values for catalyst efficiency, C5+ selectivity and areal time yield of catalyst layers without transport pores as a function of thickness. | |
Mass transfer improvement by transport porosity optimization
The results of a systematic variation of transport porosity for the case with a layer thickness of 300 μm and a transport pore tortuosity of one are shown in Fig. 6. Transport porosity is varied from the lower theoretical boundary of zero to a maximum value of 0.99. The effective values for layer efficiency, selectivities and ATY are plotted as functions of transport porosity. A catalyst layer of 300 μm exhibits a strong influence of concentration gradients if no transport pores are present. As a result, the efficiency is limited to about 0.74, the C5+ selectivity is fairly low with a value of about 0.40 and the methane selectivity of 0.32 is quite high. With increasing transport porosity, the selectivities to C5+ hydrocarbons and methane remain unaffected up to a porosity of 25%. Only the layer efficiency rises, which can be attributed to an improved accessibility of deeper catalyst layer fractions.
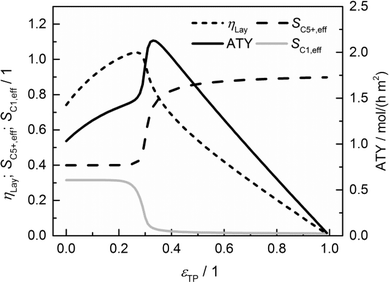 |
| | Fig. 6 Layer efficiency, areal time yield, C5+ and methane selectivity of a 300 μm thick layer as functions of transport pore fraction. | |
As long as an enhanced access of reactants, especially carbon monoxide, does not prevent a concentration drop towards zero, a high local H2/CO ratio still prevails and results in constant selectivities. With further increasing porosity, the negative effect of high local H2/CO ratios disappears and selectivities rapidly approach their intrinsic values. On the other hand, the positive effect of high H2/CO ratios on the reaction rate vanishes as the diffusive transport is enhanced. Together with a reduced amount of the active phase, this leads to decreasing layer efficiency. At high fractions of the transport pores, diffusive transport is fast enough for an almost intrinsic behavior throughout the catalyst layer. Thus, the efficiency drops to a value proportional to the residual amount of the catalyst phase. As a consequence, the ATY is only slightly enhanced by increased efficiency up to a porosity of 25% but fairly benefits from an improved selectivity passing a maximum at a porosity of 33% before it declines in accordance with the layer efficiency at higher porosities. At maximum, the achievable productivity is more than twice as high as for the case without transport pores. Fig. 6 nicely demonstrates the positive effect of the optimal fraction of transport pores. However, one should keep in mind that not only the transport pore fraction but also the layer thickness is required to be optimized in order to compare only the best points to determine a reliable improvement. For this purpose, the results of a single layer optimization of transport porosity, as previously discussed, are condensed in Fig. 7 for catalyst layers ranging from 0 to 500 μm.
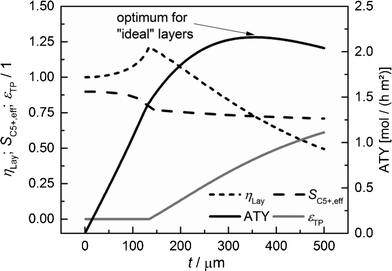 |
| | Fig. 7 Layer efficiency, C5+ selectivity, transport pore fraction and ATY of optimized catalyst layers as functions of thickness. | |
For each layer thickness, the maximum productivity represented by ATY, the corresponding layer efficiency, the C5+ selectivity and the required transport porosity are collected. Thus, Fig. 7 represents the optimization results for each single layer thickness. For thin layers, diffusion limitations are absent and additional transport pores only have a negative effect, as they reduce the fraction of the active phase. Hence, up to a layer thickness of 135 μm, catalytic layers without transport pores yield the highest ATY and the plots are equivalent to those in Fig. 5. However, from this thickness and higher, the introduction of transport pores enhances the achievable productivity. The C5+ selectivity remains almost constant at a value between 0.9 and 0.7 and a distinct maximum of layer efficiency is extenuated leading to a typical, hyperbolic decrease with increasing layer thickness. The necessary fraction of transport pores rises non-linearly from zero to above 60% at a layer thickness of 500 μm. The increasing transport porosity enables the values of ATY to increase for high thicknesses significantly above the level of non-optimized layers. Nonetheless, it is not possible to continue the linear increase of ATY by optimization of transport porosity and even for this ideal case, a maximum of ATY over the layer thickness appears. The maximum achievable ATY at the ideal transport pore fraction of 0.43 and at an ideal thickness of 356 μm is about 47% higher than the maximum for “dense” layers without transport pores. The thickness where the maximum occurs is significantly shifted to higher values, but since transport pores are required to obtain these higher thicknesses, the amount of the catalyst is not increased proportionally. For the optimum case, the layer thickness at maximum ATY corrected with the residual fraction of the catalyst phase of 0.57 exhibits a value of 204 μm. This is 47% higher than that for the dense case and underlines that the enhanced ATY is directly related to an increased amount of the catalyst. Moreover, transport pores are necessary at this elevated diffusion length to preserve a concentration profile with minor gradients. These minor gradients allow a relatively high C5+ selectivity of 0.73 to be maintained, which is almost identical to the C5+ selectivity for the optimum of the dense case (Fig. 5).
At first sight, an enhancement of only 47% appears to be relatively low compared to improvement through addition of transport pores reported in the literature.48 However, it has to be taken into account that only the maxima of ATY for the dense and ideal cases are compared. This comes along with different values for transport porosity and layer thickness. If one compares the productivity at a certain layer thickness only, significantly higher values will be obtainable, e.g. for a layer thickness of 500 μm, increases up to 97% are possible. This emphasizes the necessity to compare only the maxima for different cases and to include not only the transport pore fraction but also the catalyst layer thickness during optimization.
Effect of tortuosity
Since the model assumes straight, cylindrical pores perpendicular to the layer surface, the tortuosity of transport pores equals unity. For real catalyst structures, this ideal value is not necessarily reached and diffusivity inside transport pores might be slower due to higher values of transport pore tortuosity. Furthermore, the tortuosity of the mesoporous catalyst can be lower or higher than the assumed value for the reference case (τCat = 3). For the dense and the optimized ideal layers, the achievable maxima of ATY as a function of catalyst and transport pore tortuosity are shown in Fig. 8. Without transport pores, the ATY considerably decreases with increasing catalyst tortuosity. For the best points with ideal transport pores (τTP = 1), the overall highest productivity can be obtained at a catalyst tortuosity of one. The decline with increasing catalyst tortuosity is considerably attenuated almost leading to a constant productivity at high values of τCat. With increasing transport pore tortuosity, the diffusion in the additional pores slows down and thus the achievable ATY drops. For the points where the catalyst tortuosity is equal to or even lower than the transport pore tortuosity, no or only a negligible improvement can be observed. This clearly emphasizes the necessity of transport pores with high effective diffusivities in order to facilitate mass transport and obtain a benefit. In Fig. 9, the required transport pore fraction as a function of catalyst and transport pore tortuosity is plotted. With increasing catalyst tortuosity, the required porosity rises, indicating that especially at slow diffusion inside the catalyst, introduction of an inert transport pore volume gives rise to an improvement. The similar shape of the profiles in Fig. 8 and 9 indicates that only the difference of the diffusivity inside the catalyst and the transport pores is relevant for the improvement and the required transport pore fraction.
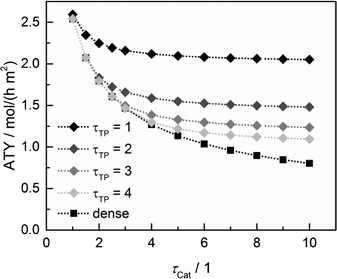 |
| | Fig. 8 Obtainable ATY of optimized cases with ideal transport pore fraction compared to optimized cases without transport pores (dense) as a function of catalyst tortuosity and transport pore tortuosity. | |
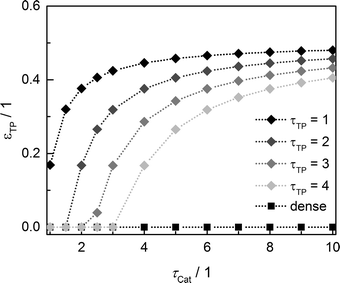 |
| | Fig. 9 Transport pore fraction for the optimized cases compared to the non-optimized, dense case as a function of catalyst tortuosity and transport pore tortuosity. | |
Thus, the achievable enhancement by insertion of transport pores is directly visible as a function of the ratio of catalyst to transport pore tortuosity (Fig. 10, calculated with the data from Fig. 8 and 9). It is evident that the diffusion in the transport pores has to be faster than the diffusion inside the catalyst to yield an effect for ATY. Furthermore, the improvement potential increases with rising tortuosity ratio. Interestingly, the required transport porosity rapidly approaches a value close to 0.5 with increasing tortuosity ratio. This is a very similar result to that reported by Coppens and coworkers,47 who found a maximum ideal porosity of macropores of 0.5 for layers with the highest investigated Thiele moduli.
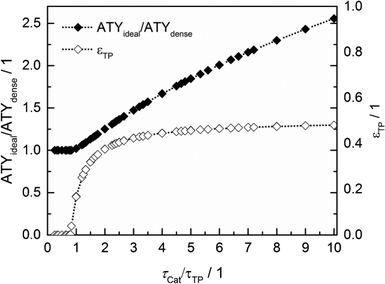 |
| | Fig. 10 Transport pore fractions and improvement of ATY as functions of the tortuosity ratio τCat/τTP. | |
Maximum allowable transport pore diameter
To justify the reliability of an effective 1D model, transport pores have to be sufficiently small in order to avoid any additional transport limitations orthogonal to the main diffusion direction. Johannessen et al.47 have derived a criterion for the necessary size of transport channels from 2D simulations for first-order kinetics and applied this to cylindrical transport pores in a hexagonal packing. For the present work, the criterion can be written as eqn (24), assuming CO as the limiting species due to its lower diffusivity and the approximation of the first-order kinetics using the reaction rate and concentration at the gas–solid boundary.| |  | (24) |
This criterion basically determines the maximal remaining wall thickness between the transport pores, in order to avoid concentration gradients inside the walls. Therefore, the pore size is independent of the layer thickness and only depends on the effective diffusion and the reaction inside the catalyst phase as well as the fraction of transport pores.
For catalyst tortuosities of 1, 3 and 10, the resulting wall thicknesses are about 49 μm, 28 μm and 15 μm, which are considerably smaller than the layer thickness at which concentration gradients appear (Fig. 5). The transport pore diameters calculated by this criterion for the three different catalyst tortuosities are shown in Fig. 11. Even for a very low transport pore fraction of 0.01 and the lowest considered catalyst tortuosity of τCat = 10, the maximum allowable transport pore diameter is still about 1.8 μm. Thus, transport pores with diameters of 1–2 μm can be used over the entire range of layer thicknesses and transport pore fractions without causing additional mass transfer resistances. However, the required transport pore fraction for the optimal point is, in most cases, in the range of 0.4 to 0.5 (Fig. 10). Here, the necessary transport pore diameter can be between 30 and 140 μm. This shows that remarkably large pores can be utilized to achieve an overall improvement of FTS.
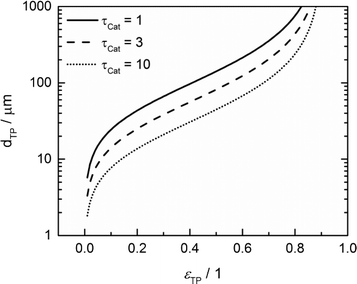 |
| | Fig. 11 Upper limit for transport pore diameters as a function of transport pore fraction for different catalyst tortuosities; criterion derived from Johannessen et al.47 | |
Temperature gradients
Although the main focus of this work is the enhancement of mass transport effects, we also investigated the possible appearance of temperature gradients in the catalyst layers. The maximum temperature deviations from the wall temperature occur at the gas–solid boundary as no heat flux to the gas phase was assumed. Fig. 12 displays the temperature differences at this point as a function of layer thickness. Obviously, the temperature difference rises with increasing layer thickness. However, even for a layer of 500 μm, the calculated temperature rise is less than about 0.5 K. Consequently, any influence of the temperature distribution in the catalyst layer can be neglected.
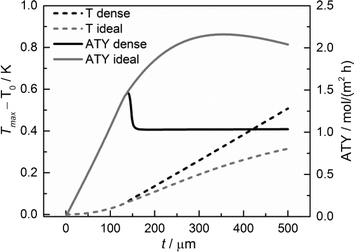 |
| | Fig. 12 Temperature difference of the maximum temperature to the wall temperature and ATY of the optimized, ideal, and non-optimized, dense catalyst layers as a function of thickness; τTP = 1, τCat = 3. | |
Conclusions
Diffusion phenomena inside Fischer–Tropsch catalysts are likely to play a vital role in the apparent reaction rate and selectivity to long-chain hydrocarbons and may limit the achievable productivity. The insertion of transport pores is an interesting option to enhance catalyst productivity. For the investigation of this concept, an effective one-dimensional reaction–diffusion model using empirical kinetic equations was adapted to include transport pores as the inert phase. For a planar geometry of the catalyst, the quantity ATY was defined and used as the objective function for productivity optimization. During optimization, it became evident that the catalyst thickness and transport pore fraction have to be adjusted simultaneously in order to obtain the maximum benefit in productivity. For the investigated parameter range, an improvement of up to 150% was found, strongly depending on the effective diffusivities inside the transport pores and the catalyst phase. The best results are achieved if the diffusion in the transport pores is significantly faster than that inside the catalyst. In this range, a relatively constant transport pore fraction of 0.4 to 0.5 was found to be ideal. For the reference case, the productivity could be improved by about 47% with a transport pore fraction of 43%. To achieve this enhancement, the layer thickness has to be increased from 134 μm to 346 μm. The maximum allowable transport pore diameter at this point is 62 μm. As for varying tortuosities, different transport pore fractions were found to be ideal, and the limit for the transport pore diameter also changed. In most cases, transport pore diameters between 30 and 140 μm can be employed without any additional mass transfer resistance between the transport pore and the catalyst. The calculated temperature gradients in the catalyst layer are fairly low. Thus, mass transport is the dominant phenomenon determining the rate and selectivity of FTS catalysts.
The simple model described in the present contribution illustrates that variation of structural parameters offers considerable optimization potential for FTS catalysts. These parameters can be easily altered with common techniques of catalyst preparation such as addition of pore-forming agents or templates. These investigations are currently carried out by our group and will be presented in a forthcoming publication.
Notation
Latin
|
a
|
Reaction rate constant, mol s−1 bar−2
|
|
a
0
|
Frequency factor for reaction rate constant, mol s−1 bar−2
|
| ATY |
Areal time yield of desired products, mol s−1 m−2
|
|
b
|
Absorption constant, bar−1
|
|
b
0
|
Frequency factor for absorption constant, bar−1
|
|
c
i,Cat
|
Concentration in liquid-filled pores of the catalyst phase of species i (CO or H2), mol m−3
|
|
c
i,TP
|
Concentration in liquid-filled transport pores of species i (CO or H2), mol m−3
|
|
D
i
|
Diffusion coefficient of species i (CO or H2), m2 s−1
|
|
d
TP
|
Diameter of transport pores, m
|
|
E
Aa
|
Activation energy for the reaction rate constant, J mol−1
|
|
E
Ab
|
Activation energy for the absorption constant, J mol−1
|
|
H
i
|
Henry coefficient of species i (CO or H2), bar
|
|
ka
i
|
Combined mass transfer coefficient of species i (CO or H2), s−1
|
|
k
α
|
Selectivity coefficient, dimensionless
|
|
n
|
Carbon number, dimensionless
|
|
P
|
Gas phase pressure, bar
|
|
p
i
|
Partial pressure of species i (CO or H2), bar
|
|
R
|
Universal gas constant, J mol−1 K−1
|
|
r
C5+
|
Formation rate of desired products, mol s−1 m−3
|
|
r
CO
|
Consumption rate of CO, mol m−1 s−1
|
|
S
C1
|
Spatially distributed molar selectivity for methane, dimensionless
|
|
S
C1,eff
|
Effective molar selectivity for methane, dimensionless
|
|
S
C5+
|
Spatially distributed molar selectivity for alkanes with n greater than 4, dimensionless
|
|
S
C5+,eff
|
Effective molar selectivity for alkanes with n greater than 4, dimensionless
|
|
S
Cn
|
Spatially distributed molar selectivity for an alkane of carbon number n, dimensionless
|
| STY |
Space time yield of desired products, mol s−1 m−3
|
|
t
|
Thickness of catalyst layers, m
|
|
T
|
Temperature, K
|
|
T
0
|
Temperature at the wall boundary, K
|
|
T
max
|
Maximum temperature in the layer, K
|
|
T
ref
|
Reference temperature for selectivity expression, 493.15 K
|
|
v
L
|
Molar volume of the products in liquid phase, m3 mol−1
|
|
x
|
Dimension coordinate, m
|
| H2/CO |
Ratio of gas-phase partial pressures of H2 to CO, dimensionless
|
Greek
|
α
|
Chain growth probability, dimensionless
|
|
β
|
Selectivity order, dimensionless
|
| ΔEα |
Selectivity expression activation energy, J mol−1
|
|
ε
Cat
|
Fraction of pores in the catalyst phase, dimensionless
|
|
ε
TP
|
Fraction of transport pores in the catalyst layer, dimensionless
|
|
η
Cat
|
Efficiency of the catalyst phase, dimensionless
|
|
η
Lay
|
Efficiency of the catalyst layer including transport pores, dimensionless
|
|
ν
C30+
|
Stoichiometric coefficient of alkanes with n greater than 29, dimensionless
|
|
ν
Cn
|
Stoichiometric coefficient of an alkane with carbon number n, dimensionless
|
|
ν
i
|
Stoichiometric coefficient of species i (CO, H2 or H2O), dimensionless
|
|
ρ
Cat
|
Apparent density of the catalyst phase, kg m−3
|
|
τ
Cat
|
Tortuosity inside the catalyst phase, dimensionless
|
|
τ
TP
|
Tortuosity inside the transport pores, dimensionless
|
Acknowledgements
The authors gratefully thank the Deutsche Forschungsgemeinschaft (DFG) for financial support through SPP 1570 (grant no. TU89/9).
References
- Q. Zhang, J. Kang and Y. Wang, ChemCatChem, 2010, 2, 1030–1058 CrossRef CAS.
- B. H. Davis, Catal. Today, 2002, 71, 249–300 CrossRef CAS.
- M. E. Dry, Catal. Today, 2002, 71, 227–241 CrossRef CAS.
- R. Guettel, U. Kunz and T. Turek, Chem. Eng. Technol., 2008, 31, 746–754 CrossRef CAS.
- A. Jess and C. Kern, Chem. Eng. Technol., 2012, 35, 369–378 CrossRef CAS.
- A. Jess and C. Kern, Chem. Eng. Technol., 2012, 35, 379–386 CrossRef CAS.
- R. Myrstad, S. Eri, P. Pfeifer, E. Rytter and A. Holmen, Catal. Today, 2009, 147S, S301–S304 CrossRef.
- H. Robota, L. Richard, S. Deshmukh, S. LeViness, D. Leonarduzzi and D. Roberts, Catal. Surv. Asia, 2014, 18, 177–182 CrossRef CAS.
- C. Knobloch, R. Güttel and T. Turek, Chem. Ing. Tech., 2013, 85, 455–460 CrossRef CAS.
- J. Knochen, R. Güttel, C. Knobloch and T. Turek, Chem. Eng. Process., 2010, 49, 958–964 CrossRef CAS.
- R. Guettel and T. Turek, Chem. Eng. Sci., 2009, 64, 955–964 CrossRef CAS.
- A. M. Hilmen, E. Bergene, O. A. Lindvåg, D. Schanke, S. Eri and A. Holmen, Catal. Today, 2001, 69, 227–232 CrossRef CAS.
- F. Kapteijn, R. M. de Deugd and J. A. Moulijn, Catal. Today, 2005, 105, 350–356 CrossRef CAS.
- M. F. M. Post, A. C. Vanthoog, J. K. Minderhoud and S. T. Sie, AIChE J., 1989, 35, 1107–1114 CrossRef CAS.
- E. Iglesia, S. C. Reyes, R. J. Madon and S. L. Soled, Adv. Catal., 1993, 39, 221–302 CAS.
- K. D. Kruit, D. Vervloet, F. Kapteijn and J. R. van Ommen, Catal. Sci. Technol., 2013, 3, 2210–2213 CAS.
- M. Lualdi, S. Lögdberg, G. Carlo, S. Järås, M. Boutonnet, A. Venezia, E. Blekkan and A. Holmen, Top. Catal., 2011, 54, 1175–1184 CrossRef CAS.
- D. Vervloet, F. Kapteijn, J. Nijenhuis and J. R. van Ommen, Catal. Sci. Technol., 2012, 2, 1221–1233 CAS.
- Y.-N. Wang, Y.-Y. Xu, H.-W. Xiang, Y.-W. Li and B.-J. Zhang, Ind. Eng. Chem. Res., 2001, 40, 4324–4335 CrossRef CAS.
- E. Iglesia, S. L. Soled, J. E. Baumgartner and S. C. Reyes, J. Catal., 1995, 153, 108–122 CrossRef CAS.
- L. Fratalocchi, C. G. Visconti, L. Lietti, E. Tronconi, U. Cornaro and S. Rossini, Catal. Today, 2015, 246, 125–132 CrossRef CAS.
- Y. Liu, D. Edouard, L. D. Nguyen, D. Begin, P. Nguyen, C. Pham and C. Pham-Huu, Chem. Eng. J., 2013, 222, 265–273 CrossRef CAS.
- K. Pangarkar, T. J. Schildhauer, J. R. van Ommen, J. Nijenhuis, J. A. Moulijn and F. Kapteijn, Catal. Today, 2009, 147(Supplement), S2–S9 CrossRef CAS.
- B. Xu, Y. Fan, Y. Zhang and N. Tsubaki, AIChE J., 2005, 51, 2068–2076 CrossRef CAS.
- Ø. Borg, S. Eri, E. A. Blekkan, S. Storsæter, H. Wigum, E. Rytter and A. Holmen, J. Catal., 2007, 248, 89–100 CrossRef.
- A. Y. Khodakov, A. Griboval-Constant, R. Bechara and V. L. Zholobenko, J. Catal., 2002, 206, 230–241 CrossRef CAS.
- A. M. Saib, M. Claeys and E. van Steen, Catal. Today, 2002, 71, 395–402 CrossRef CAS.
- M. Wolters, L. J. W. van Grotel, T. M. Eggenhuisen, J. R. A. Sietsma, K. P. de Jong and P. E. de Jongh, Catal. Today, 2010, 163, 27–32 CrossRef.
- H. Preising and D. Enke, Colloids Surf., A, 2007, 300, 21–29 CrossRef CAS.
- C. K. Colton, C. N. Satterfield and C.-J. Lai, AIChE J., 1975, 21, 289–298 CrossRef CAS.
- C. N. Satterfield, C. K. Colton and W. H. Pitcher, AIChE J., 1973, 19, 628–635 CrossRef CAS.
- S. Y. Lee, J. D. Seader, C. H. Tsai and F. E. Massoth, Ind. Eng. Chem. Res., 1991, 30, 29–38 CrossRef CAS.
- E. M. Renkin, J. Gen. Physiol., 1954, 38, 225–243 CAS.
- M. C. Tsai, Y. W. Chen and C. Li, Ind. Eng. Chem. Res., 1993, 32, 1603–1609 CrossRef CAS.
- T. Doğu, Ind. Eng. Chem. Res., 1998, 37, 2158–2171 CrossRef.
- N. Wakao and J. M. Smith, Chem. Eng. Sci., 1962, 17, 825–834 CrossRef CAS.
- M.-O. Coppens and G. F. Froment, Chem. Eng. Sci., 1995, 50, 1013–1026 CrossRef CAS.
- M.-O. Coppens and G. F. Froment, Chem. Eng. Sci., 1995, 50, 1027–1039 CrossRef CAS.
- F. J. Keil and C. Rieckmann, Chem. Eng. Sci., 1994, 49, 4811–4822 CrossRef CAS.
- C. Rieckmann and F. J. Keil, Chem. Eng. Sci., 1999, 54, 3485–3493 CrossRef CAS.
- R. Güttel, Chem. Ing. Tech., 2015, 87, 694–701 CrossRef.
- G. Dogu and J. M. Smith, AIChE J., 1975, 21, 58–61 CrossRef CAS.
- N. A. Seaton, Chem. Eng. Sci., 1991, 46, 1895–1909 CrossRef CAS.
- J. M. C. Pereira, J. E. P. Navalho, A. C. G. Amador and J. C. F. Pereira, Chem. Eng. Sci., 2014, 117, 364–375 CrossRef CAS.
- S. Gheorghiu and M.-O. Coppens, AIChE J., 2004, 50, 812–820 CrossRef CAS.
- G. Wang, E. Johannessen, C. R. Kleijn, S. W. de Leeuwa and M.-O. Coppens, Chem. Eng. Sci., 2007, 62, 5110–5116 CrossRef CAS.
- E. Johannessen, G. Wang and M.-O. Coppens, Ind. Eng. Chem. Res., 2007, 46, 4245–4256 CrossRef CAS.
- G. Wang and M.-O. Coppens, Chem. Eng. Sci., 2010, 65, 2344–2351 CrossRef CAS.
- H. Becker, R. Güttel and T. Turek, Chem. Ing. Tech., 2014, 86, 544–549 CrossRef CAS.
- G. S. Armatas, Chem. Eng. Sci., 2006, 61, 4662–4675 CrossRef CAS.
- D. Vervloet, F. Kapteijn, J. Nijenhuis and J. R. van Ommen, Catal. Today, 2013, 216, 111–116 CrossRef CAS.
- D. S. Smith, A. Alzina, J. Bourret, B. Nait-Ali, F. Pennec, N. Tessier-Doyen, K. Otsu, H. Matsubara, P. Elser and U. T. Gonzenbach, J. Mater. Res., 2013, 28, 2260–2272 CrossRef CAS.
- J. J. Marano and G. D. Holder, Ind. Eng. Chem. Res., 1997, 36, 2409–2420 CrossRef CAS.
- G. Chabot, R. Guilet, P. Cognet and C. Gourdon, Chem. Eng. Sci., 2015, 127, 72–83 CrossRef CAS.
- X. Zhu, X. Lu, X. Liu, D. Hildebrandt and D. Glasser, Chem. Eng. J., 2014, 247, 75–84 CrossRef CAS.
- I. C. Yates and C. N. Satterfield, Energy Fuels, 1991, 5, 168–173 CrossRef CAS.
- C. Maretto and R. Krishna, Catal. Today, 1999, 52, 279–289 CrossRef CAS.
- J. J. Marano and G. D. Holder, Fluid Phase Equilib., 1997, 138, 1–21 CrossRef CAS.
- C. Erkey, J. B. Rodden and A. Akgerman, Can. J. Chem. Eng., 1990, 68, 661–665 CrossRef CAS.
Footnote |
| † Electronic supplementary information (ESI) available: Discussion of proper measure for optimization of productivity. See DOI: 10.1039/c5cy00957j |
|
| This journal is © The Royal Society of Chemistry 2016 |
Click here to see how this site uses Cookies. View our privacy policy here.  Open Access Article
 b and
Thomas
Turek
 *a
*a


