DOI:
10.1039/D4YA00324A
(Paper)
Energy Adv., 2024,
3, 2520-2529
Direct formate anion exchange membrane fuel cells with a PdAu bimetallic nanoparticle anode electrocatalyst obtained by metal vapor synthesis†
Received
23rd May 2024
, Accepted 27th August 2024
First published on 29th August 2024
Abstract
Fuels can be produced from the electrochemical reduction of industrial waste CO2 (e-fuels) using renewable energy and hence are an attractive option for the storage of renewable energy in a chemical form. The energy stored in the e-Fuel may be recovered on-demand using a direct fuel cell thus completing a carbon neutral cycle. Anion exchange membrane fuel cells (AEMFCs) are versatile devices that can be fed by both a gaseous fuel such as H2 and with liquid fuels (e.g. alcohols, formate, hydrazine, NaBH4). Formate is a molecule that can be easily obtained by the electrochemical reduction of CO2 with high selectivity. Efficient re-transformation of the energy stored in the chemical bonds into electrical energy requires the development of efficient and stable electrocatalysts. Palladium alloy catalysts are highly active under alkaline conditions when Pd is mixed with more oxophilic transition metals. Here we report that enhanced activity and stability can be obtained with Au–Pd alloy nanoparticles when compared to a Pd catalyst. Both catalysts are prepared by a metal vapour synthesis method. We show that the key to enhanced performance is the partial segregation of Au to the NP surface that increases oxophilicity and favours the adsorption and transfer of OH− species to the active Pd sites. This enhanced activity translates to high power densities and performance stability when employed in AEMFCs fed with aqueous potassium formate fuel (Peak power density of 0.14 W cm−2, energy efficiency of 33%, faradaic efficiency of 80%).
1. Introduction
Carbon capture and utilization (CCU) is currently being developed to potentially reverse the buildup of CO2 in the atmosphere that directly causes global warming.1,2 The electroreduction of CO2 (CO2RR) to produce fuels is an attractive way to use the captured CO2.3 Formate salts can be obtained from CO2RR with high selectivity and efficiency. Aqueous solutions of formate salts have the advantage of being stable liquids that can be readily transported, stored and handled. Direct fuel cells can then be used to recover the energy stored in formate releasing the CO2 and closing the carbon cycle as recently demonstrated by Yu and coworkers.4 Fuel cells can exploit both liquid and gaseous fuels, transforming the energy stored in chemical bonds directly into electrical energy.5 Hydrogen is a well-established fuel already used in commercialized fuel cell systems for example in transportation.6 High power density Proton exchange membrane fuel cells (PEMFCs) can power cars, trucks, boats and trains. Alternatively, liquid fuels such formate/formic acid have advantages over H2 in terms of transportation, storage, and handling. Direct formic acid fuel cells using cation exchange membranes operate at low pH and require high loadings of platinum group metals (PGM) such as PtRu and Pt as catalysts to overcome the highly corrosive environment and catalyst poisoning by intermediates such as CO formed during complex fuel oxidation processes.7 For formic acid (FA) such catalyst poisoning can be alleviated by addition of SnO2 to Pd, that facilitates the elimination of the poisoning CO intermediate.8 Porous palladium phosphide nanotubes have been developed that show a strong electronic effect between Pd and P that promotes the direct pathway of FA oxidation.9 Strong interaction between Pt and Te in alloy nanowires enhances the oxidation of formic acid through the strong electronic interaction between Pt atoms and Te atoms that weakens the adsorption capacity of CO intermediate on Pt atoms.10 Despite such attempts to alleviate the problem of catalyst poisoning, the instability of catalysts in formic acid fuel cells remains problematic. The use of an anion exchange membrane (using a high pH environment) allows for reduced amounts of noble metal catalysts.11–13 The fuel oxidation catalyst can use reduced loadings of PGMs as formate oxidation at high pHs follows reaction pathways that avoid catalyst poisoning intermediates like CO. Formate salts are non-flammable and non-toxic and undergo complete oxidation to CO2 or carbonate in AEMFCs.14 High power densities have been reported for fuel cells fed with various concentrations of potassium formate and supporting electrolyte (typically KOH).15 Recent examples of direct formate fuel cells (DFFC) equipped with a combination of anion exchange membranes and air or oxygen fed cathodes show the potential for high power devices with peak power densities in the range of 250–300 mW cm−2 (Tcell = 60 °C).16,17 High energy efficiencies (EE) and faradaic efficiencies (FE) were also reported (50% EE and 90% FE).17 Formate oxidation is usually achieved on noble metal catalysts usually Pt or Pd.18 Catalytic activity is generally enhanced when alloys are formed between Pd and other transition metals e.g. PdAg, PdAu, PdAgF, PdCu and PdSn.19–22 The synthesis of Pd–X alloy nanoparticles usually requires the use of capping molecules (usually organic) that block the growth of the nanoparticles. Their removal requires high temperature treatment that usually alters the size and surface composition. In this work, we report and discuss the activity of carbon-supported PdAu alloy NPs with controlled size, synthesized by the simultaneous co-condensation of Pd and Au vapors with acetone vapor, following the metal vapor synthesis procedure.23–25 The origin in the increased activity compared to a monometallic Pd/C catalyst prepared by the same method is the segregation of Au atoms to the surface resulting in a highly active oxophilic surface. We exploit this PdAu/C catalyst in DFFCs that show high power densities and performance stability.
2. Experimental
2.1 Catalyst synthesis
According to the MVS procedure, palladium and gold vapors are generated by resistive heating of two different alumina-coated tungsten crucibles filled with Pd (150 mg, powder) and Au (50 mg, beads).26 They are co-condensed simultaneously at liquid nitrogen temperature with acetone (100 mL) in a glass reactor chamber of the MVS apparatus for 1 hour. The reactor chamber is then warmed to the melting point of the solid matrix (ca. −95 °C), and the resulting red–brown solution of Au–Pd NPs, named Au–Pd solvated metal atoms (SMA), is siphoned at a low temperature into a Schlenk tube and stored at −40 °C. The metal content in the Au–Pd SMA, measured by ICP-OES analysis was 0.85 mg mL−1 of Pd and 0.4 mg mL−1 of Au. A portion (95 mL) of the Au–Pd SMA was added to a suspension of a porous carbon, Vulcan XC-72 (1.2 g) in acetone (50 mL). The mixture was stirred for 12 h at 25 °C. In this way, the Au–Pd NPs were quantitatively deposited onto the Vulcan XC-72 carbon support. The colorless solvent was then removed, and the resulting black solid product was washed with n-pentane (50 mL) and dried under reduced pressure. The metal loadings in the solid product were analyzed by ICP-OES (Pd 9.0 wt%, Au 3.0 wt%). An analogous procedure was used to prepare the monometallic Pd/C and Au/C catalysts (10 wt% metals confirmed by ICP-OES analysis).
2.2 Electrochemical studies
All the measurements were performed with a Princeton 2273A potentiostat/galvanostat, with a standard 3 electrode system, using Ag/AgClsat(KClsat) as reference electrode, a gold-wire counter electrode and rotating disk electrode (RDE) as working electrode RDE diameter (0.5 cm) and area (0.196 cm2). Each catalyst ink was composed of 7 mg of powder catalyst (M/C and M = Pd or Pd–Au), 600 mg of water, 600 mg of 2-propanol and 12 mg of Nafion (5 wt%, Aldrich). The resulting suspension was sonicated (59 Hz, 100 W) for 30 min, then with the help of a micropipette, 5 μL of the ink were deposited onto the RDE. The metal loading (10–15 μg cm−2) was determined by weighing the amount of ink deposited on the glassy carbon RDE. Prior to all electrochemical tests, a solution of KOH 2 M was prepared by purging for 30 minutes the solution with N2. Electrode potentials are converted to the reversible hydrogen electrode (RHE) using the equation (eqn (1)):| | | ERHE = EAg/AgCl + 0.059 pH + EoAg/AgCl | (1) |
where EoAg/AgCl is equal to 0.198 V and it was iR corrected to eliminate ohmic loss across the electrolyte. EAg/AgCl is the measured electrode potential of the working electrode with respect to the reference electrode Ag/AgClsat(KClsat). Cyclic voltammetry (CV) scans were acquired at 25 °C under N2 atmosphere from 0 to 1.4 V vs. RHE, at a scan rate of 50 mV s−1, operating in static conditions. Electrochemical CO stripping voltammetry was performed using an established literature method.27,28 CO was adsorbed on the catalyst for 20 min at a potential of 150 mV (2 M KOH solution). The solution was purged by bubbling N2 for 30 min before performing the stripping voltammetry at a 20 mV s−1 scan rate. The electrocatalytic activity was investigated using CV in N2 saturated 2 M potassium formate 2 M KOH solution, respectively from 0 to 1.2 V at a scan rate of 50 mV s−1. In order to estimate the roughness factor (RF) of the catalysts, CVs were recorded under the potential window of 0.6 and 0.7 V at various scan rates of 10, 20, 40, 60, 80, 100 mV s−1. The electrochemical double-layer capacity (Cdl), expressed in mF cm−2, was obtained by linear fitting of capacitive current density plotted versus scan rate. Electrochemical impedance spectroscopy (EIS) was performed at 0.4 V over a frequency (f) range of 100 kHz–0.01 Hz. All measurements were acquired using the software “Powersuite”.
2.3 Physical characterization
High-resolution STEM was performed employing a Talos™ F200X G2 TEM microscope (Thermo Scientific). By exploiting its circular four-detector SuperX energy dispersive detector, high-resolution EDX maps of the Pd and Au–Pd based samples were acquired. A drop of sample solution (a small quantity of catalyst dispersed in 2-propanol) was dropcasted on a Holey TEM Copper grid, which was used as a sample holder for the characterization. X-ray diffraction (XRD) scans were acquired at room temperature with a PANalytical X’PERT PRO diffractometer, employing CuKα radiation (λ = 1.54187 Å) and a PW3088/60-graded multilayer parabolic X-ray mirror for Cu radiation. The diffractograms were acquired in the 2θ range from 22.0 to 88, using a continuous scan mode with an acquisition step size of 2θ = 0.02638 and a counting time of 49.5 s. QualX2 software and the COD database were used to qualitatively assign the peaks to the structures. The Brunauer–Emmett–Teller (BET) specific surface area of Pd/C and PdAu/C were determined by nitrogen adsorption at 77 K using a Micromeritics ASAP 2020 analyzer. The samples were pre-treated at 30 μmHg at 393 K for 15 h. The BET surface area was calculated in the pressure range between 0.1 and 0.22 p/p0 while the pore volume was calculated with the Barrett–Joyner–Halenda (BJH) method (17.00–3000.00 Å range).
2.4 Fuel cell testing
Anode electrodes were prepared as follows, a dense catalyst paste was prepared by mixing the catalyst (65 mg) with an aqueous dispersion of PTFE (65 mg of a 10 wt% PTFE dispersion in H2O) The catalyst paste was applied uniformly to a porous nickel foam support (Alantum Germany), dimensions 5 cm2. The thus prepared anode had a dry catalyst loading of 13 mg cm−2 and a Pd–Au metal loading of 1.6 mg cm−2. The analogous Pd/C anode prepared with the same procedure had a 1.3 mg cm−2 Pd metal loading. The cathode electrode for all fuel cell tests was prepared using a Fe–Co/C cathode catalyst prepared as described previously.17 A catalyst ink was prepared by mixing the required amount of Fe–Co/C with an aqueous dispersion of PTFE (100 mg of a 10 wt% PTFE dispersion in H2O) (final loading of 10 wt% PTFE), distilled water and ethanol. A stable ink was obtained after thorough mixing and sonication. The ink was applied to a carbon cloth substrate coated with a hydrophobic microporous carbon layer (MPL) (W1S1005, CeTech Co. Ltd., Taichung, Taiwan) by spray coating until the desired catalyst loading of ca. 2 mgcat cm−2 was obtained. Both the cathode and anode electrodes after drying were further wet proofed by heating to 340 °C for 20 min under a flow of pure N2. The active fuel cell system suitable for corrosive liquid fuel solutions was obtained from Scribner-Associates (Southern Pines, NC, USA) with a 25 cm2 fuel cell fixture and an effective electrode area of 5 cm2. The MEAs were fabricated by mechanically pressing anode, anion exchange membrane (Fumatech fumasep FAA-3-30) and cathode within the fuel cell hardware. The fuel solution was delivered to the anode at 1 mL min−1 by a peristatic pump, while the oxygen flow at the cathode was regulated at 0.1 L min−1. The temperature of the cell and of the oxygen gas temperature and humidification were regulated using a Scribner 850e fuel cell test station. The entry temperature of the fuel and cell temperature were set at 60 °C. The fuel cell performance was monitored with an ARBIN BT-2000 5A 8 channels instrument (Arbin Instruments, College Station, TX, USA). Fuel cell polarization curves were obtained at 10 mV s−1 scan rate from OCV to 0.1 V. Galvanostatic experiments were undertaken at a constant current density.
3. Results and discussion
3.1 Synthesis and characterization
Bimetallic PdAu alloy NPs were synthesized by the simultaneous co-condensation of Au and Pd vapors together with acetone vapor affording Pd–Au/acetone solvated metal atoms (SMAs), according to the MVS procedure (Fig. S1, ESI†).23–26 This synthetic approach allows control over the size and composition of alloy nanoparticles that are stabilized by a weak interaction with the solvent (acetone) avoiding the presence of additional ligands or stabilizers that prevent agglomeration. The PdAu NPs were then quantitatively immobilized by impregnation on a Vulcan XC-72 carbon support using the Au–Pd/acetone SMA at room temperature (25 °C), without further reduction or calcination steps. The equivalent monometallic Pd/C material was also prepared by the same method (Metal loadings by ICP: Pd/C 10.0 wt% Pd and PdAu/C 9.0 wt% Pd and 3.0 wt% Au metal content). The resulting catalysts are macroporous–mesoporous systems with a BET surface area of 85 m2 g−1 for PdAu/C and 137 m2 g−1 for Pd/C (Table S1, ESI†). Powder XRD analysis of the PdAu/C catalyst was undertaken to study the lattice constants and crystallinity of the NPs (Fig. S2, ESI†). The signals at 2θ = 40, 46, 68, 82 are the reflections of the (111), (200), (220) and (311) planes of face centered cubic (fcc) Pd. These signals are partially overlapped with the diffraction peaks of the (111), (200), (220), (222) and (311), planes of fcc Au structures, which fall at 2θ = 38, 45, 65, 77 and 81 respectively.29 The XRD trace of PdAu/C is indicative of an alloy structure rather than a heterogeneous mixture of individual Pd and Au NPs as described for the AuPd alloy reported by Zhao.30 Compared with Pd/C, the crystalline lattice of Pd in PdAu/C is dilated. The d spacing of PdAu is 2.32 Å compared to 2.27 Å for Pd/C (HR-TEM) as the formation of an alloy structure expands the crystalline lattice of Pd due to lattice mismatch with Au. A recent Pd L3-edge XANES study of these bimetallic Au–Pd nanoparticles in comparison to that of the Pd nanoparticles showed no difference in position or line shape between the two spectra. The comparison confirmed that the palladium in the Au–Pd alloy is in a metallic form.25 An additional XAS study of carbon supported PdAu NPs revealed the presence of Au–Pd bonds and both Pd and Au were metallic and generally in the form of an alloy.26
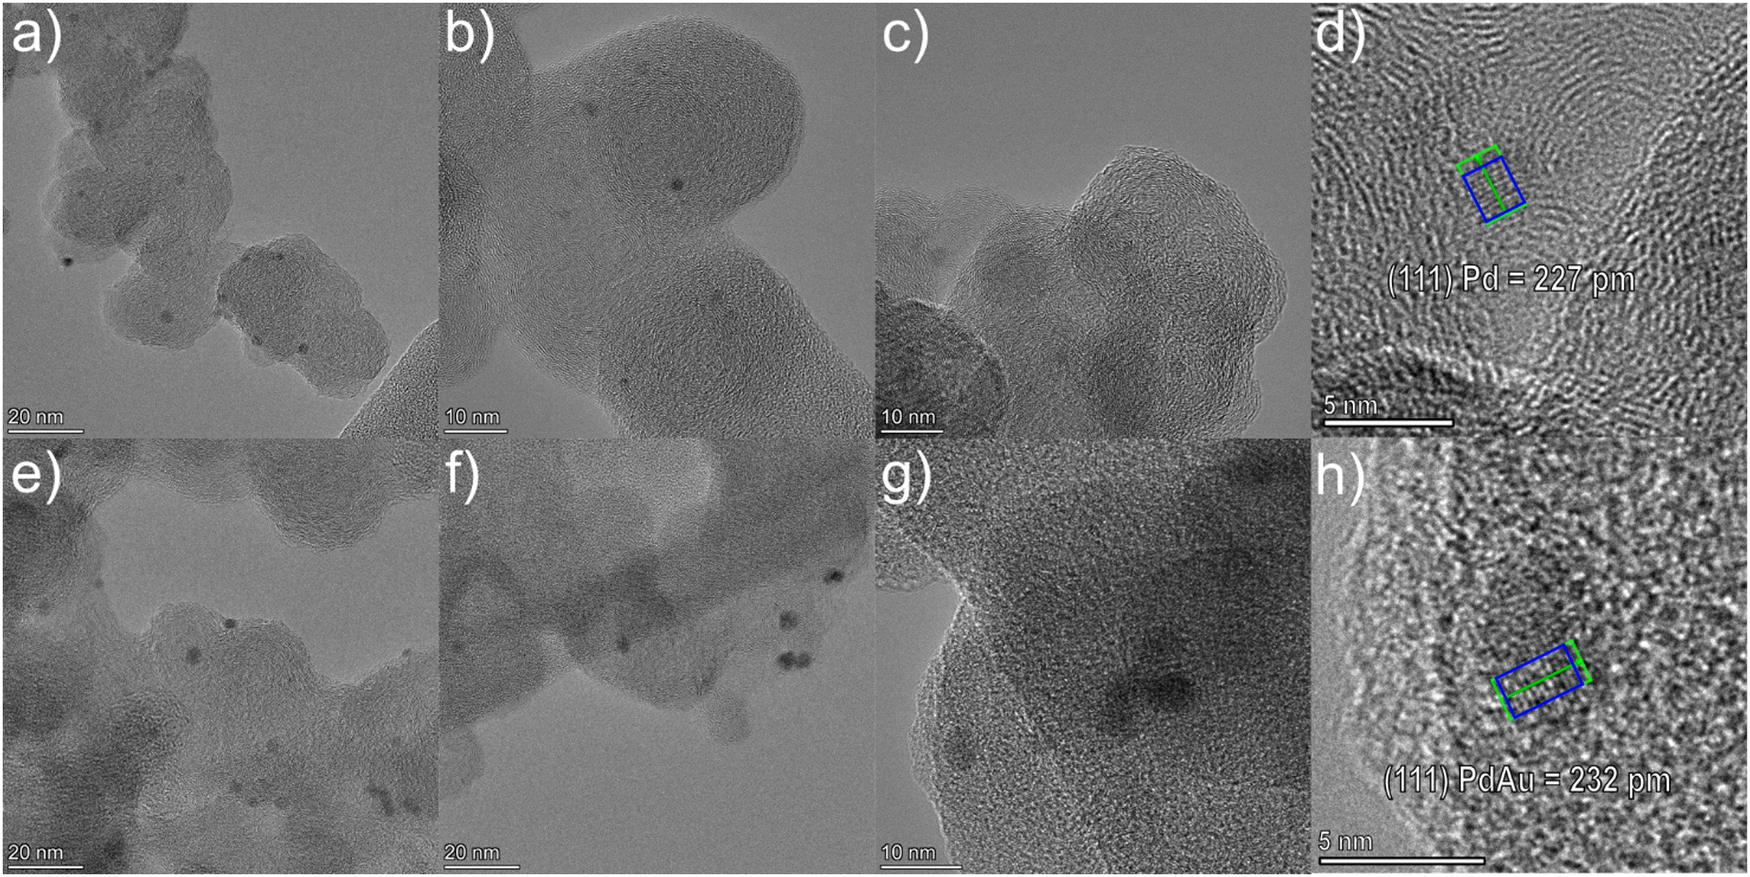
HR-TEM analysis was used to probe the nanostructure and elemental distribution for both Pd/C and PdAu/C (Fig. 1). Both samples have homogeneous distributed NPs of approximately 2–3 nm diameter. The lattice spacings of isolated NPs were examined in both samples. For Pd/C the value of 227 pm corresponds to Pd(111) (Fig. 1d). By comparison, in the PdAu/C sample the lattice spacing was measured as 232 pm (Fig. 1h). This lattice expansion indicates the formation of a PdAu alloy.
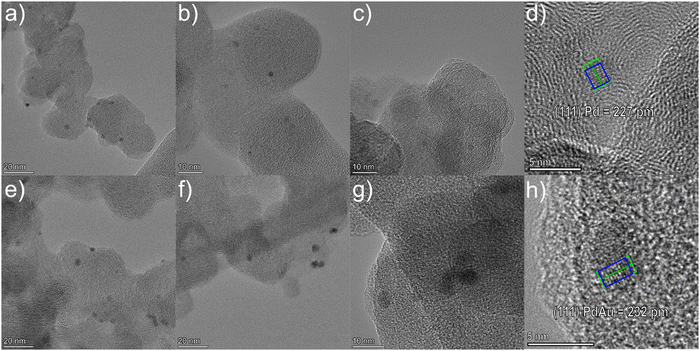 |
| | Fig. 1 HR-TEM images of (a)–(c) Pd/C and (e)–(g) PdAu/C and measured lattice spacings of an individual Pd NP (d) and an individual PdAu NP (h). | |
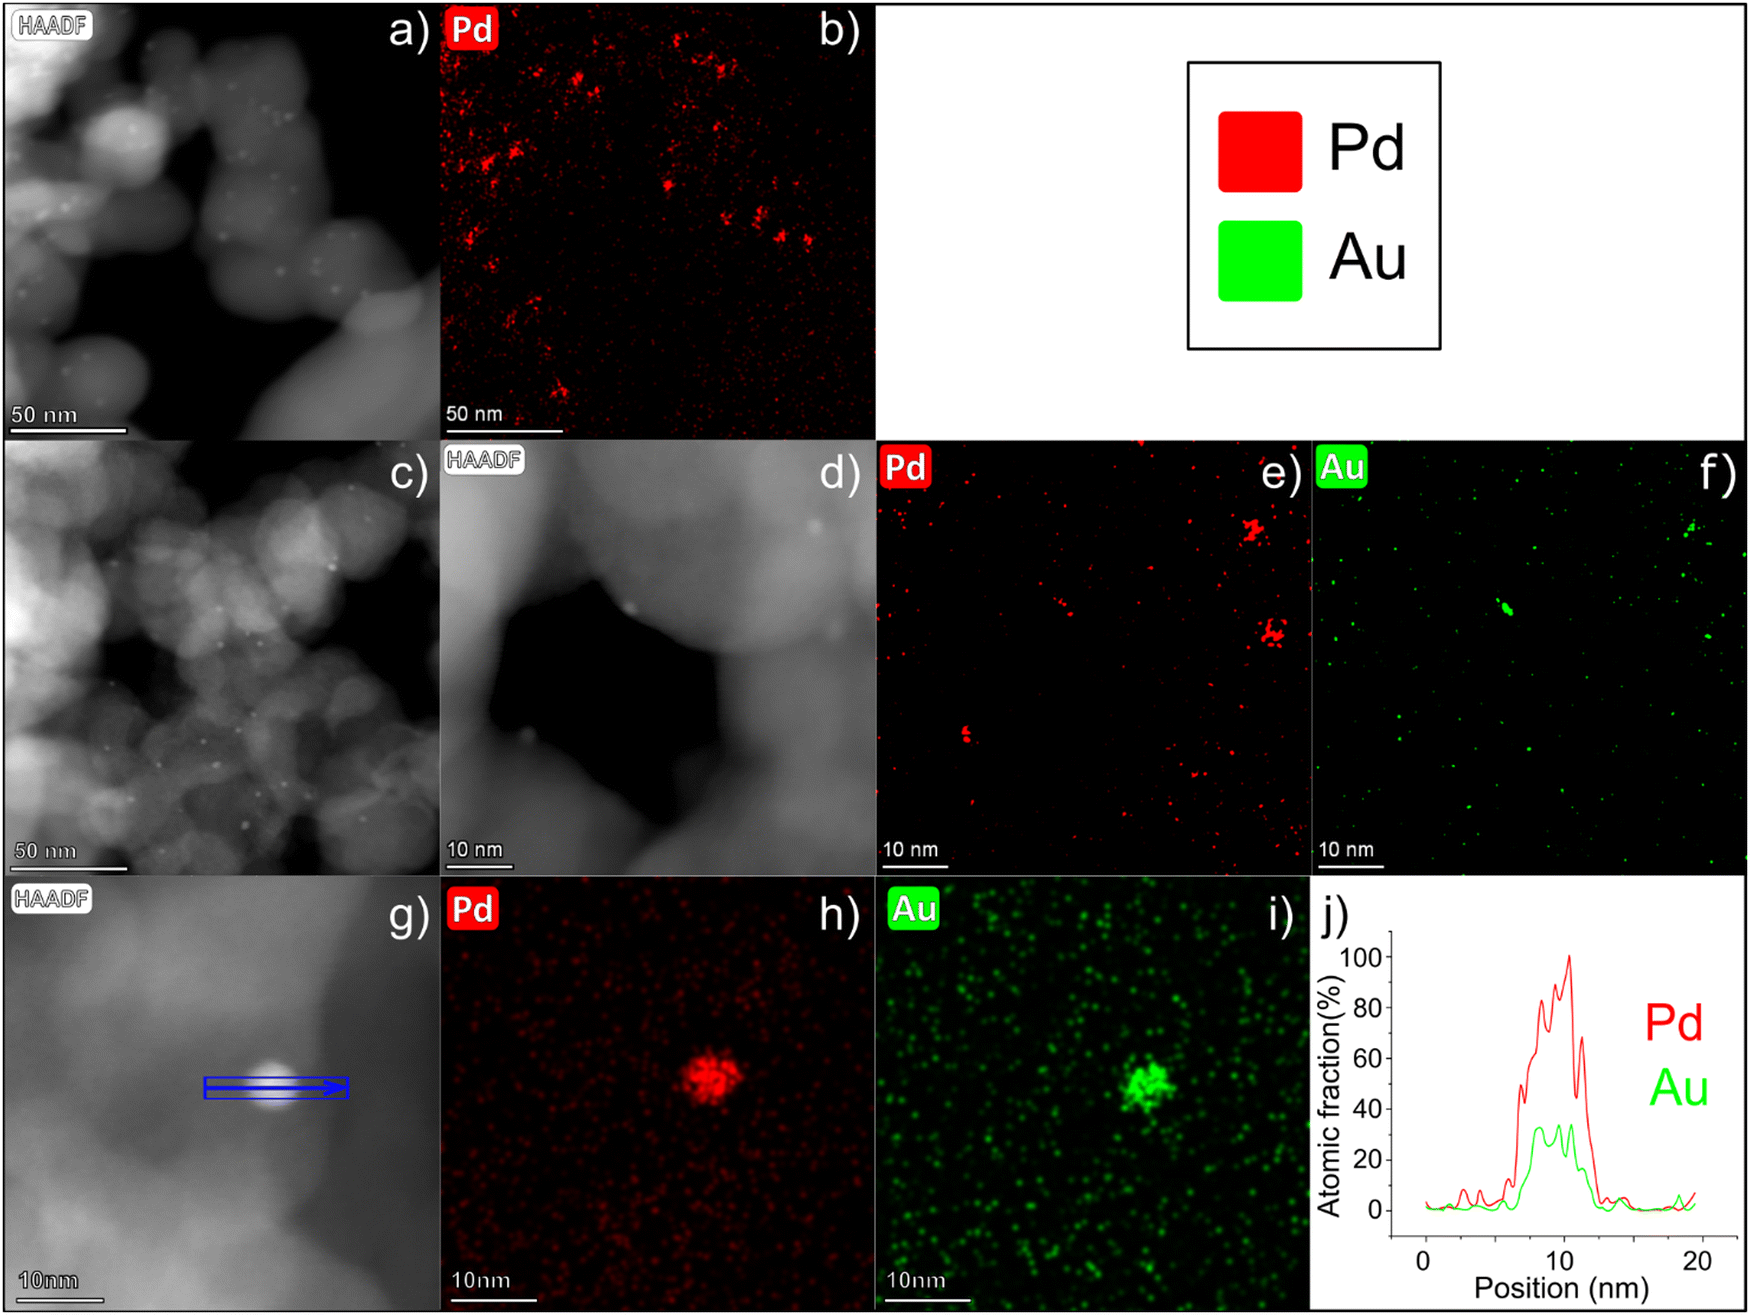
Representative high angular annular dark field (HAADF)-STEM images of PdAu/C (Fig. 2c and d) confirm the presence of small (2–3 nm) NPs highly dispersed over the carbon support. EDX analysis of different PdAu/C sample areas confirms the coexistence of both metals, Au and Pd, in single NPs and with an average composition of 76 wt% Pd and 24 wt% Au (SD = 5) (Fig. 2e and f and Fig. S3, ESI†), confirming that the composition of each individual NP matches the bulk catalyst composition determined by inductively coupled plasma optical emission spectrometry (ICP-OES) analysis.25 In Fig. 2a, a HAADF-STEM image is shown of Pd/C. An EDX map for Pd was obtained for the same region and this is shown in Fig. 2b. The images confirm a well dispersed Pd NP catalyst with a mean NP size similar to the PdAu/C catalyst. A quantitative EDX analysis was carried out on a selected 5 nm PdAu nanoparticle (see Fig. 2g) where the coexistence of Pd and Au in the same region can be seen more clearly (elemental maps Fig. 2h and i). Fig. 2j shows the atomic fraction % of each element over the length of the NP. The analysis reveals an elevated concentration of Pd in the core, while a constant Au signal is registered over the entire intensity profile. The registered intensity profile agrees with the presence of NPs having a Pd-rich core and an Au-enrichment on the NPs surface. The NP core atomic ratio is approximately Pd![[thin space (1/6-em)]](https://www.rsc.org/images/entities/char_2009.gif) :Au 3:1 whereas at the surface the Pd:Au ratio is closer to 2:1. An enrichment of the surface of Au compared to Pd can enhance alcohol electrochemical oxidation reactions as is discussed in detail below.26,31
:Au 3:1 whereas at the surface the Pd:Au ratio is closer to 2:1. An enrichment of the surface of Au compared to Pd can enhance alcohol electrochemical oxidation reactions as is discussed in detail below.26,31
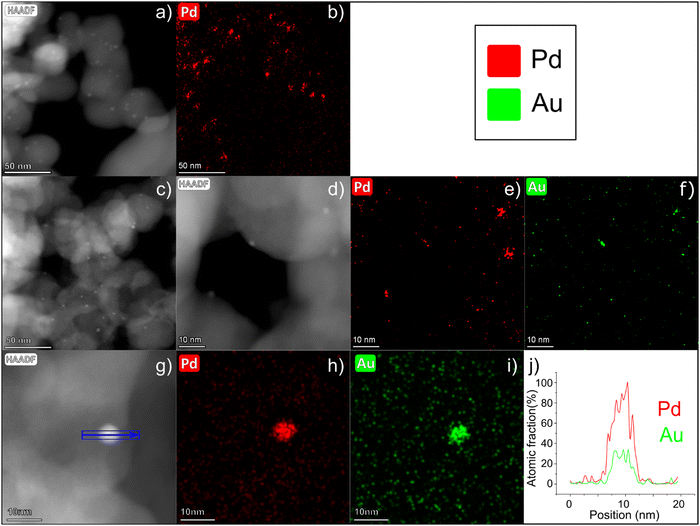 |
| | Fig. 2 (a) HAADF-STEM image of Pd/C and (b) the relative EDX of Pd distribution. (c) and (d) HAADF-STEM images of Au–Pd/C and (e) and (f) EDX analysis for Pd and Au of the region shown in f. (g) HAADF-STEM image of a single Au–Pd nanoparticle and relative EDS analysis:(h) Pd, (i) Au and (j) atomic fraction (%) profile of the selected nanoparticle. | |
3.2 Electrochemical characterization
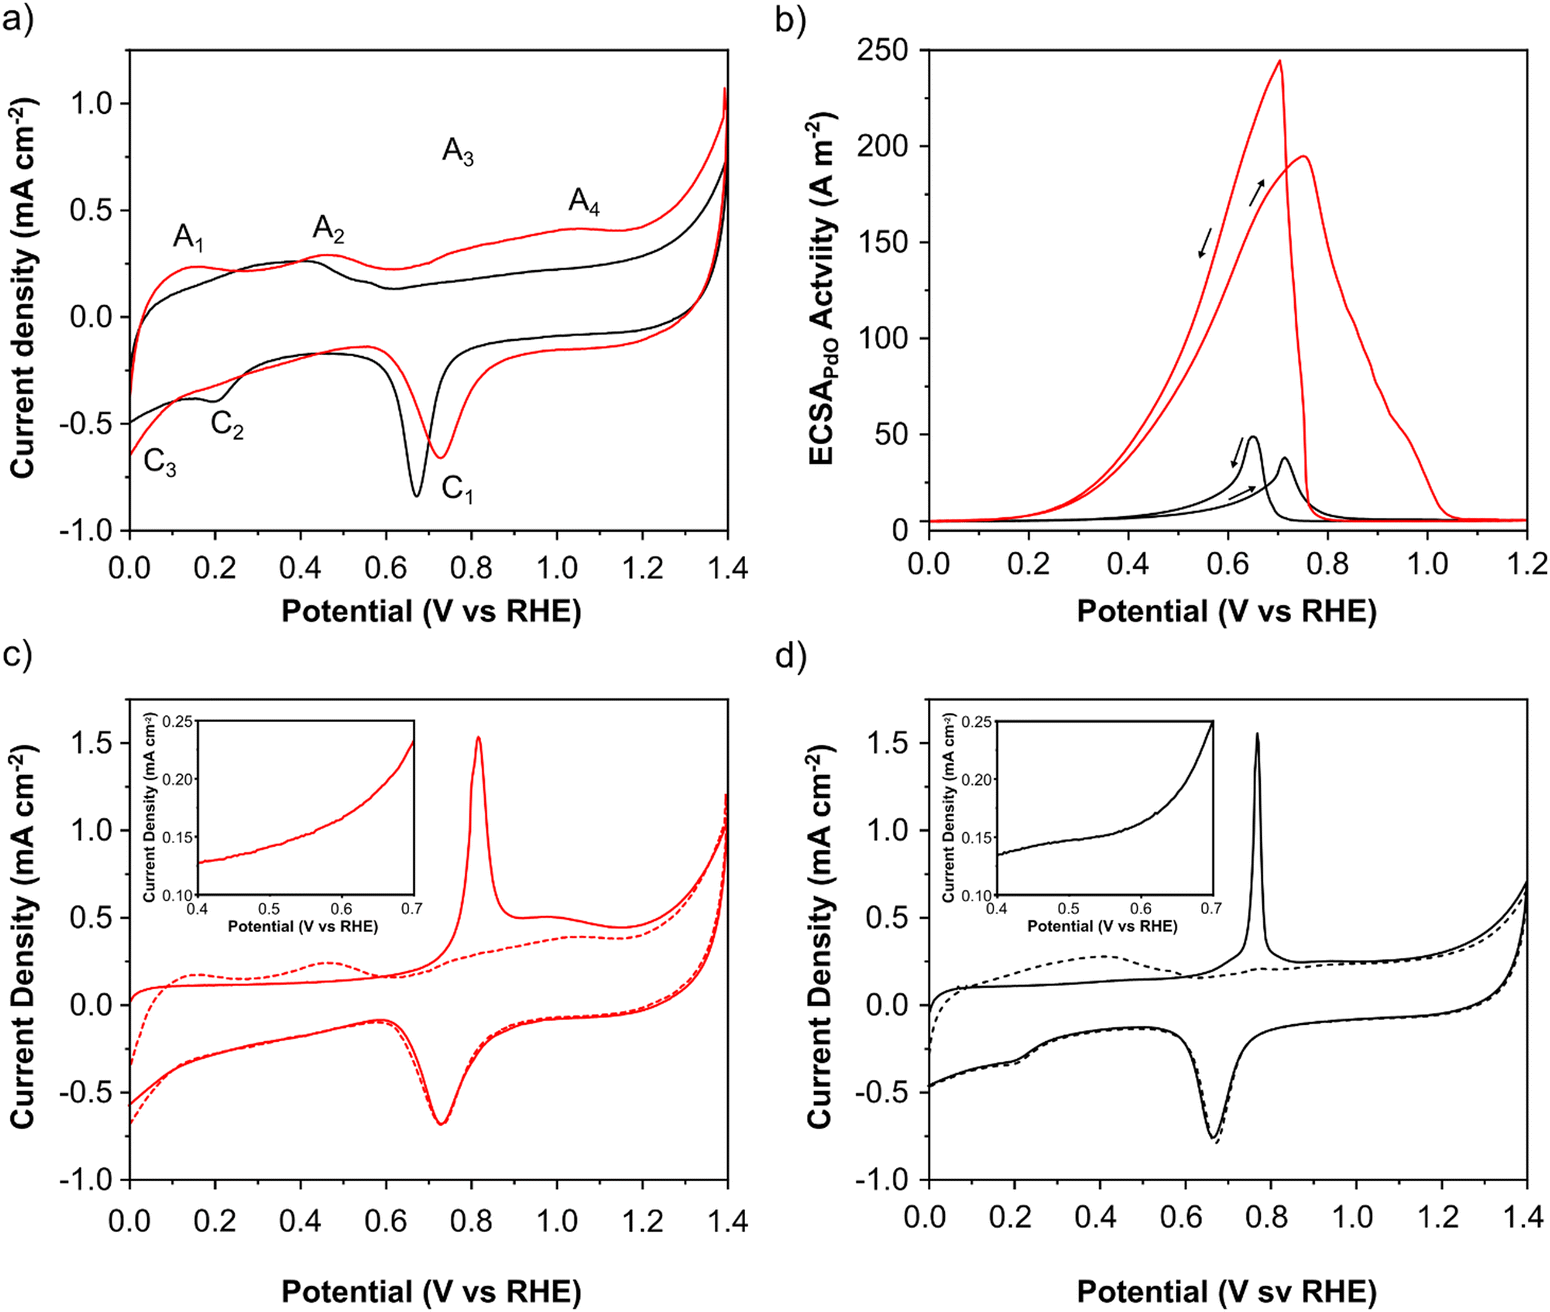
The electrochemical characteristics of PdAu/C and Pd/C were evaluated using cyclic voltammetry (CV) and adsorbed CO electrochemical oxidation studies (Fig. 3a and c, d). Important electrochemical data for both catalysts is summarized in Table 1. CV measurements were made in N2 saturated 2 M aqueous solutions of KOH (Fig. 3a). Both catalysts exhibit 4 anodic and 3 cathodic features characteristic of Pd that can be assigned as follows: A1 - oxidative hydrogen desorption, A2 - formation of Pd–OH and A3–A4 - Pd oxide formation. On the cathodic sweep a well-defined peak at approximately 0.7 V (C1) corresponds to surface layer PdO reduction. The C2 feature corresponds to the formation of Pd–H and C3 to H2 evolution. The PdO reduction peak (C1) of PdAu is shifted anodically compared to Pd/C showing that individual Pd atoms are more resistant to oxidation and passivation. The charge associated with this peak can be used to estimate the electrochemically active surface area (EASA) of the Pd surface. Values of 33 and 26 m2 gPd−1, were calculated for PdAu/C and Pd/C respectively. The CO stripping voltammograms (Fig. 3c and d) of PdAu/C and Pd/C respectively show a difference in the onset potential of CO stripping (figure inserts) which is anticipated for the PdAu surface, indicating that this catalyst can oxidize the adsorbed CO at lower potentials indicating that PdAu/C will also anticipate and accelerate the formate oxidation process. The electrochemically active surface area of each catalyst was also estimated from the COads oxidation voltammograms and the CV post CO stripping shown in Fig. 3c and d. Values of 48 and 20 m2 gPd−1, were calculated for PdAu/C and Pd/C respectively.
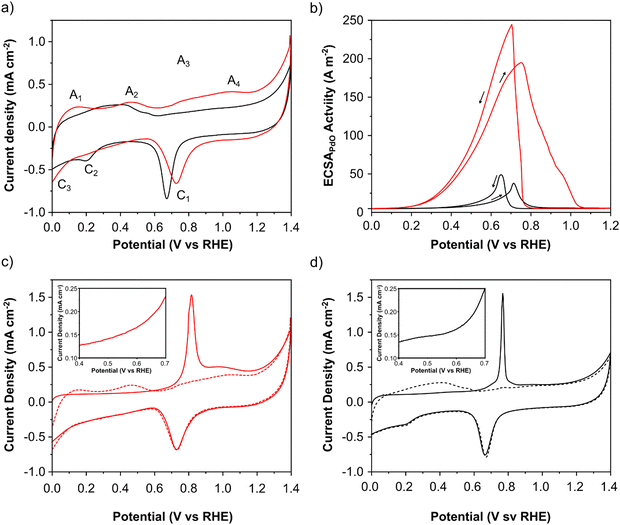 |
| | Fig. 3 Electrochemical characterization (a) CVs of PdAu/C (red) and Pd/C (black) (N2 saturated 2 M KOH; 0 to 1.4 V (RHE) scan rate 50 mV s−1); (b) in N2 saturated 2 M HCOOK and 2 M KOH (0 to 1.2 V (RHE) at a scan rate 50 mV s−1). COads stripping curves (full curves) and CVs after COads stripping (dashed curves) both at 20 mV s−1 s for (c) PdAu/C and (d) Pd/C respectively. The inserts within figures (c) and (d) show a zoom on the onset region of CO oxidation. | |
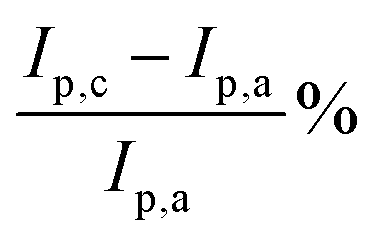
Table 1 Important electrochemical data for PdAu/C and Pd/C
|
|
Metal loading % |
EASA PdOx m2 gPd−1 |
EASA COstrip m2 gPd−1 |
CV Cdl mF cm−2 |
EIS Cdl mF cm−2 |
R
ct Ω |
I
p,a A m−2 |
I
p,c A m−2 |

|
| PdAu/C |
9Pd3Au |
33 |
48 |
4.22 |
2.78 |
56 |
168.85 |
225.69 |
33.66 |
| Pd/C |
10Pd |
26 |
20 |
3.07 |
2.27 |
201 |
49.49 |
65.61 |
32.57 |
The increased activity for formate oxidation of PdAu/C compared to Pd/C is confirmed by a CV study in N2-purged 2 M potassium formate and 2 M KOH electrolyte (Fig. 3b). The onset potential for formate oxidation is approximately 0.1 V for PdAu/C which is 200 mV earlier than Pd/C catalyst. This result clearly confirms the indications provided by CO stripping voltammetry that show a lower onset for catalytic activity on the alloy PdAu surface compared to Pd. The electrochemical surface area weighted current density of the anodic peak on the forward scan is approximately five times that of Pd/C (Fig. 3b). The large difference between the two catalysts in EASA weighted current density for potassium formate oxidation shows that the Pd atoms present on the surface of PdAu/C are more active than the Pd atoms on the Pd/C surface. As the anode potential becomes more positive in the forward scans in Fig. 3b, the intensity of the anodic current is limited by the progressive coverage of the Pd surface by inactive Pd oxides.32 Significantly, the PdAu/C catalyst remains active for potassium formate oxidation at potentials above 1 V (RHE), whereas the Pd/C catalyst surface is fully oxidized and inactive at potentials above 0.85 V (RHE). The reverse scans show a further anodic peak occurring at 0.7 V due to the oxidation of potassium formate on the electrocatalyst surface that is freed of Pd oxides. This process occurs earlier for the PdAu/C catalyst suggesting that the Pd surface is more resistant to the formation of inactive oxides.
For a number of catalytic and electrocatalytic reactions PdAu catalysts have been shown to have enhanced activity compared to their monometallic equivalents.33,34 PdAu alloys enhance alcohol electrooxidation at high pHs35,36 although the promotional role of Pd or Au is still not clearly defined. Bimetallic systems often introduce morphological and structural changes which can include the dilution of one atom type on the surface, create different lattice parameters, promote possible electron charge transfer between different metal atoms, and formation of acute phase boundaries.37 Isolated Pd atoms in electrochemical oxidation reactions are highly active catalytic sites with decreased species adsorption energy compared to pure Pd crystals. This has been demonstrated for Pd–CeO2 composite electrocatalysts used for the hydrogen oxidation reaction in AEM fuel cells.38–40 Consequently, the role of the increased concentration of surface Au is to dilute and stabilize individual surface Pd atoms.28 Additionally, pure Au regions on the surface promote formate adsorption, while Pd-rich alloyed regions promote formate oxidation. The incorporation of an oxophilic metal (like Au) near to Pd atoms exploits enhanced OH transfer. Adsorbed OH, on or adjacent to Pd sites, is vital in enhancing the oxidation of CO adsorbed onto Pd sites.27Fig. 2 reveals that the onset potential for CO oxidation on PdAu/C is negatively shifted when compared to Pd/C. This underlines the propensity of PdAu/C to generate more readily Pd–OHad (eqn (2) and (3)) via a bifunctional interaction between Pd and Au, helping to remove site occupying adsorbed hydrogen and oxidize adsorbed species.41
| | | Pd + Pd–HCOOad → Pd–Had + Pd–(COO)ad | (2) |
| | | Pd–(COO)ad + Pd–Had + Au–OHad → 2Pd + Au + H2O + CO2 | (3) |
Consequently, the Pd–Au nanoparticle surface enhances formate oxidation through the combination of creating highly active isolated Pd atoms and favoring a bi-functional mechanism whereby the oxophilic Au atoms promote OH transfer to the Pd active sites where formate oxidation takes place. These results are confirmed by the direct formate fuel cell data that is discussed in the following section.
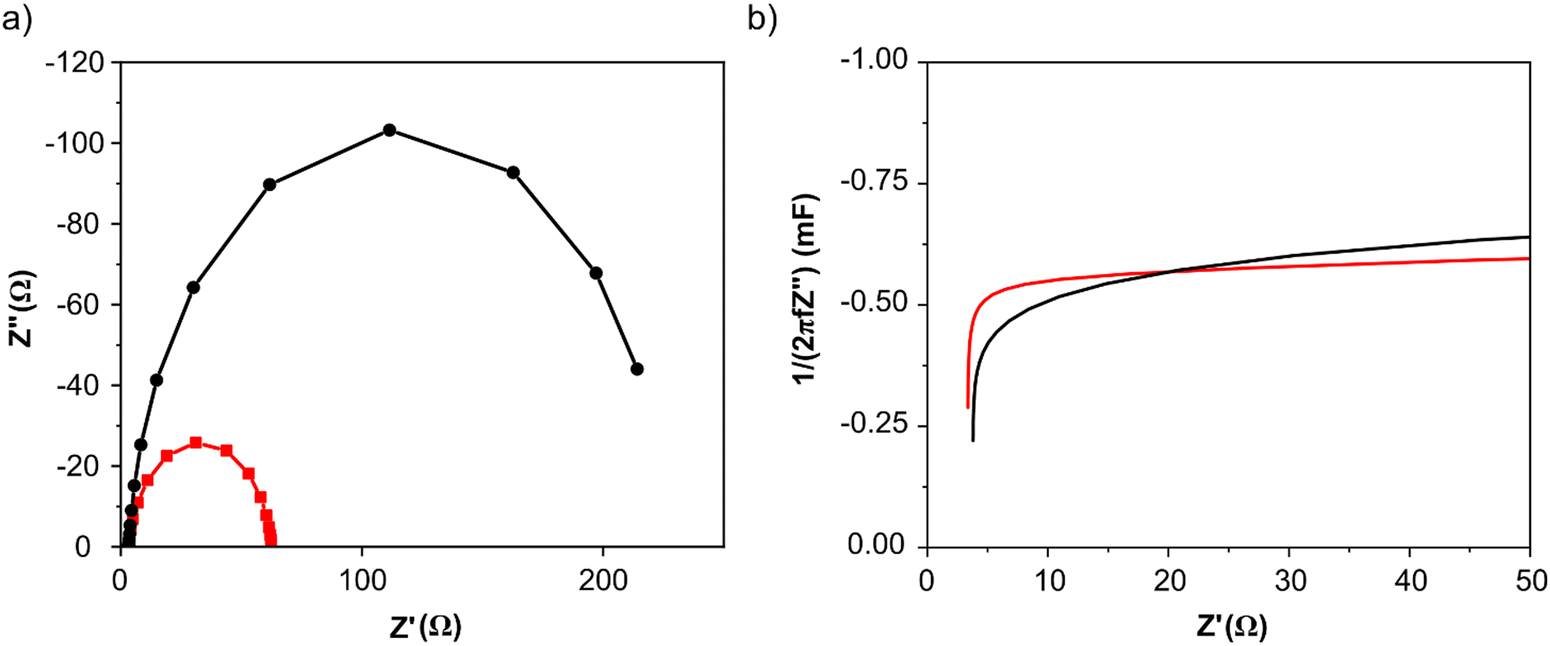
Electrochemical impedance spectroscopy (EIS) measurements were recorded at 0.4 V vs. RHE in N2 saturated 2 M potassium formate and 2 M KOH aqueous solution. Nyquist plots for both catalysts are shown in Fig. 4a: the intercept for both curves that occurs at higher frequency represents Rs, is 3 Ohm for both catalysts, while the intercept at lower frequency represents the sum of the Rs and the charge-transfer resistance Rct. As visible from the red curve, PdAu/C has a much lower charge transfer resistance compared to Pd/C confirming higher potassium formate oxidation catalytic activity; data were fitted using a Randle circuit, and the respective extrapolated Rct and Cdl values are reported in Table 1. Extrapolated EIS Cdl values present the same trend for the two catalysts as found through CV techniques (Table 1). Capacitance plots, shown in Fig. 4b, were obtained plotting capacitance values (C) versus the real part of impedance Z′(Ω). Capacitance was calculated using the following equation (eqn (4)) where f is the frequency (Hz) and Z′′ is the imaginary part of the impedance (Ω).
| |  | (4) |
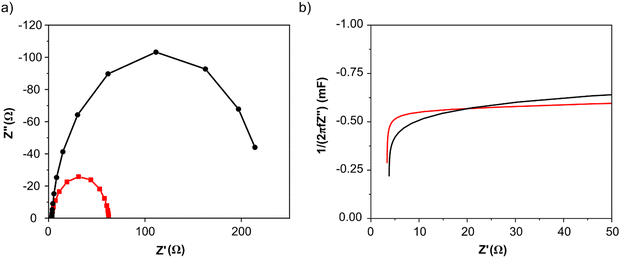 |
| | Fig. 4 Electrochemical impedance spectroscopy (EIS) of PdAu/C (red curves) and Pd/C (black curves) in KOH 2 M at 0.4 V vs. RHE: (a) Nyquist plot and (b) capacitance plot. | |
The graphs show how the ionic resistance increases with the decreasing of the frequency (f), as more catalyst surface area becomes involved; while the steepness of the initial slope of the capacitance plot gives an idea of the conductivity within the catalyst layer. The PdAu/C catalyst exhibits a steeper initial slope suggesting higher conductivity and increased oxidation kinetics compared to the equivalent Pd/C material.42,43 The roughness factor (RF) of both synthesized catalysts was also evaluated by capacitance measurements through CVs at different scan rates (from 0.01 to 0.1 V s−1) in the double layer region (Fig. S4, ESI†). The Cdl values determined for PdAu/C and Pd/C are 4.22 and 3.07 mF cm−2 respectively.
3.3 Fuel cell testing
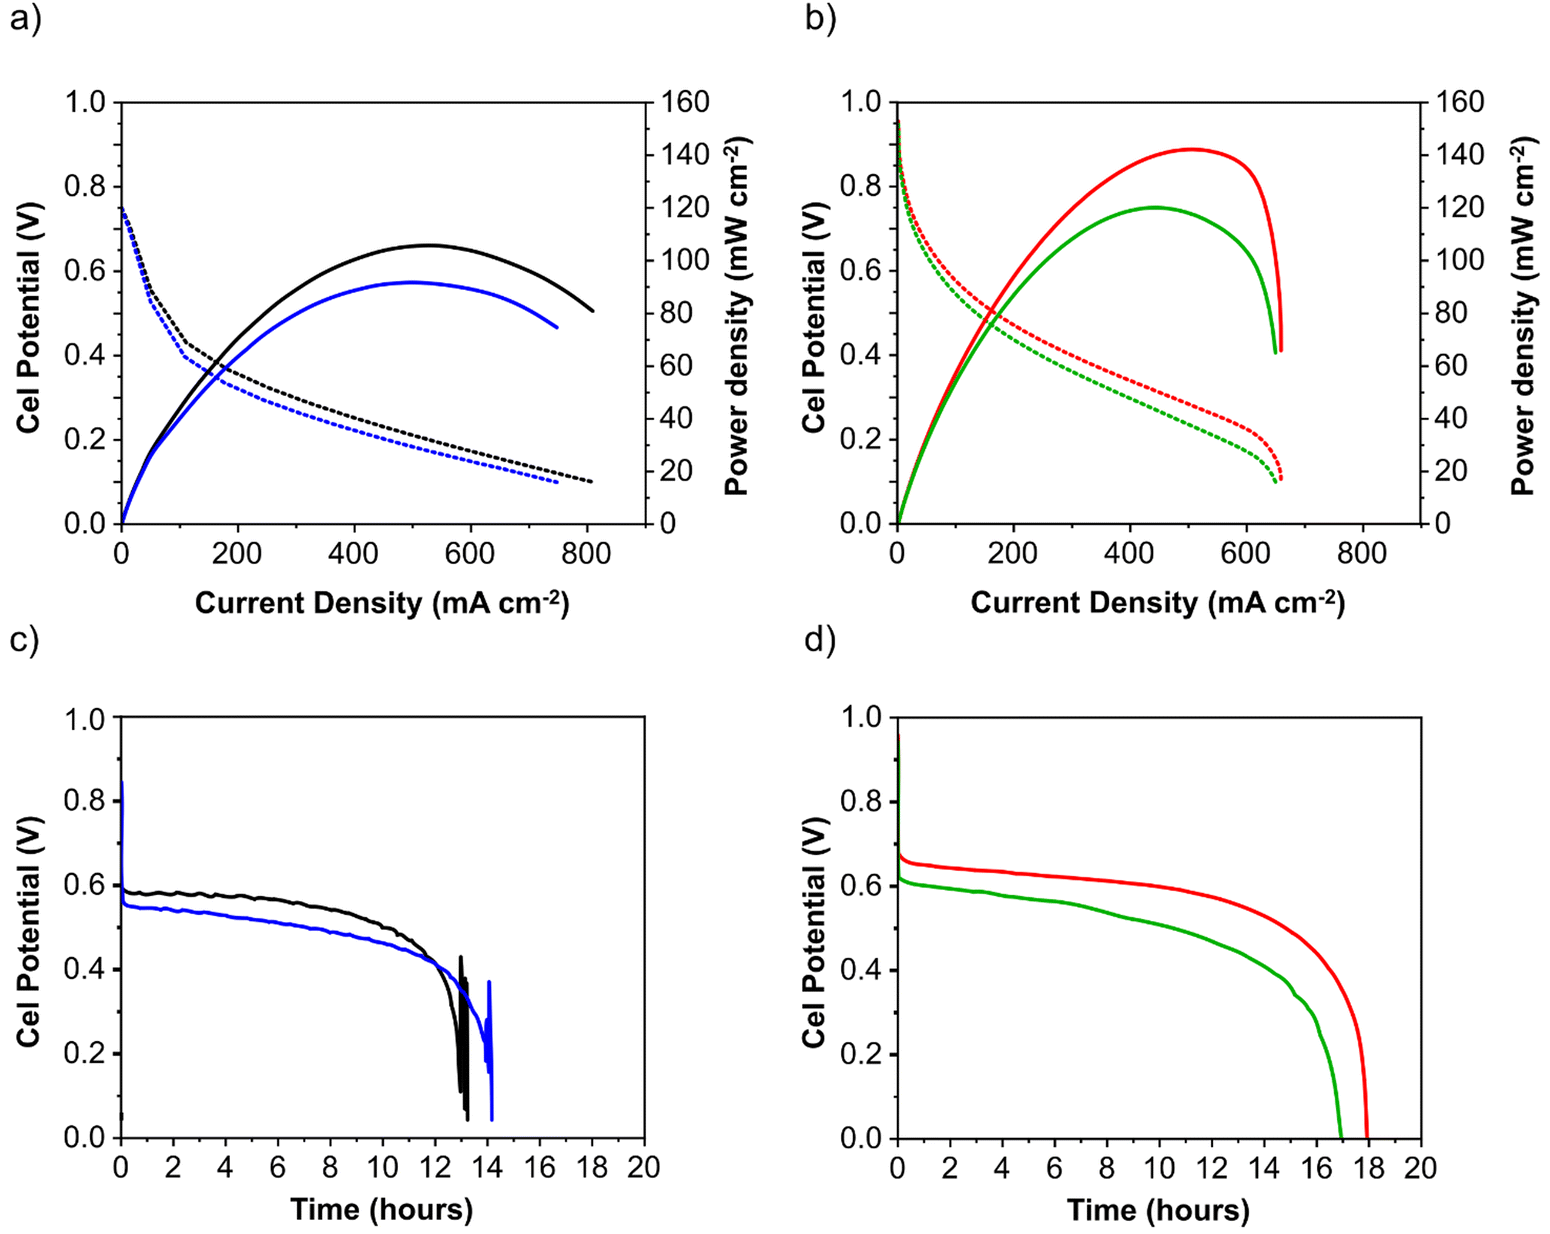
Anode electrodes were prepared by coating a nickel foam support with a homogeneous mixture of PTFE as binder and anode catalyst (Pd/C anode with Pd loading 1.3 mg cm−2 or PdAu/C anode with a Pd loading of 1.2 mg cm−2). The membrane electrode assembly (MEA) for cell testing was formed by pressing this anode electrode within the fuel cell hardware together with an anion exchange membrane (FUMASEP FAA-3-30 purchased from Fumatech BWT GmbH (Germany)) and a Fe–Co/C coated carbon cloth cathode also with PTFE as binder. The non-precious metal cathode catalyst Fe–Co/C has been reported previously by our group.9,10,42 An aqueous 1 M HCOOK fuel solution (30 mL) containing 1 M KOH (1:1 molar ratio) was recycled through the anode compartment at 1 mL min−1 while humidified O2 was fed to the cathode at 0.1 slm. Cell potential scans and constant current density experiments were carried out at a cell temperature of between 40 and 60 °C. Cell voltage and power density versus current density curves are shown in Fig. 5 and important fuel cell data is listed in Table S4 (ESI†). For both MEAs, five consecutive tests were carried with the following procedure; a voltage scan from open circuit voltage (OCV) to 0.1 V (at 10 mV s−1) with a return scan, followed by a test at 0.05 A cm−2 constant current density (end of test when the cell voltage reached 0 V). For each of the five cycles a fresh fuel solution was used. The fuel cell curves and constant current experiments for the 1st and 5th experiments are shown in Fig. 5c and d for Pd/C and PdAu/C respectively. This experimental strategy provides an insight into the stability of a single MEA to continued cycling in the working fuel cell. As can be seen in Fig. 5a and b, the fuel cell with PdAu/C anode initially produces 140 mW cm−2 peak power density compared to 100 mW cm−2 with the Pd/C anode catalyst. After five cycles of testing both cells produce less peak power density. The PdAu/C anode retains a higher level of power density output (120 mW cm−2vs. 90 mW cm−2 for Pd/C). When a constant current density is applied to both cells it is also clear that the PdAu/C cell performs consistently at a higher cell potential and run time reaching 16–18 h of operation compared to 12–14 h for Pd/C (Fig. 5c and d). Both of these results reveal better energy efficiency and faradaic efficiency the fuel cell using PdAu/C as anode catalyst compared to Pd/C (see Table S4, ESI†). The PdAu/C anode has a formate fuel energy efficiency (EE) of 33% compared to 25% for the Pd/C cell and consumes 80% of the fuel in each batch compared to 65% for Pd/C (FE). The EE and FE calculations are reported in the ESI.† Catalyst stability under the fuel cell working conditions of the anode is another important factor in determining the sustainability of such materials. Recent research has highlighted the instability of Pd to electrochemical dissolution at high pH when subjected to high anodic potentials such as those that may occur at the anode of a Direct Alcohol Fuel Cell.29 This work by Berretti and co-workers showed that when using formate as fuel, anode electrode Pd loss is negligible compared to the case of a direct ethanol fuel cell (DEFC) where Pd dissolution occurs under polarization cycles (KOH 2 M + EtOH 2 M) shown by in situ in-operando X-ray absorption voltammetry.29 This makes formate an attractive candidate for use as fuel in direct alkaline fuel cells with improved stability over the lifetime of the fuel cell. Additionally, as demonstrated in this paper, the development of electrocatalysts resistant to dissolution at anodic potentials will enhance further the fuel cell lifetime. The PdAu/C catalyst reported here shows enhanced activity and stability due to the resistance to oxidation and passivation of the Pd surface compare to the equivalent Pd/C catalyst as shown in the electrochemical experiments. The improved performance is highlighted also by the low loading of Pd in the Pd–Au anode when compared to other Pd based catalysts recently reported in the literature in DFFCs (see Table S3, ESI†). We have carried out additional fuel cell experiments running with single pass formate fuel feed (without recycling of the fuel solution). This enabled us to study the stability of performance of the catalyst at constant current density without any contribution from diminishing fuel concentration over time or through accumulation of the reaction products in the recirculating fuel solution. The net reaction occurring during fuel cell operation (eqn (5)) shows that potassium formate is transformed into potassium carbonate through oxidation and combination with the KOH electrolyte. Hence, the product K2CO3 accumulates in the aqueous fuel solution that circulates during operation.| |  | (5) |
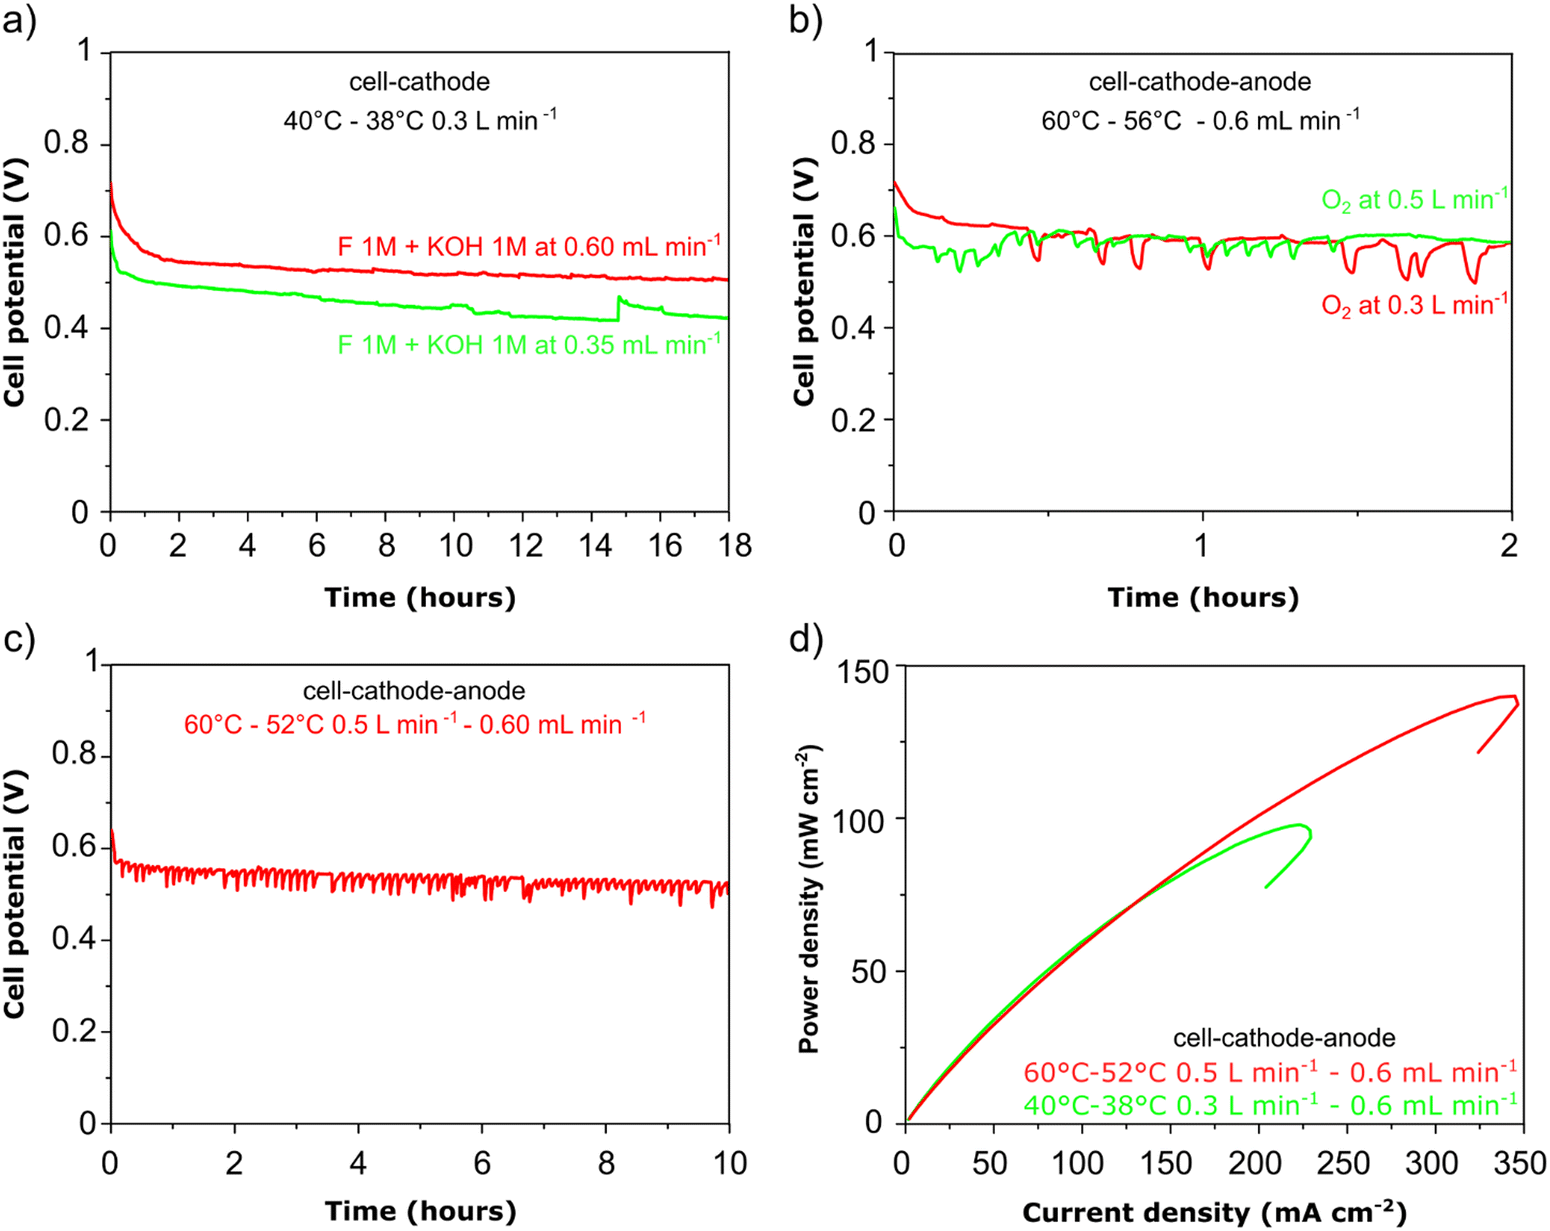
In Fig. 6a, the cell voltage is shown over time at a constant current density of 0.05 A cm−2. The formate fuel flow at the anode was investigated at two speeds and the results show that the higher flow of anode fuel resulted in a higher cell voltage and more stable performance suggesting that providing fresh fuel at the anode and swift removal of reaction products helps to maintain stability. In Fig. 6b, the cathode oxygen flow was tested at two flow rates, and it is clear that the oxygen flow rate did not impact the cell performance or stability. However, as can be seen for the curve obtained at 0.3 slm in Fig. 6b, there is a large drop (up to 100 mV) in cell potential periodically during the test, after which the cell potential gradually returns to the initial value. We suggest this is due to the accumulation and then removal of liquid water at the cathode during operation that covers the electrode surface blocking active sites. As shown in Fig. 6c, a higher cathode flow rate reduces this phenomenon as the accumulation of liquid water at the cathode cannot occur to the same extent In Fig. 6d, power density vs. current density curves are shown at two cell temperatures, 40 and 60 °C respectively. A significantly better peak power density and current density was obtained at the higher temperature as can be expected for fuel cells. At the same time, up to a current density of 150 mA cm−2 there is no difference in the power output at both temperatures and this is reflected in the stable cell voltage obtained at 0.05 A cm−2 at both 40 and 60 °C (Fig. 6a–c).
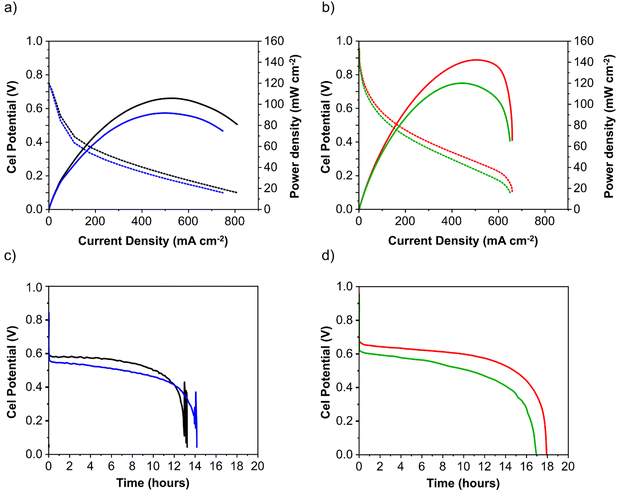 |
| | Fig. 5 Direct formate fuel cell experiments containing the Pd/C (a) and (c) and PdAu/C anode (b) and (d). All cells used FeCo/C cathode catalyst and Fumatech FAA-3-30 AEM. The fuel was 1 M HCOOK and 1 M KOH. Tcell 60 °C: figures (a) and (b) are voltage and power density curves. Figures (c) and (d) are cell voltage at constant current density 0.05 A cm−2. First and fifth cycle for Pd/C are respectively black and blue curves, while for PdAu/C are red and green. | |
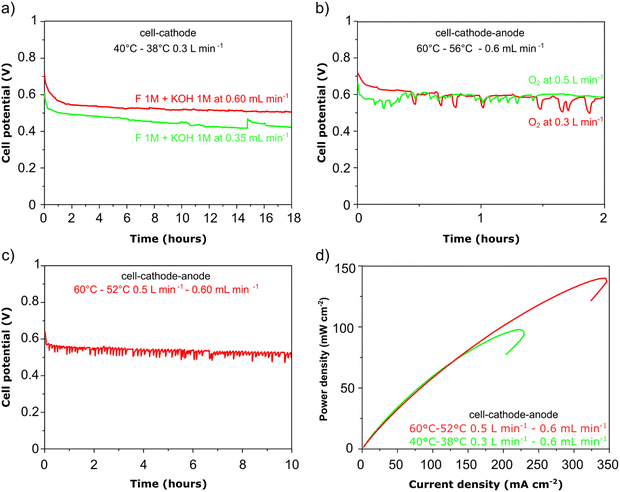 |
| | Fig. 6 DFFC stability experiments carried out a single pass fuel feed (galvanostatic – 0.05 A cm−2). (a) Variable anode flow; (b) variable cathode flow; (c) high anode and high cathode flow test showing stable power density delivery; (d) power density vs. current density curves at variable cell temperature. All experiments fuel composition 1 M KOH and 1 M HCOOK. | |
4. Conclusions
This article describes the synthesis using MVS of Pd/C and PdAu/C catalysts containing size-controlled NPs (mean diameter 2–3 nm) and the study of the activity for the oxidation of formate in direct liquid fuel cells. The nano structure of the NP surfaces is fundamental to determining the catalytic activity and selectivity and can vary significantly from the core composition. In this example, the surface composition is closer to a 2:1 Pd:Au atomic ratio compared to the 3:1 ratio of the bulk NP core. The dilution of the Pd atoms on the NP surface with Au atoms enables an enhancement in activity compared to the Pd only surface, through isolation and stabilization of individual Pd atoms. Additionally, the oxophilic nature of the surface is also increased with more Au present which also accelerates the formate oxidation reaction through improved OH− transfer to the active Pd sites. These aspects translate to higher power densities, energy efficiencies and faradaic efficiencies when PdAu/C is employed in a direct formate fuel cell. Understanding how the chemical composition of nanoparticle surfaces relates to catalytic activity is fundamental for the development of more sustainable materials for fuel cell devices. Combined with the availability of potassium formate obtained from the electrochemical reduction of CO2, will stimulate the possible development of large scale DFFCs linked to seasonal energy storage. Such development is currently underway as part of the Horizon Europe funded project FRESH (Formate for Renewable Energy Storage GA 101069605).44
Data availability
The authors confirm that the data supporting the findings of this study are available within the article and its ESI.† Raw data that support the findings of this study are available from the corresponding authors upon reasonable request.
Conflicts of interest
There are no conflicts to declare.
Acknowledgements
The authors acknowledge the financial support provided by the FRESH project from the European Union's Horizon research and innovation program under grant agreement HORIZON-RIA-101069605. MVP acknowledges Made in Italy – Circular and Sustainable (MICS) Extended Partnership funded by the European Union Next-Generation EU (Piano Nazionale di Ripresa e Resilienza (PNRR) – Missione 4, Componente 2, Investimento 1.3 – D.D. 1551.11-10-2022, PE00000004). The authors also acknowledge the contribution of Dr Niccolò Paoletti for carrying out some of the electrochemical measurements.
References
- E. T. A. Mitchard, Nature, 2018, 559, 527–534 CrossRef CAS PubMed.
- J. Artz, T. E. Müller, K. Thenert, J. Kleinekorte, R. Meys, A. Sternberg, A. Bardow and W. Leitner, Chem. Rev., 2018, 118, 434–504 CrossRef CAS PubMed.
- S. Zhang, Q. Fan, R. Xia and T. J. Meyer, Acc. Chem. Res., 2020, 53, 255–264 CrossRef CAS PubMed.
- H. Xiang, H. A. Miller, M. Bellini, H. Christensen, K. Scott, S. Rasul and E. H. Yu, Sustainable Energy Fuels, 2020, 4, 277–284 RSC.
- V. K. Visvanathan, K. Palaniswamy, D. Ponnaiyan, M. Chandran, T. Kumaresan, J. Ramasamy and S. Sundaram, Energies, 2023, 16, 2748 CrossRef CAS.
- T. Takahashi, T. Ikeda, K. Murata, O. Hotaka, S. Hasegawa, Y. Tachikawa, M. Nishihara, J. Matsuda, T. Kitahara, S. M. Lyth, A. Hayashi and K. Sasaki, J. Electrochem. Soc., 2022, 169, 044523 CrossRef CAS.
- T. Yang, S. Hou, J. Xing, C. Liu, J. Ge and W. Xing, Nano Res., 2023, 16(3), 3607–3621 CrossRef.
- H. Huang, T. Yang, F. Sun, Z. Liu, Q. Tang, L. Liu, Y. Han and J. Huang, Nanoscale, 2023, 15, 2122–2133 RSC.
- T.-J. Wang, L.-B. Sun, X. Ai, P. Chen, Y. Chen and X. Wang, Adv. Mater., 2024, 36, 2403664 CrossRef CAS PubMed.
- B. Sun, Y.-C. Jiang, Q.-L. Hong, X. Liu, F.-M. Li, D.-S. Li, Y. Yang and Y. Chen, J. Energy Chem., 2023, 85, 481 CrossRef CAS.
-
H. A. Miller, F. Vizza and A. Lavacchi, Nanomaterials for Fuel Cell Catalysis, 2016, pp. 477–516 Search PubMed.
- Y. D. Du, X. T. Meng, Z. Wang, X. Zhao and J. S. Qiu, Acta Biochim. Biophys. Sin., 2022, 38, 2101009 Search PubMed.
- J. Li, X. Meng, X. Song, J. Qi, F. Liu, X. Xiao, Y. Du, G. Xu, Z. Jiang, S. Ye, S. Huang and J. Qiu, Adv Func Mats, 2024, 2316718 CrossRef CAS.
- L. An and R. Chen, J. Power Sources, 2016, 320, 127–139 CrossRef CAS.
- A. M. Bartrom and J. L. Haan, J. Power Sources, 2012, 214, 68–74 CrossRef CAS.
- L. Q. Wang, M. Bellini, J. Filippi, M. Folliero, A. Lavacchi, M. Innocenti, A. Marchionni, H. A. Miller and F. Vizza, Appl. Energy, 2016, 175, 479–487 CrossRef CAS.
- H. A. Miller, J. Ruggeri, A. Marchionni, M. Bellini, M. V. Pagliaro, C. Bartoli, A. Pucci, E. Passaglia and F. Vizza, Energies, 2018, 11, 11020369 CrossRef.
- L. An and R. Chen, J. Power Sources, 2016, 320, 127–139 CrossRef CAS.
- L. F. Guo, T. Jin, Q. Tang, J. P. Wang, B. W. Pan, Q. Wang, Z. Li, C. Y. Wang, J. W. Liu and F. Y. Chen, J. Mater. Chem. A, 2022, 10, 13998–14010 RSC.
- T. Jin, L. F. Guo, Q. Tang, J. P. Wang, B. W. Pan, C. Y. Wang, Z. Li and F. Y. Chen, J. Phys. Chem. C, 2022, 126, 9683–9695 CrossRef CAS.
- B. W. Pan, S. Shan, J. P. Wang, Q. Tang, L. F. Guo, T. Jin, Q. Wang, Z. Li, M. Usman and F. Y. Chen, Nanoscale, 2023, 15, 7032–7043 RSC.
- Z. P. Liu, J. L. Xue and Y. S. Li, Small Methods, 2023, 2300021 CrossRef CAS PubMed.
- E. Pitzalis, R. Psaro and C. Evangelisti, Inorg. Chim. Acta, 2022, 533, 120782 CrossRef CAS.
- H. Bahruji, M. Bowker, G. Hutchings, N. Dimitratos, P. Wells, E. Gibson, W. Jones, C. Brookes, D. Morgan and G. Lalev, J. Catal., 2016, 343, 133–146 CrossRef CAS.
- M. Bellini, M. G. Folliero, C. Evangelisti, Q. G. He, Y. F. Hu, M. V. Pagliaro, W. Oberhauser, A. Marchionni, J. Filippi, H. A. Miller and F. Vizza, Energy Technol., 2019, 7, 1800859 CrossRef.
- C. Evangelisti, E. Schiavi, L. A. Aronica, A. M. Caporusso, G. Vitulli, L. Bertinetti, G. Martra, A. Balerna and S. Mobilio, J. Catal., 2012, 286, 224–236 CrossRef CAS.
- M. Lukaszewski, M. Soszko and A. Czerwinski, Int. J. Electrochem. Sci., 2016, 11, 4442–4469 CrossRef CAS.
- L. L. Fang, Q. A. Tao, M. F. Li, L. W. Liao, D. Chen and Y. X. Chen, Chin. J. Chem. Phys., 2010, 23, 543–548 CrossRef CAS.
- A. N. Geraldes, D. F. da Silva, E. S. Pino, J. C. M. da Silva, R. F. B. de Souza, P. Hammer, E. V. Spinacé, A. O. Neto, M. Linardi and M. C. dos Santos, Electrochim. Acta, 2013, 111, 455–465 CrossRef CAS.
- B. Y. Jin, Y. Y. Zhang and L. H. Zhao, J. Appl. Electrochem., 2016, 46, 1147–1155 CrossRef CAS.
- D. J. Chadderdon, L. Xin, J. Qi, Y. Qiu, P. Krishna, K. L. More and W. Z. Li, Green Chem., 2014, 16, 3778–3786 RSC.
- E. Berretti, M. V. Pagliaro, A. Giaccherini, G. Montegrossi, F. Di Benedetto, G. O. Lepore, F. D’Acapito, F. Vizza and A. Lavacchi, Electrochim. Acta, 2022, 418, 140351 CrossRef CAS.
- J. Jover, M. García-Ratés and N. López, ACS Catal., 2016, 6, 4135–4143 CrossRef CAS.
- Z. Chen, S. Wang, C. Lian, Y. X. Liu, D. S. Wang, C. Chen, Q. Peng and Y. D. Li, Chem. - Asian J., 2016, 11, 351–355 CrossRef CAS PubMed.
- T. Szumelda, A. Drelinkiewicz, R. Kosydar and J. Gurgul, Appl. Catal.,
A, 2014, 487, 1–15 CrossRef CAS.
- J. G. Ruiz-Montoya, L. M. S. Nunes, A. M. Baena-Moncada, G. Tremiliosi and J. C. Morales-Gomero, Int. J. Hydrogen Energy, 2021, 46, 23670–23681 CrossRef CAS.
- F. Maroun, F. Ozanam, O. M. Magnussen and R. J. Behm, Science, 2001, 293, 1811–1814 CrossRef CAS PubMed.
- H. A. Miller, M. Bellini, D. R. Dekel and F. Vizza, Electrochem. Commun., 2022, 135, 107219 CrossRef CAS.
- H. A. Miller, M. V. Pagliaro, M. Bellini, F. Bartoli, L. Q. Wang, I. Salam, J. R. Varcoe and F. Vizza, ACS Appl. Energy Mater., 2020, 3, 10209–10214 CrossRef CAS.
- M. Bellini, M. V. Pagliaro, A. Lenarda, P. Fornasiero, M. Marelli, C. Evangelisti, M. Innocenti, Q. Y. Jia, S. Mukerjee, J. Jankovic, L. Q. Wang, J. R. Varcoe, C. B. Krishnamurthy, I. Grinberg, E. Davydova, D. R. Dekel, H. A. Miller and F. Vizza, ACS Appl. Energy Mater., 2019, 2, 4999–5008 CrossRef CAS.
- M. Choun, S. Hong and J. Lee, J. Electrochem. Soc., 2018, 165, J3266–J3270 CrossRef CAS.
- M. V. Pagliaro, M. Bellini, F. Bartoli, J. Filippi, A. Marchionni, C. Castello, W. Oberhauser, L. Poggini, B. Cortigiani, L. Capozzoli, A. Lavacchi, H. A. Miller and F. Vizza, Inorg. Chim. Acta, 2022, 543 Search PubMed.
- F. S. Saleh and E. B. Easton, J. Power Sources, 2014, 246, 392–401 CrossRef CAS.
-
https://www.iccom.cnr.it/horizon-eu-fresh/
.
|
| This journal is © The Royal Society of Chemistry 2024 |
Click here to see how this site uses Cookies. View our privacy policy here. 
 Open Access Article
 This Open Access Article is licensed under a Creative Commons Attribution-Non Commercial 3.0 Unported Licence
 a,
Lorenzo
Poggini
a,
Lorenzo
Poggini