DOI:
10.1039/C4RA03139C
(Paper)
RSC Adv., 2014,
4, 24110-24118
Effect of solvent and environmental conditions on the structural and optical properties of CdS nanoparticles
Received
8th April 2014
, Accepted 12th May 2014
First published on 15th May 2014
Abstract
Changing the solvent and environmental conditions during the preparation of CdS nanoparticles have a marked effect on the crystal structure, size distribution, nanoparticle size, absorption and emission properties. X-ray investigations revealed that the CdS nanoparticles prepared with high surface tension solvent have clearly identified hexagonal structure. However, the nanoparticles prepared with high dipole moment solvent matched a cubic structure better than a hexagonal one. Optical absorption measurements proved that CdS nanoparticles prepared in aprotic solvent showed an increase in both size of nanoparticles and size polydispersity index (SPI) with a decrease of the dipole moment, viscosity and surface tension of the solvent, which are applicable to the nanoparticles prepared under argon and ambient atmospheres. Fluorescence spectroscopy showed that the CdS nanoparticles synthesized in aprotic solvent with high dipole moment revealed a high intensity band edge emission blue band with a small half width. Also, the increase of the dipole moment of the solvent leads to a decrease in the Stokes shift for CdS nanoparticles prepared under an argon atmosphere.
Introduction
Semiconductors with nano-sized structures are exciting topic of research due to their outstanding size dependent optical properties. The excellent optical properties of semiconductors make them attractive for different applications, such as biological labels, solar cells, photodetectors and light emitting devices.1–15 Size and surface structure are crucial for adjusting the optical properties of semiconductors. The emission and absorption of semiconductors can be tuned by controlling the size of nanoparticles, and the control of surface structure could significantly improve the band edge emission and remove the trapping states on the surface of semiconductor. There are lots of research concerned with the preparation of semiconductor nanoparticle with different sizes and with factors that influence their properties.16–20
Cadmium sulfide (CdS) in its nanoscale size has attracted a lot of attention due to its many important optoelectronic applications.21–25 Despite the abundant research on the growth and optical properties of low-dimensional CdS nanostructures, a study on the effect of environmental condition on the growth of CdS nanoparticles in different solvents without the stabilizing molecules has not been reported yet. Additionally, one of the challenges in this application is the preparation of efficient blue light emitting CdS nanoparticles. In this work, we have synthesized CdS nanoparticles using cadmium acetate as a source of cadmium and thiourea as a source of sulfur in different solvents in presence of argon and ambient atmospheres. The solvents used here are dimethylformamide (DMF), acetone, ethanol and deionized water (DI-water). Two strategies are applied to control the size and surface structure of CdS nanoparticles in order to improve the size distribution and enhance the optical emission. The prepared nanoparticles were characterized by X-ray diffraction, energy dispersive X-ray, infrared, UV-Vis absorption and fluorescence spectroscopies. The effect of different solvents and various environmental conditions on both the microstructure and optical properties of CdS nanoparticles were further investigated. Fluorescence spectroscopy shows that CdS nanoparticles synthesized in aprotic solvent with high dipole moment revealed a high intensity band edge emission blue band with a small half width.
Experimental
CdS nanoparticles have been prepared by one-pot synthetic method. Cadmium acetate dihydrate (Cd(CH3COO)2·2H2O) used as a source of cadmium and the thiourea (NH2CSNH2) as a source of sulfur and as a capping material. CdS nanoparticles were prepared directly in different solvents under ambient environment and argon atmospheres as follow: interaction were carried for equimolar ratio from Cd(CH3COO)2·2H2O and NH2CSNH2 in 250 mL of solvent under heating at 60 °C for one hour after adjustment of pH = 8 by adding 1 mol L−1 NaOH. During cooling the nanopowders precipitated directly without adding any nonsolvent. The prepared nanopowders were collected by centrifuging and washed by water and acetone three times, respectively. The collected nanoparticles prepared under argon atmosphere were defined as I, III, V and VII for CdS in dimethylformamide, acetone, ethanol and deionized water, respectively. Accordingly, the collected CdS nanoparticles under ambient environment were defined as II, IV, VI, VIII respectively, as listed in Table 1.26–28
Table 1 Cd/S, O/C atomic ratios from EDX analysis for the CdS nanoparticles prepared in different solvents under ambient atmosphere (Amb. atm.) and argon atmosphere (Ar. atm.) against the dipole moment (μ), viscosity (η), surface tension (σ) and dielectric constant of different solvents24–26
| Solvent |
Sample names |
Cd/S |
O/C |
μ × (1030) cm |
η (mPa s) |
σ (mN m−1) |
ε |
| Ar. atm. |
Amb. atm. |
Ar. atm. |
Amb. atm. |
Ar. atm. |
Amb. atm |
| DMF |
I |
II |
1.82 |
2.02 |
1.62 |
2.16 |
12.7 |
0.802 |
36.4 |
36.71 |
| Acetone |
III |
IV |
1.15 |
1.72 |
1.33 |
1.46 |
9.0 |
0.303 |
22.7 |
20.56 |
| Ethanol |
V |
VI |
2.23 |
1.16 |
2.01 |
2.2 |
12.8 |
1.083 |
21.9 |
191.3 |
| Water |
VII |
VIII |
1.37 |
1.42 |
0.32 |
0.74 |
6.2 |
0.890 |
71.8 |
78.36 |
Energy-dispersive X-ray spectroscopy (EDX) was determined by JEOL JXA-810A Electronic Prope Microanalyzer. The X-ray diffraction (XRD) patterns of the samples were performed on a Bruker AXS D8 advanced diffractometer equipped with a secondary monochromator and automatic divergence slits filtered Cu-Kα radiation (λ = 1.54056 A) at 40 kV and 40 mA. The diffraction patterns were recorded in the 2θ range from 2° to 80°using a step size of 0.02° and count time per step 0.4 s. Optical absorption spectra was measured using a UV-VIS spectrophotometer (T80+ UV/VIS Spectrometer PG instruments Ltd.) in the spectral range of 200–800 nm at room temperature. For transmission electron microscopy (TEM) studies the nanoparticles were suspended in ethanol, then treated in an ultrasonic bath (BRANSON, 1510) for about 60 min. A small drop of this suspension placed on carbon, which was coated copper grid. The specimens were examined with TEM system (JEM-1011, JEOL, Japan). The microscope was operated at an accelerating voltage of 90 kV. Infrared spectra were measured using Jasco FT/IR 6100- Fourier transform infrared spectrometer. Fluorescence spectra were measured using RF-5301 PC Shimadzu spectrophotometer at room temperature.
Results and discussion
X-ray diffraction
X-ray diffraction measurements of samples prepared in different solvents in the presence of O2-free argon atmosphere are shown in Fig. 1. CdS nanoparticles prepared in DMF (sample I), acetone (sample III) and DI-water (sample VII) can be indexed to the standard hexagonal wurtzite phase of CdS (JCPDS card no. 41-1049). The diffraction pattern of the CdS prepared in DMF and DI water revealed two other diffraction peaks with small intensities, which are related to cadmium thiourea thiocyanate (JCPDS card no. 21-1543). However, the diffraction peaks for CdS prepared in ethanol matched cubic crystal structure (JCPDS card no. 75-1546) better than hexagonal one. These results indicate that the choice of solvent has an important effect on the crystal structure of nanoparticles. An important notice delivered from these results is that CdS nanoparticles prepared with high surface tension solvents (DI-water) showed a clearly identified hexagonal crystal structure (the value of the surface tension of water is higher than that of all other used solvents as listed in Table 1). However, the nanoparticles prepared with high dipole moment solvent (ethanol) match cubic crystal structure better than hexagonal crystal structure (the dipole moment of ethanol is higher than that of all other used solvents as listed in Table 1).
 |
| | Fig. 1 X-Ray diffraction patterns for CdS nanoparticles prepared in (I) DMF, (III) acetone, (V) ethanol and (VII) DI-water under argon atmosphere. | |
XRD patterns of the CdS prepared in different solvents under ambient atmosphere are shown in Fig. 2. CdS nanoparticles prepared in DMF, acetone, and DI-water are inclined to form hexagonal crystal structure, in addition, there are three diffraction peaks, can be indexed to cadmium thiourea thiocyanate (JCPDS card no. 21-1543), which may be at the surface of the nanoparticles or as a separate phase. However, the CdS nanoparticles prepared in ethanol matched hexagonal phase better than cubic one due to the appearance of (100) and (101) planes. Compared with the former XRD observation of CdS prepared under argon atmosphere, the environmental condition has an important role on the crystal structure in high dipole moment solvent.
 |
| | Fig. 2 X-Ray diffraction patterns for CdS nanoparticles prepared in (II) DMF, (IV) acetone, (VI) ethanol and (VIII) DI-water ambient atmosphere. | |
Energy dispersive X-ray analysis
Fig. 3 and 4 show the EDX spectra of CdS nanoparticles prepared in various solvents at argon and ambient atmospheres, respectively. Clearly, the structures are composed of cadmium and sulfur in addition to small traces percentage of N, C and O. The presence of these elements indicates the coordination of thiourea and solvents to the surface of the nanoparticles. We have calculated the atomic ratios of Cd/S and O/C for the different samples (Table 1). It is worth to mention that samples prepared under ambient air atmosphere have more O/C ratio of atomic percentage than that of CdS nanoparticles prepared under argon atmosphere. For the comparison between the two polar aprotic solvents, DMF and acetone, it's found that Cd/S ratio of atomic percentage of nanoparticles prepared in DMF is larger than that of samples prepared in acetone at a given atmospheres. As shown in Table 1, the viscosity, surface tension and dipole moment of DMF are larger than that of acetone, which indicates that these physical parameters of the solvent are important factors on the growth of nanoparticles in aprotic solvents. The same trend of dependence on viscosity and dipole moment appeared for the nanoparticles prepared in protic solvents at argon atmosphere. However, the nanoparticles prepared in protic solvent under argon atmosphere shows a smaller ratio of Cd/S for the nanoparticles prepared in solvent with high surface tension. On the other hand, we found that the Cd/S ratio increases with increasing the dielectric constant of solvents for the nanoparticles prepared under argon atmosphere, reflecting that the sulfur is less soluble in high dielectric solvent.
 |
| | Fig. 3 EDX analysis for CdS nanoparticles prepared in (I) DMF, (III) acetone, (V) ethanol and (VII) DI-water under argon atmosphere. | |
 |
| | Fig. 4 EDX analysis for CdS nanoparticles prepared in (II) DMF, (IV) acetone, (VI) ethanol and (VIII) DI-water under ambient atmosphere. | |
UV-Vis absorption spectroscopy
Absorption spectra in the UV-Vis of CdS nanoparticles prepared under argon and ambient atmospheres are displayed in Fig. 5 and 6, respectively. The absorption spectra for all samples show blue shift relative to bulk CdS. The blue shift of the nanoparticles prepared in protic solvents is smaller than that of nanoparticles prepared in aprotic solvents under argon atmosphere. However, CdS nanoparticles prepared under ambient atmosphere showed a different blue shift phenomenon, which may be due to the change of crystal structure and formation of cadmium thiourea thiocyanate supported by X-ray analysis. The wavelengths of characteristic absorption at maximums and the onsets for all samples are determined from the second derivative of the absorption spectra, as shown in the inset (Fig. 5 and 6), listed in Table 2. Clearly, the type of solvent and environment condition not only produce great effect on the wavelength values of absorption maximum and onsets but also significantly influence the difference value between the absorption maximums and onsets which reflects the size distribution. To determine quantitatively the size polydispersity of the nanoparticles, we have calculated the size of nanoparticles based on the energy of absorption maximum and onset which are deviated from the energy of the bulk band gap in a strong confinement limit as follows:29
where λ is the wavelength of absorption max or absorption onset, λg is the wavelength of absorption edge of bulk CdS (512 nm), aB is the exciton Bohr radius (3.15 nm), a is the radius of nanoparticle and R*y is the Rydberg constant (28.6 meV). The calculated radiuses for nanoparticle based on the absorption onsets and absorption maximums are listed in Table 2. The polydispersities in sizes of the nanoparticles are calculated from standard deviation σa, which is defined as follows:
| σa = 2(a(λonset) − a(λM)) |
where a(λonset) and a(λM) is the radius of the nanoparticles calculated from the absorption onset and absorption maximum, respectively. Considering the a(λM) is the mean radius, then the size polydispersity index (SPI) can be calculated as following:
 |
| | Fig. 5 UV-Vis absorption for CdS nanoparticles prepared in (I) DMF, (III) acetone, (V) ethanol and (VII) DI-water under argon atmosphere. | |
 |
| | Fig. 6 UV-Vis absorption for CdS nanoparticles for CdS nanoparticles prepared in (II) DMF, (IV) acetone, (VI) ethanol and (VIII) DI-water under ambient atmosphere. | |
Table 2 Wavelengths of absorption onsets, first absorption maximums along with the calculated sizes and the size polydispersity index (SPI) from their values for CdS prepared in different solvents
| Sample |
λonset (nm) |
λM (nm) |
aonset (nm) |
aM (nm) |
SPI |
Sample |
λonset (nm) |
λM (nm) |
aonset (nm) |
aM (nm) |
SPI |
| I |
450 |
417 |
2.66 |
2.1 |
1.02 |
II |
450 |
416 |
2.36 |
2.08 |
1.01 |
| III |
460 |
416 |
2.91 |
2.08 |
1.04 |
IV |
471 |
412 |
2.65 |
2.05 |
1.02 |
| V |
504 |
454 |
6.18 |
2.73 |
1.4 |
VI |
438 |
400 |
2.16 |
1.91 |
1.004 |
| VII |
462 |
420 |
2.96 |
2.14 |
1.04 |
VIII |
460 |
421 |
2.52 |
2.15 |
1.007 |
The obtained values of SPI for the nanoparticles prepared in different solvent and different environmental conditions are listed in Table 2. For the CdS nanoparticles prepared in aprotic solvent under ambient atmosphere, both size of nanoparticles and SPI increase with decreasing of the dipole moment, viscosity and surface tension of the solvent, which is also applicable to the CdS nanoparticles prepared in aprotic solvent under argon atmosphere. The effect of physical properties of solvent on the size of nanoparticles and size distribution for the nanoparticles prepared in aprotic solvent can be explained as follows: the decrease of the dipole moment and viscosity of the reaction medium lead to an increase of colliding of the nuclei with each other during the preparation and consequently form large nanoparticles. Also, low values of viscosity and the dipole moment of the medium may increase the random collisions of the nuclei, which may produce nanoparticles with a wide size distribution. On the other hand, the SPI and average size decrease with decreasing of both dipole moment and viscosity for CdS prepared in protic solvent. This negative effect may be attributed to that the viscosity of the protic solvents is affected by the diffusion of argon gas through the medium, especially the synthetic process of the samples was finished below the boiling point of the protic solvents to keep a constant temperature.
We have studied the effect of Cd/S atomic ratio and crystal structure on the absorption of the nanoparticles. As Cd/S atomic percentage ratio increases for the nanoparticles grown under argon atmosphere, it would have hexagonal structure and the absorption onset gradually red shifted toward longer wavelength which indicate an increasing of the band gap.30 Another result found for samples prepared under argon atmosphere where the band edge of the nanoparticles prepared in ethanol, which has cubic structure is appeared at energy lower than the band edges of other nanoparticles which have hexagonal structures. This result is consistent with previous reported results which showed that the band gap energy of CdS nanoparticles increased with the phase transformation from cubic zinc blend to hexagonal wurtzite structure.31 The absorption of the nanoparticles prepared under ambient atmospheric confirmed that the change of crystal structure from cubic phase to hexagonal structure leads to shift of absorption onset to higher energy, indicated by the shift of the absorption onset of sample VI to higher energy relative to sample V. Sample VI shows a clear change to hexagonal structure relative to sample V. Regarding the effect of Cd/S atomic percentage ratio for the nanoparticles prepared under an ambient atmosphere there is no obvious trend appeared which may be due to the appearance of high percentage of oxygen in addition to increase of the percentage of cadmium thiourea thiocyanate as revealed by X-ray diffraction and EDX analysis.
Transmission electron microscopy
The samples prepared in acetone were selected to investigate the shape and the sizes of the nanoparticles by transmission electron microscopy (TEM). Fig. 7 shows the TEM images of III and IV samples which are prepared in acetone under argon and ambient atmospheres, respectively. Clearly the nanoparticles are nearly spherical shape. The average nanoparticles diameters calculated for these samples are about 6.25 and 5.55 nm for III and IV samples, respectively, which are slightly larger than the estimated sizes from the absorption onset of the UV-Vis absorption. Also the TEM results confirm that the nanoparticles prepared under ambient atmosphere is smaller than the nanoparticles prepared under argon atmosphere, which also agrees with the results obtained from absorption onset.
 |
| | Fig. 7 Typical TEM images of the as-prepared samples of CdS nanoparticles prepared in acetone under argon atmosphere (a, sample III) and in acetone under ambient air atmosphere (b, sample IV), respectively. | |
Infrared spectroscopy
Fig. 8 shows infrared spectroscopy of the nanoparticles prepared in different solvents under argon atmosphere. The main bands appeared in this range are 610 cm−1 (2LO), 659 cm−1 (C–S and CdS), 1108 cm−1 (N–H and C–O), 1399 cm−1 (C–H), 1567 cm−1 (bending vibration of C–N and CdS–COO), and 1640 (H2O bending and DMF coordination).32–35 The bands due to C–S, C–N and NH2 vibrations of CdS nanoparticles shifted to higher frequencies relative to that of free thiourea (infrared spectroscopy of thiourea is shown in Fig. 9). The two bands appeared at 1992 cm−1 and 2138 cm−1 for the nanoparticles prepared in DMF and DI-water which are not detected in free thiourea or DMF and acetone, only the band appeared at 1900 cm−1 also appeared in ethanol with a small intensity as shown in Fig. 9. These two bands are attributed to cadmium thiourea thiocyanate,35 which confirms the X-ray analysis. The band at around 2100 cm−1 disappeared for the two samples prepared in ethanol and acetone and the intensity of the band around 1900 cm−1 is highly diminished. These results reflect that the preparation in DMF and DI water under argon environment leads to the formation of cadmium thiourea thiocyanate, which may be at the surface of nanoparticles or as separate phase, according to the X-ray analysis. The CdS nanoparticles prepared in DMF and DI-water both showed the band at 1567 cm−1, however the band of 1108 cm−1 disappeared for the nanoparticles prepared in DI-water. In comparison, the band of 1567 cm−1 for the nanoparticles prepared in ethanol and acetone was not shown. These results indicate that different solvents show a varied nature of the surface capping.
 |
| | Fig. 8 Infrared spectroscopy for CdS nanoparticles prepared in (I) DMF, (III) acetone, (V) ethanol and (VII) DI-water under argon atmosphere. | |
 |
| | Fig. 9 Infrared spectroscopy of thiourea, DMF, acetone and ethanol. | |
Fig. 10 shows infrared spectroscopy of the nanoparticles prepared in different solvents under ambient atmosphere. The most important difference relative to the nanoparticles prepared under argon atmosphere is the increase in relative intensity of the peak around 2100 cm−1 for the nanoparticles prepared in DMF and DI-water. These results are consistent with the obtained results from X-ray analysis.
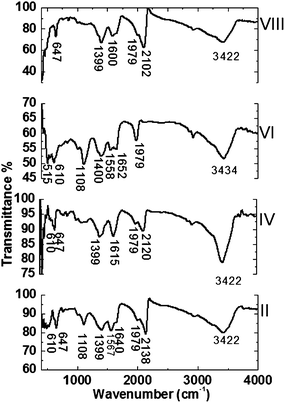 |
| | Fig. 10 Infrared spectroscopy for CdS nanoparticles for CdS nanoparticles prepared in (II) DMF, (IV) acetone, (VI) ethanol and (VIII) DI-water under ambient atmosphere. | |
Fluorescence spectroscopy
The emissions from the nanoparticles prepared in different solvents under argon atmosphere excited at 410 nm are shown in Fig. 11. Nanoparticles prepared in acetone and water showed emission bands which shifted severely relative to their absorption spectra, indicating that the emission bands are due to trapping states.36,37 For nanoparticles prepared in ethanol, a yellow band at 514 nm showed a little shift, which is a characteristic of bulk CdS. However, the emission of CdS nanoparticles prepared in DMF revealed a blue emission band at 468 nm with a small full width at half maximum along with a shoulder nearly at 490 nm. We attributed this improvement in the emission for the nanoparticles prepared in DMF to the increase of the Cd/S ratio as detected from EDX analysis. It is well known that DMF can coordinate to cadmium cations at the surface of nanocrystals.38,39 The increase of Cd ions enhances the reaction between the Cd cations at the surface with DMF molecule, resulting in the growth of the nanoparticles with less trapping states at the surface. Additional factors for the improvement of the emission of the nanoparticles growing in DMF may be due to the formation of cadmium thiourea thiocyanate as confirmed by X-ray results and infrared spectroscopy. Cadmium thiourea thiocyanate may bind to sulfur anions at the surface of nanoparticles and consequently results in removal of trapping states. It is worth mentioning that cadmium thiourea thiocyanate is formed for the nanoparticles prepared with water, which shows an emission mostly due trapping states. This contradiction may ascribe to the preparation in water which might lead to the formation of hydrogen bonds with some of sulfur anions at the surface. This result is confirmed by the decrease of relative intensity of cadmium thiourea thiocyanate peaks for the nanoparticles prepared in water in comparison with the same peaks observed in the case of preparation of nanoparticles in DMF.
 |
| | Fig. 11 Fluorescence spectroscopy for CdS nanoparticles prepared in (I) DMF, (III) acetone, (V) ethanol and (VII) DI-water under argon atmosphere. | |
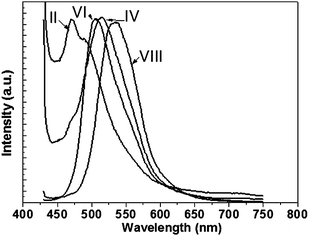
Fig. 12 shows the luminescence of CdS nanoparticles prepared in different solvents under ambient atmosphere. The emission from CdS nanoparticles prepared in ethanol shifted by about 10 nm to higher energy relative to the emission of CdS nanoparticles prepared under argon atmosphere whereas the emission of CdS nanoparticles prepared in DI water was not affected. This result confirms the increase of the band gap for the nanoparticles with hexagonal structure relative to that with cubic structure. However, the emission of CdS nanoparticles prepared in acetone revealed two emission bands at 471 and 515 nm. The appearance of the high energy emission band for nanoparticles prepared in acetone in comparison with that for sample prepared under argon atmosphere is attributed to the increase of the Cd/S ratio. The emission from nanoparticles prepared in DMF revealed two emissions bands at 471 and 490 nm which showed a little shift to lower energy in comparison with sample I.
 |
| | Fig. 12 Fluorescence spectroscopy for CdS nanoparticles prepared in (II) DMF, (IV) acetone, (VI) ethanol and (VIII) DI-water under ambient atmosphere. | |
Regarding the effect of physical properties for solvent on the emission of CdS, we found that the dipole moment of the solvent has a relation with the shift of the emission in comparison with absorption which we call Stokes shift as shown in Fig. 13. Clearly, with increasing of the dipole moment of solvent, the Stokes shift decreases for samples prepared under argon atmosphere. For the samples prepared under ambient atmosphere the same trend appeared, but the nanoparticles prepared in ethanol (VI) showed a negative result and the stocks shift is highly increased. This sample revealed a high value of SPI which may be one of the factors affecting the emission.
 |
| | Fig. 13 Stokes shift against dipole moment for CdS nanoparticles prepared under argon and ambient atmospheres. | |
Conclusions
We have prepared CdS nanoparticles by chemical precipitation method without stabilizing agent using different aprotic and protic solvents under O2− free argon and ambient atmospheres. The prepared nanoparticles were characterized by energy dispersive X-ray diffraction, infrared, absorption and luminescence spectroscopies. In this work, the CdS nanoparticles prepared in aprotic solvent (DMF) under argon and ambient atmospheres showed a notable improvement in optical emission, while an optical emission with a little stokes shift observed for CdS nanoparticles prepared in protic solvent under argon atmosphere. This work is strong proof that the structure and optical properties of CdS nanoparticles are very sensitive to the synthetic conditions, such as solvent and environment. These nanoparticles are promising for various optoelectronic applications.
Acknowledgements
Part of this work is of M.Sc. thesis of second author M. Maize.
References
- Z. X. Wang, L. M. Wu, M. Chen and S. X. Zhou, J. Am. Chem. Soc., 2009, 131, 11276 CrossRef CAS PubMed.
- H. T. Han, X. Wu, G. Z. Shen, B. Dierre, L. H. Gong, F. Y. Qu, Y. Bando, T. Sekiguchi, F. Filippo and D. Golberg, J. Phys. Chem. C, 2010, 114, 8235 Search PubMed.
- H. J. Zhang, X. Wu, F. Y. Qu and G. G. Zhao, CrystEngComm, 2011, 13, 6114 RSC.
- Y. Lei, F. Y. Qu and X. Wu, Nano-Micro Lett., 2012, 4, 45 CAS.
- L. Peng, L. F. Hu and X. S. Fang, Adv. Mater., 2013, 25, 5321 CrossRef CAS PubMed.
- M. Chen, L. M. Wu, S. X. Zhou and B. You, Adv. Mater., 2006, 18, 801 CrossRef CAS.
- M. Chen, L. F. Hu, J. X. Xu, L. M. Wu and X. S. Fang, Small, 2011, 7, 2449 CAS.
- X. S. Fang, L. F. Hu, K. F. Huo, B. Gao, L. J. Zhao, M. Y. Liao, P. K. Chu, Y. Bando and D. Golberg, Adv. Funct. Mater., 2011, 21, 3907 CrossRef CAS.
- S. Coe, W. K. Woo, M. Bawendi and V. Bulovic, Nature, 2002, 420, 800 CrossRef CAS PubMed.
- C. H. Ye, G. W. Meng, Y. H. Wang, Z. Jiang and L. D. Zhang, J. Phys. Chem. B, 2002, 106, 10338 CrossRef CAS.
- Z. L. Zhang, J. Wang, Z. Yu, F. Y. Qu and X. Wu, Nano-Micro Lett., 2012, 4, 215 CAS.
- A. S. Bhadwal, R. M. Tripathi, R. K. Gupta, N. Kumar, R. P. Singh and A. Shrivastav, RSC Adv., 2014, 4, 9484 RSC.
- L. F. Hu, M. M. Brewster, X. J. Xu, C. C. Tang, S. Gradecak and X. S. Fang, Nano Lett., 2013, 13, 1941 CrossRef CAS PubMed.
- A. E. Morra, S. Wageh and A. A. El-Azm, Opt. Quant. Electron., 2011, 42, 285 CrossRef.
- U. K. Gautam, X. S. Fang, Y. Bando, J. H. Zhan and D. Golberg, ACS Nano, 2008, 2, 1015 CrossRef CAS PubMed.
- G. Q. Xu, B. Liu, S. J. Xu, C. H. Chew, S. J. Chua and L. M. Gana, J. Phys. Chem. Solids, 2000, 61, 829 CrossRef CAS.
- S. Wageh, A. A. Higazy and A. S. Hassouna, J. Mater. Sci.: Mater. Electron., 2013, 24, 3049 CrossRef CAS PubMed.
- J. H. Li and J. Z. Zhang, Coord. Chem. Rev., 2009, 253, 3015 CrossRef CAS PubMed.
- P. Chawla, G. Sharma, S. P. Lochab and N. Singh, Bull. Mater. Sci., 2010, 33, 535 CrossRef CAS PubMed.
- J. F. A. Oliveira, T. M. Milão, V. D. Araujo, M. L. Moreira, E. Longo and M. I. Bernardi, J. Alloys Compd., 2011, 509, 6880 CrossRef CAS PubMed.
- T. Y. Zhai, X. S. Fang, L. Li, Y. Bando and D. Golberg, Nanoscale, 2010, 2, 168 RSC.
- Q. Q. Shen, J. B. Xue, J. Liu, H. S. Jia, X. Q. Liu and B. S. Xu, CrystEngComm, 2013, 15, 1007 RSC.
- K. M. Deng and L. Li, Adv. Mater., 2014 DOI:10.1002/adma.201304621.
- S. C. Han, L. F. Hu, N. Gao, A. A. Al-Ghamdi and X. S. Fang, Adv. Funct. Mater., 2014 DOI:10.1002/adfm.201400012.
- F. Shayeganfar, Z. Eskandari, M. R. R. Tabar and M. Sahimi, Mol. Simul., 2014, 40, 361 CrossRef CAS.
- J. A. Riddick, W. B. Bunger and T. K. Sakano, Organic solvents, Wiley- Interscience, New York, 4th edn, 1986 Search PubMed.
- R. C. Weast and M. J. Astle, CRC Hand book of data on organic compounds, CRC Press, Boca Raton/FL, USA, 1985, vol. I–II Search PubMed.
- D. R. Lide, Hand book of chemistry and physics, CRC press, Boca Raton/FL, USA, 82nd edn, 2001 Search PubMed.
- S. V. Gaponenko, Optical properties of semiconductors, Cambridge University Press, Cambridge, 1998 Search PubMed.
- Q. Q. Shen, J. B. Xue, A. Mi, H. S. Jia, X. G. Liu and B. S. Xu, RSC Adv., 2013, 3, 20930 RSC.
- G. A. Tai, J. X. Zhou and W. L. Guo, Nanotechnology, 2010, 21, 175601 CrossRef PubMed.
- S. Adachi, Handbook on physical properties of semiconductors, Kluwer Acadmic publishers, New York, 2004 Search PubMed.
- S. Wageh, Physica E, 2007, 39, 8 CrossRef CAS PubMed.
- R. M. Silverstein and G. C. Bassler, Spectrometric identification of organic compound, Wiley, New York, 1976 Search PubMed.
- K. Nakamoto, Infrared and Raman spectra of inorganic and coordination compounds, John Wiley & Sons, New York, 1986 Search PubMed.
- S. Wageh, Z. S. Ling and X. R. Xu, J. Cryst. Growth, 2003, 255, 332 CrossRef CAS.
- S. Wageh and M. H. Badr, Physica E, 2008, 40, 2810 CrossRef CAS PubMed.
- Y. Wada, H. Kuramoto, J. Anand, T. Kitamura, T. Sakata, H. Mori and S. Yanagida, J. Mater. Chem., 2001, 11, 1936 RSC.
- H. Hosokawa, H. Fujiwa, K. Muraoshi, Y. Wada, S. Yanagida and M. Satoh, J. Phys. Chem., 1996, 100, 6649 CrossRef CAS.
|
| This journal is © The Royal Society of Chemistry 2014 |
Click here to see how this site uses Cookies. View our privacy policy here. 


