Donor atom selective coordination of Fe3+ and Cr3+ trigger fluorophore specific emission in a rhodamine–naphthalimide dyad†
Narendra Reddy Chereddy*ab,
Krishnan Saranraja,
Ayan Kumar Baruic,
Chitta Ranjan Patra*c,
Vaidya Jayathirtha Rao*b and
Sathiah Thennarasu*a
aOrganic Chemistry Division, CSIR-Central Leather Research Institute, Adyar, Chennai-600 020, India. E-mail: chereddynarendra@gmail.com; thennarasu@gmail.com; crpatra@iict.res.in
bCrop Protection Chemicals, CSIR-Indian Institute of Chemical Technology, Tarnaka, Hyderabad-500 007, India
cBiomaterials Group, CSIR-Indian Institute of Chemical Technology, Tarnaka, Hyderabad-500 007, India
First published on 27th May 2014
Abstract
A rhodamine–naphthalimide dyad with multiple coordination sites displays Fe3+ and Cr3+ specific absorption and fluorescence emission profiles and permits specific detection of Fe3+ and Cr3+ ions present in aqueous samples, and live A549 and CHO cells in a chemoselective manner.
Iron and chromium are among the indispensable transition metal ions found in both humans and animals.1–3 While Fe3+ acts as an oxygen carrier in hemoglobin, and plays an important role in cellular metabolism and enzyme catalysis,1 Cr3+ plays a critical role in several metabolic processes.2 Accordingly, the deficiency as well as overload of Fe3+ has resulted in various biological disorders.3 Similarly, deficiency of Cr3+ has lead to diabetes and cardiovascular diseases while excess of Cr3+ is carcinogenic and adversely affects cellular structures.2 Consequently, several luminescent probes based on fluorescence ‘turn-off’ strategy have been developed for selective quantitative detection of Fe3+ or Cr3+ ions.4,5 Recently, much effort has been devoted to develop fluorescence ‘turn-on’ probes for the selective detection of Fe3+ or Cr3+ ions,6,7 overcoming the paramagnetic quenching nature of these ions. However, multianalyte sensing using single molecular probe is highly desirable as the environmental and biological samples usually contain a variety of ions. The multianalyte probes reported for the detection of both Fe3+ and Cr3+ ions, suffer from the cross sensitivity to Al3+ ions.8 Moreover, these probes have a single binding site for both Fe3+ and Cr3+ ions, and display metal ion specific fluorescence emission in the same wavelength range. This drawback limits the application of these multianalyte probes in the real-time detection of Fe3+ and Cr3+ ions in biological samples. However, specific detection of Fe3+ and Cr3+ ions in living systems requires a multianalyte probe capable of displaying fluorescence response at different wavelengths. Although there are reports on multianalyte probes, varying conditions are applied to detect different analytes. To our knowledge, there is no report on a single molecular probe that emits fluorescence at two different wavelengths upon interaction with Fe3+ and Cr3+ ions, respectively. Consequently, development of new probes that can potentially sense both Fe3+ and Cr3+ ions in aqueous and biological systems with different fluorescence outputs, preferably with ‘turn-on’ emission is imperative for proper diagnosis and sensor applications.
In the present communication, we report a rhodamine–naphthalimide dyad 1 that senses Fe3+ and Cr3+ ions and emits fluorescence at two different wavelengths. Non-interference of common metal ions, including Al3+, found in biological samples is confirmed. A possible application of this single molecular probe for sensing Fe3+ and Cr3+ ions in cancerous A549 and non-cancerous CHO cells is demonstrated.
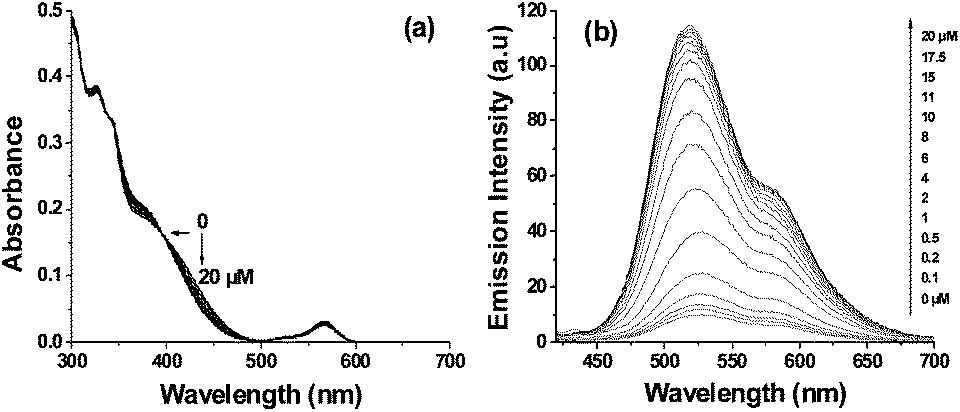
A new rhodamine–naphthalimide dyad 1 with multiple coordination sites for metal ion binding was synthesized as shown in Scheme 1 and thoroughly characterized using NMR and ESI-HRMS analytical techniques (Fig. S1–S3, ESI†). The dyad probe 1 encompasses six potential donor atoms for metal ion chelation. Metal ion sensing properties of 1 were assessed using UV-visible and fluorescence techniques in aqueous acetonitrile (1![[thin space (1/6-em)]](https://www.rsc.org/images/entities/char_2009.gif) :1 v/v 0.01 M Tris HCl–CH3CN, pH 7.4) medium. The absorption spectrum of 1 (10 μM) in aqueous acetonitrile, comprised an absorption band centred at ∼410 nm (ε = 16900 M−1 cm−1), corresponding to the naphthalimide moiety (Fig. 1a). Among various metal ions (20 μM), addition of only Fe3+ and Cr3+ ions induced considerable changes in the absorbance pattern of 1. Upon addition of Fe3+ ions, the absorption intensity of 1 at ∼564 nm was enhanced by 10-fold (ε = 24000 M−1 cm−1). Whereas, the absorption band centred at ∼410 nm was slightly blue shifted by the addition of Cr3+ ions. The Fe3+ induced changes in the absorption pattern of 1 is attributed to Fe3+-induced rhodamine spirolactam ring opening resulting in the formation of 1–Fe3+ complex. The Cr3+-invoked blue shift in the naphthalimide absorption at ∼410 nm suggested the formation of 1–Cr3+ complex and indicated the involvement of the piperazine ‘N’ attached to the naphthalimide moiety of 1 in complex formation. The invariability in the absorption of rhodamine moiety at ∼564 nm to the addition of Cr3+ denoted the non-involvement of rhodamine moiety in 1–Cr3+ complex formation (Fig. 1a).
:1 v/v 0.01 M Tris HCl–CH3CN, pH 7.4) medium. The absorption spectrum of 1 (10 μM) in aqueous acetonitrile, comprised an absorption band centred at ∼410 nm (ε = 16900 M−1 cm−1), corresponding to the naphthalimide moiety (Fig. 1a). Among various metal ions (20 μM), addition of only Fe3+ and Cr3+ ions induced considerable changes in the absorbance pattern of 1. Upon addition of Fe3+ ions, the absorption intensity of 1 at ∼564 nm was enhanced by 10-fold (ε = 24000 M−1 cm−1). Whereas, the absorption band centred at ∼410 nm was slightly blue shifted by the addition of Cr3+ ions. The Fe3+ induced changes in the absorption pattern of 1 is attributed to Fe3+-induced rhodamine spirolactam ring opening resulting in the formation of 1–Fe3+ complex. The Cr3+-invoked blue shift in the naphthalimide absorption at ∼410 nm suggested the formation of 1–Cr3+ complex and indicated the involvement of the piperazine ‘N’ attached to the naphthalimide moiety of 1 in complex formation. The invariability in the absorption of rhodamine moiety at ∼564 nm to the addition of Cr3+ denoted the non-involvement of rhodamine moiety in 1–Cr3+ complex formation (Fig. 1a).
 | ||
| Scheme 1 Synthesis of rhodamine–naphthalimide dyad 1. | ||
 | ||
| Fig. 1 Metal ion (20 μM) induced variations in the (a) absorbance, and (b) fluorescence spectra of 1 (10 μM). Excitation wavelength: 400 nm. | ||
The dyad probe 1 (10 μM) in aqueous acetonitrile was non-fluorescent owing to the spirocyclic form of rhodamine moiety (Φ = 0.019) and PET induced quenching of fluorescence emission from the naphthalimide moiety (Φ = 0.03) by pyridine ‘N’.9 While the fluorescence pattern of 1 was unaffected by the addition of various metal ions (20 μM), addition of Fe3+ and Cr3+ ions induced distinct changes in the fluorescence profile of 1 as seen in Fig. 1b. Clearly, addition of Fe3+ to 1 enhanced the fluorescence intensity in both naphthalimide (Φ = 0.36) and rhodamine (Φ = 0.40) regions due to the formation of 1–Fe3+ complex. The observed enhancement in fluorescence intensities is attributed to the quenching of PET from pyridine ‘N’ to naphthalimide moiety (∼517 nm) and Fe3+ induced spirolactam ring opening (∼583 nm), which perceptibly indicated the involvement of the pyridine ‘N’ and rhodamine carbonyl ‘O’ of 1 in the proposed 1–Fe3+ complex.
Interestingly, the addition of Cr3+ (20 μM) to 1 enhanced the fluorescence emission only in naphthalimide region (Φ = 0.33) and not in the rhodamine region (Fig. 1b). This patently different fluorescence pattern revealed the involvement of the pyridine ‘N’ and but not the carbonyl ‘O’ of rhodamine moiety in 1–Cr3+ complex formation. Thus, the data presented in Fig. 1 show the apparent difference in the choice of donor atoms selected by the trivalent ions Fe3+ and Cr3+ during complex formation with the dyad probe 1. It is imperative to note that Al3+, a possible interfering trivalent ion, did not induce any significant changes in the absorption and fluorescence profiles of 1.
The difference in the binding environments of Cr3+ and Fe3+ was further confirmed by NMR analysis. The resonance positions of only the piperazine protons and ‘CH2’ protons attached to piperazine ‘N’ were shifted significantly upon addition of serial concentrations of Cr3+ (Fig. S4, ESI†). The observed downfield shift could arise from the possible interactions between Cr3+ and the ‘N’ atoms of piperazine and pyridyl moieties in 1–Cr3+ complex. This proposition was confirmed from the 13C spectrum of 1–Cr3+ complex (Fig. S5, ESI†). Addition of Cr3+ resulted in a reduction in intensities of 13C resonances at ∼52.4, ∼64.3 (corresponding to ‘CH2’ units attached to piperazine ‘N’ atoms) and ∼155.5 ppm (attributable to the quaternary carbon of pyridine ring linked to piperazine ‘N’ via CH2 moiety). It is imperative to note that none of the carbonyl moieties is sensitive to Cr3+ ions. The impassive nature of rhodamine carbonyl ‘C’ at ∼165.1 ppm and spirolactam ‘C’ at ∼66.4 ppm to the addition of Cr3+ confirmed the non-involvement of rhodamine moiety in 1–Cr3+ complex (Fig. S5, ESI†). On the other hand, a general broadening the 1H NMR signals of the probe, was observed when Fe3+ was added to 1 owing to the strong paramagnetic affect of Fe3+. Similarly, an overall reduction in the intensities of the carbon signals in the 13C NMR spectrum of 1 was observed with the addition of Fe3+. However, the decrement in 13C intensities was much pronounced in the cases of 13C resonances arising from rhodamine carbonyl, spirolactam, piperazine, quinoline and pyridine moieties (Fig. S6, ESI†). This observation corroborated the Fe3+ specific UV-visible and fluorescence profiles of 1, and confirmed the involvement of rhodamine, quinoline and pyridine moieties in 1–Fe3+ complex formation (Fig. 1).
The dyad probe 1 (10 μM) was titrated against serial concentrations of Fe3+ and Cr3+ ions. Successive addition of serial concentrations of Fe3+ (0–20 μM) increased the absorption of rhodamine moiety at ∼564 nm, progressively and the maximum absorption was observed with 20 μM of Fe3+ (Fig. 2a). A similar titration with Fe3+ ions gradually increased the fluorescence emission from both naphthalimide and rhodamine moieties (Fig. 2b). The stoichiometry and binding constant of 1–Fe3+ complex ware calculated using fluorescence data (Fig. S7, ESI†) and results indicated the 1:1 stoichiometry of the 1–Fe3+ complex with binding constant of 2.2 × 10⁵ M−1.10 The observed lower detection limit of 1 for Fe3+ ions was 1 × 10⁻⁸ M (0.6 ppb). Addition of serial concentrations of Cr3+ (0–20 μM) to 1 (10 μM) gradually shifted the absorption band at ∼410 nm corresponding to naphthalimide moiety towards shorter wavelengths as shown in Fig. 3a. Under identical conditions the fluorescence emission of 1 increased gradually only from the naphthalimide moiety as shown in Fig. 3b. The increment in the fluorescence intensity was linear (R2 = 0.993) in the range from 1 × 10⁻⁷ to 1 × 10⁻⁵ M and indicated the 1:1 stoichiometry of 1–Cr3+ complex with binding constant as 8.1 × 10⁴ M−1 (Fig. S8, ESI†). The lower detection limit of 1 in the case of Cr3+ was calculated to be 2 × 10⁻⁷ M (10.8 ppb). The detection limits observed for Fe3+/Cr3+ using probe 1 are lower than those reported recently for Fe3+/Cr3+ using other chemosensors (Table S1, ESI†). Moreover, probe 1 is the first of its kind that is useful for detecting and differentiating Fe3+ and Cr3+ ions.
 | ||
| Fig. 2 The Fe3+ (0–20 μM) concentration dependent variations in the absorbance (a) and fluorescence (b) spectra of 1 (10 μM). Excitation wavelength: 400 nm. | ||
 | ||
| Fig. 3 The Cr3+ (0–20 μM) concentration dependent variations in the absorbance (a) and fluorescence (b) spectra of 1 (10 μM). Excitation wavelength: 400 nm. | ||
Selective detection of Fe3+ and Cr3+ ions by 1 in the presence of other commonly existing metal ions was studied to assess non-interference of other metal ions. Results from the metal ion competition experiments (Fig. S9, ESI†), confirmed the Fe3+ and Cr3+ detection ability of 1 even in the presence of other commonly coexisting metal ions using the signature absorption and fluoresce profiles generated (Fig. 1–3) upon interaction with Fe3+ or Cr3+. As the intracellular concentrations of Fe3+ and Cr3+ are at micromolar levels, the detection of Fe3+/Cr3+ at ppb levels in the present study demonstrated the probe's eligibility for the detection of intracellular Fe3+/Cr3+ ions.11 Stability at physiological pH and low cytotoxicity are the key criteria for living cell imaging, the effect of pH on the fluorescence emission pattern of 1 was evaluated. Results illustrated the stability of 1 in the range of pH 6–10 (Fig. S10, ESI†) and revealed its suitability to operate at physiological pH. Moreover, the results of MTT assay (Fig. S11, ESI†) showed that after 48 h of cellular internalization of 1 (20 μM), both cancerous (A549) and endothelial (ECV-304) cells remained viable (more than 95%), indicated the biocompatibility of 1 to cells under experimental conditions.
We next explored the utility of 1 in sensing the presence of Fe3+ and Cr3+ ions in biological systems. The cancerous A549 and non-cancerous CHO cells were used for in vitro experiments (Fig. 4a and S13, ESI†). The untreated A549 cells (a1–a4) and cells treated with 1 (20 μM) alone (b1–b4) were non-fluorescent. However, the A549 cells pre-incubated with 1 (20 μM) triggered bright red (c2) and green fluorescence (c3) upon treatment with Fe3+ (50 μM) ions. Under similar conditions, A549 cells pre-treated with 1 (20 μM) exhibited bright green (d3) but not red (d2) fluorescence upon incubating with Cr3+ (50 μM) ions. In all groups, nuclear staining was done with Hoechst 33258 dye (a4, b4, c4 and d4). Additionally, A549 cells treated with only Fe3+ (50 μM) or Cr3+ (50 μM) did not show any fluorescence (Fig. S15, ESI†). The overlaid fluorescence microscopic images provided in Fig. 4b indicate, clearly, the potential of probe 1 to get into the cytoplasmic compartments as well as the nucleus of A549 cells. Similar bio-imaging properties were observed even for non-cancerous CHO cells (Fig. S13 and S17, ESI†). Thus, the data shown in Fig. 4 and S12–S18, ESI,† clearly demonstrated the Fe3+ and Cr3+ ion specific detection ability of dyad probe 1 in live cells.
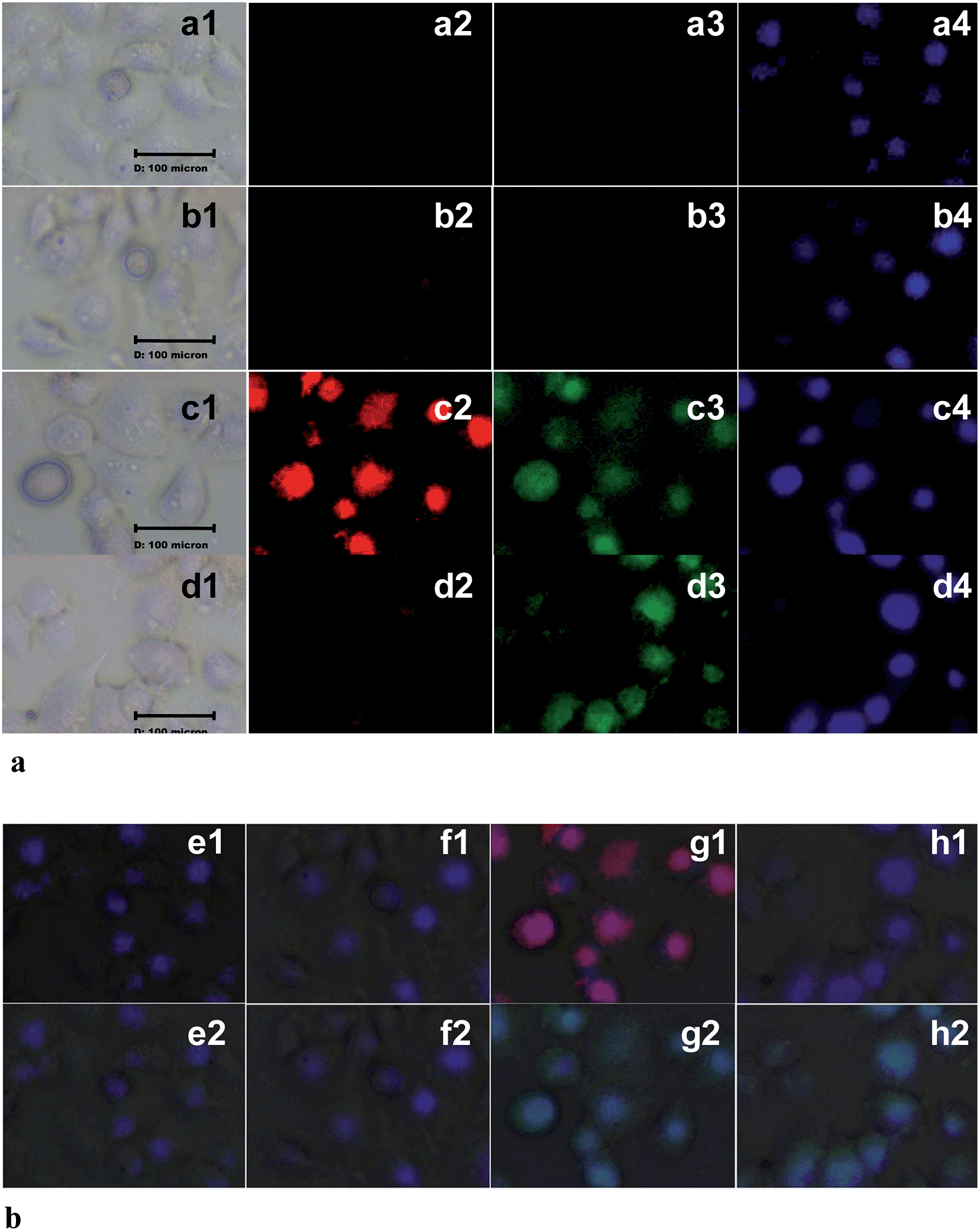 | ||
| Fig. 4 (a) Fluorescence microscopic images of A549 cells: row 1 (a1–a3): untreated A549 cells, row 2 (b1–b3): A549 cells treated with 1 (20 μM) alone; row 3 (c1–c3): cells treated with 1 (20 μM) and Fe3+ (50 μM); row 4 (d1–d3): cells treated with 1 (20 μM) and Cr3+ (50 μM). Column 1 (a1–d1), bright field images; column 2 (a2–d2), fluorescence images obtained using red filter; column 3 (a3–d3), fluorescence images obtained using green filter; and column 4 (a4–d4), fluorescence images of Hoechst 33258 dye stained A549 cells. (b). Overlaid fluorescence microscopic images of A549 cells: (e1) overlaid images of a1, a2 and a4; (f1) overlaid images of b1, b2 and b4; (g1) overlaid images of c1, c2 and c4; (h1) overlaid images of d1, d2 and d4; (e2) overlaid images of a1, a3 and a4; (f2) overlaid images of b1, b3 and b4; (g2) overlaid images of c1, c3 and c4; (h2) overlaid images of d1, d3 and d4 of (a). | ||
In conclusion, we have reported a rhodamine–naphthalimide dyad probe 1 for the selective detection of Fe3+ or Cr3+ ions present in aqueous and biological systems. The multiple metal coordination sites available in the single molecular probe 1 offer distinct chelation environments for Fe3+ and Cr3+ ions, and thereby emit metal ion specific fluorescence at two different wavelengths. The presence of other competitive metal ions, including Al3+, does not affect the sensing ability of 1. Probe 1 is the first of its kind, and can be used for sensing intracellular Fe3+ and Cr3+ ions in a single assay.
Acknowledgements
N. R. Ch. thanks the CSIR, India, for CSIR-Nehru Science Postdoctoral Fellowship. AKB thanks UGC, India, for a Senior Research Fellowship. CRP thanks to DST, India for ‘Ramanujan Fellowship Grant’ (SR/S2/RJN-04/2010; GAP0305). Financial support from CSIR 12th plan projects CSC0201 and CSC0302 is acknowledged. Financial support from ‘INTELCOAT’ project is also acknowledged.Notes and references
- (a) P. Aisen, M. Wessling-Resnick and E. A. Leibold, Curr. Opin. Chem. Biol., 1999, 3, 200 CrossRef CAS; (b) R. S. Eisenstein, Annu. Rev. Nutr., 2000, 20, 627 CrossRef CAS PubMed; (c) T. A. Rouault, Nat. Chem. Biol., 2006, 2, 406 CrossRef CAS PubMed.
- (a) A. K. Singh, V. K. Gupta and B. Gupta, Anal. Chim. Acta, 2007, 585, 171 CrossRef CAS PubMed; (b) J. B. Vincent, Proc. Nutr. Soc., 2004, 63, 41 CrossRef CAS PubMed; (c) R. A. Anderson, Regul. Toxicol. Pharmacol., 1997, 26, S35 CrossRef CAS PubMed; (d) W. Mertz, J. Nutr., 1993, 123, 626 CAS.
- (a) C. Brugnara, Clin. Chem., 2003, 49, 1573 CrossRef CAS; (b) N. C. N. Andrews, N. Engl. J. Med., 1999, 341, 1986 CrossRef CAS PubMed.
- (a) S. Fakih, M. Podinovskaia, X. Kong, H. L. Collins, U. E. Schaible and R. C. Hider, J. Med. Chem., 2008, 51, 4539 CrossRef CAS PubMed; (b) X. Wu, B. Xu, H. Tong and L. Wang, Macromolecules, 2010, 43, 8917 CrossRef CAS; (c) S. Smanmoo, W. Nasomphan and P. Tangboriboonrat, Inorg. Chem. Commun., 2011, 14, 351 CrossRef CAS PubMed; (d) N. Bian, Q. Chen, X.-L. Qiu, A.-D. Qi and B.-H. Han, New J. Chem., 2011, 35, 1667 RSC.
- (a) H. M. Wu, P. Zhou, J. Wang, L. Zhao and C. Y. Duan, New J. Chem., 2009, 33, 653 RSC; (b) M. Sarkar, S. Banthia and A. Samanta, Tetrahedron Lett., 2006, 47, 7575 CrossRef CAS PubMed; (c) S. Guha, S. Lohar, A. Banerjee, I. Hauli and D. Das, Talanta, 2012, 91, 18 CrossRef CAS PubMed.
- (a) B. Wang, J. Hai, Z. Liu, Q. Wang, Z. Yang and S. Sun, Angew. Chem., Int. Ed., 2010, 49, 4576 CrossRef CAS PubMed; (b) J. D. Chartres, M. Busby, M. J. Riley, J. J. Davis and P. V. Bernhardt, Inorg. Chem., 2011, 50, 9178 CrossRef CAS PubMed; (c) N. R. Chereddy, S. Thennarasu and A. B. Mandal, Dalton Trans., 2012, 41, 11753 RSC; (d) N. R. Chereddy, S. Thennarasu and A. B. Mandal, Analyst, 2013, 138, 1334 RSC; (e) N. R. Chereddy, K. Suman, P. S. Korrapati, S. Thennarasu and A. B. Mandal, Dyes Pigm., 2012, 95, 606 CrossRef CAS PubMed; (f) A. J. Weerasinghe, C. Schmiesing, S. Varaganti, G. Ramakrishna and E. Sinn, J. Phys. Chem. B, 2010, 114, 9413 CrossRef CAS PubMed.
- P. Mahato, S. Saha, E. Suresh, R. D. Liddo, P. P. Parnigotto, M. T. Conconi, M. K. Kesharwani, B. Ganguly and A. Das, Inorg. Chem., 2012, 51, 1769 CrossRef CAS PubMed; K. W. Huang, H. Yang, Z. G. Zhou, M. X. Yu, F. Y. Li, X. Gao, T. Yi and C. H. Huang, Org. Lett., 2008, 10, 2557 CrossRef PubMed; Z. G. Zhou, M. X. Yu, H. Yang, K. W. Huang, F. Y. Li, T. Yi and C. H. Huang, Chem. Commun., 2008, 29, 3387 RSC.
- (a) A. Barba-Bon, A. M. Costero, S. Gil, M. Parra, J. Soto, R. Martınez-Manez and F. Sancenon, Chem. Commun., 2012, 48, 3000 RSC; (b) X. Chen, X. Y. Shen, E. Guan, Y. Liu, A. Qin, J. Z. Sun and B. Z. Tang, Chem. Commun., 2013, 49, 1503 RSC; (c) S. Goswami, K. Aich, S. Das, A. K. Das, D. Sarkar, S. Panja, T. K. Mondal and S. Mukhopadhyay, Chem. Commun., 2013, 49, 10739 RSC; (d) J. Mao, L. Wang, W. Dou, X. Tang, Y. Yan and W. Liu, Org. Lett., 2007, 9, 4567 CrossRef CAS PubMed.
- L. Xu, Y. Xu, W. Zhu, C. Yang, L. Han and X. Qian, Dalton Trans., 2012, 41, 7212 RSC.
- J. Hatai, S. Pal, G. P. Jose, T. Sengupta and S. Bandyopadhyay, RSC Adv., 2012, 2, 7033 RSC.
- (a) E. Mills, X.-P. Dong, F. Wang and H. Xu, Future Med. Chem., 2010, 2, 51 CrossRef CAS; (b) A. Pechova and L. Pavlata, Vet. Med., 2007, 52, 1 CAS.
Footnote |
| † Electronic supplementary information (ESI) available: Experimental procedures, NMR, ESI-MS spectra, metal ion competitive experiments, effect of pH, cell viability assay and live cell imaging experiments. See DOI: 10.1039/c4ra02797c |
| This journal is © The Royal Society of Chemistry 2014 |