Tracking carbon dioxide adsorbate intramolecular dynamics in pure silica zeolite Silicalite-1 by in situ Raman scattering
Dimitar V.
Tzankov
 and
Peter A.
Georgiev
 *
*
Faculty of Physics, University of Sofia, James Bourchier 5, 1164 Sofia, Bulgaria. E-mail: pageorgiev@phys.uni-sofia.bg
First published on 19th December 2023
Abstract
We report a series of high-quality Raman spectra of carbon dioxide (CO2) adsorbed at room temperature and at various equilibrium pressures, sampling the corresponding adsorption isotherm up to 12 bar. The observed splitting in Fermi diad resonance lines, which were additionally split into two well-resolved components, arising from at least two different CO2 species, were compared to the same quantity in high-pressure gas/solid/liquid CO2 phases. Our studies provide material specific spectral data that could be useful in the detection, identification, and dynamical characterization of CO2 deposits, inclusions, or other forms in remote locations and of various origins, e.g. geological, planetary, stellar, and deap-sea sediments.
Introduction
Carbon dioxide (CO2) is one of the most stable and long-lived molecular species and is existentially important for life on Earth. Its atmospheric concentration is directly responsible for the temperature balance near the planet surface by reflecting back the irradiated infra-red emission, i.e. heat, thus preventing freezing, while excess amounts can lead to undesirable temperature rises. It is also the main source of the vital for life oxygen via green plants photosynthesis processes as well as mammals’ internal respiration processes and blood pH level maintenance. However, biological decrepitation processes, including green biomass, also emit significant amounts of CO2. While these emissions may stimulate green plants to grow, which would convert excess CO2 into oxygen, human activities related to CO2 release, mainly industrial, as well as geological sources, like persistent volcanic activity, can severely break this fragile equilibrium and are contributing to the globally felt climate change.1–3 Sectors such as power/energy production, transportation, and industry have been identified as the main contributors to the global anthropogenic CO2 release into the atmosphere.2 Making the situation even more complicated, it has been recently found4 that CO2 might be much more stable and long living species in Earth's atmosphere than previously thought thus leading to severe irreversible effects on the climate.Along with that, most recent dramatic weather circumstances, like severe floods and fires, make it clear that apart from the urgent measures needed to drastically cut emissions, human civilisation desperately needs to globally arrange environment-friendly and efficient processes for pulling CO2 from Earth's atmosphere. Consequently, various methods for CO2 extraction and storage have been considered,5,6 including (i) geological and ocean injection,7,8 (ii) injection into deep sea sediments9 and depleted oil fields,10,11 and (iii) physical adsorption into microporous adsorbents.12–15 Needless to say, all must be supplemented by efficient, possibly non-destructive remote methods for monitoring and dynamical physicochemical analyses. However, CO2 is abundant in space and interstellar ices and gases comprising up to 30% mol,16–18 usually identified by IR signals, and is considered a possible source for fresh oxygen for breathing and for rocket fuel in future space missions. Indeed, near future Mars missions would need to rely on CO2 gas, ice deposits, as well possibly other specific forms as the source of oxygen and henceforth CO2 electrolysis-based systems for clean oxygen production are already been devised.19 Clearly, technologies for oxygen extraction, purification, and atmosphere monitoring and control will be necessary, along with CO2 resources identification and characterisation. Raman spectroscopies are considered a valuable in situ remote diagnostic tool for the detection and characterisation of the state of the corresponding CO2 molecular species.20,21 Notably, a devoted Raman scattering spectrometer was designed for the 2018 ExoMars mission.22 While first proof of the long-anticipated presence of zeolitic materials has been presented23 the Raman spectra of water and CO2 in natural zeolite chabazite have so far been measured under laboratory-simulated Martial conditions, by a Lidar-based Raman spectrometer specially developed for space missions,24 further illustrating the need for reliable high-quality reference spectra of the adsorption characteristics of various materials species of interest.
As a linear trinuclear species, CO2 has four vibrational modes: a doubly degenerate bending mode (ν2) predicted by theory at about 665–670 cm−1 (IR active, Raman inactive), a symmetric stretch, ν3, in the range 1300–1360 cm−1 (ν1, Raman active, IR inactive), and an antisymmetric stretch at 2300–2370 cm−1 (Raman inactive IR active).25 IR ro-vibrational spectroscopic data-derived forcefield26 places the bending mode at 667.4 cm−1, the symmetric stretch at 2349.2 cm−1, and predicts the IR inactive but Raman-active Fermi diad at 1285.4 and 1388.2 cm−1, with the latter being a classical example of a Fermi resonance, where the second order bending mode 2*ν2 nearly coincides with the ν1 mode. The resultant anharmonic wavefunctions, separated in energy by the anharmonic coupling constant, correspond to the Raman active Fermi diad with the lower, ν−, and higher, ν+, bands. In the gas phase, the resulting lines are observed at about 1285 and 1388 cm−1.27 Furthermore, the intramolecular CO2 dynamics has been studied in the gas, liquid, and solid states, in broad temperature and pressure ranges.26–30 It has been observed that the diad splitting is particularly sensitive to intermolecular interactions. Consequently, useful polynomial interpolations have been derived from extended pressure and temperatures ranges, relating this splitting to the CO2 density in the gas, liquid, and solid phases, below and above the critical temperature.28–34 Based on these data, accurate contactless remote CO2 pressure31–39 sensing in pure and inclusion phases as well as temperature and salinity sensing methods have been devised.34 However, despite the urgent need for new CO2-storage technologies and materials, and the clear usefulness of Raman spectroscopy, experimental Raman studies on micropore-confined CO2 phases/adsorbates are rather scarce. Only a limited number of metal–organic frameworks (MOFs) out of this vast family of microporous materials with the potential for CO2 capture and storage have been tested by in situ Raman spectroscopy.40–46 Among those tested, intriguing results include the Zn(BDC)(DMBPY)0.5 MOF (BDC = 1,4-benzenedicarboxylic acid; and DMBPY = 2,2′-dimethyl-4,4′-bipyridine), with a strong affinity towards CO2 and a corresponding high isosteric heat of adsorption of the order of 45 kJ mol−1 CO2.40 Only a weak feature due to the adsorbed CO2 was observed at 1379 cm−1, while the observed 9 cm−1 downshift with respect to the gas-phase value was interpreted as being due to the strong interactions between the adsorbate and the host structure.40 In Zn2(bdc)2(bpee) MOF, where bpdc = 4,4′-biphenyl dicarboxylate and bpee = 1,2-bis(4-pyridyl)ethylene, the computed binding energy of CO2 in the pore interiors is much lower, 34 kJ mol−1, suggesting weaker host–guest interactions, yet the same feature, somewhat contraintuitively, was seen at an even lower energy of 1377 cm−1.41 When CO2 was adsorbed near the coordinatively unsaturated Mg(II) centres of MOF-74-Mg (CPO-27-Mg), with an isosteric heat of adsorption in the range 45–50 kJ mol−1 CO2, the symmetric stretch was again found alone at 1382 cm−1,42 notably at the same frequency as for the Ni-analogue of the same material,36 and only 6 cm−1 red-shifted from the gas-phase value. These observations indicate that the symmetric stretch mode of the molecule alone is rather insensitive to small variations in the local intermolecular interactions or may suggest that there are inconsistencies in the measurements in different laboratories and experimental setups. Furthermore, in the fluorofunctionalized MOF Zn(SiF6)(pyz)2, with a heat of CO2 adsorption of about 47 kJ mol−1, both states of the Fermi diad were observed at 1276 and 1380 cm−1, seemingly broadened.43 Then in the zeolitic imidazolate MOF ZIF-8, in which the molecule is adsorbed relatively weakly, presumably in the large cavity, with heats of adsorption in the range 15–19 kJ mol−1,44 the CO2 diad lines appeared as a broad complex feature in the range of 1270–1276 cm−1, with an upper band at 1379 cm−1.45 In the larger-storage-capacity ZIF-69 representative of the ZIF family, yet again the two sides of the Fermi diad were observed at 1280 and 1380 cm−1, with a significant broadening of 12 and 6 cm−1 accordingly. These are again related to the relatively weak host–guest interactions, e.g. 17–23 kJ mol−1.46,47 While the relative insensitivity of the symmetric stretch mode to the host–CO2 interactions seem plausible, bearing in mind the high strength of the CO bonds in the molecule, the large broadening and in some cases complete lack of the lower energy Fermi band, corresponding to the bending of the adsorbed molecule, is intriguing and has not been discussed yet. Notably, the rich vibrational spectra and hence rather strong host scattering of the aforementioned MOF materials may preclude clear observations of the mode, but another possibility could be a coupling of the CO2 molecular bending mode to nearby lattice phonons, which would lead to an intensity reduction and frequency shifts, in some cases even decoupling the bending and stretch modes, thus destroying the resonance completely. Indeed, in materials where the host structure vibrational features are limited to energies well below the Fermi diad, like for instance silica polymorphs, e.g. zeolites, silica clathrates, and particularly in the naturally occurring porous mineral melanophlogite, also classified as a “clathrasyl”, the two bands of the naturally encaged CO2 are clearly resolved at 1283 and 1385 cm−1, including the hot bands at 1263 and 1406 cm−1.48 All the host structure originating modes in this material have been observed well below 1000 cm−1, though other small encaged molecules like N2, CH4, are always present too.48,49 The latter Raman study, performed on a melanophlogite sample from different natural locations, confirmed the presence of cage occupancy by CO2 by detecting the corresponding Fermi diads at 1277 and 1378 cm−1 again clearly resolved,49 however with a significant broadening. Unfortunately, no data regarding the CO2 binding energy in this material has been published yet and no relation between the peaks position and the host–guest interactions can be inferred.
The present study is one of a series, including a number of diverse microporous materials, and is focused on the Fermi diad dynamics of CO2 adsorbed in the pure silica MFI prototypic zeolite Silicalite-1. This material has very high structural stability, storage capacity, and heat of adsorption for CO2 comparable to those in the aforementioned MOFs. Additionally, it is a general pure-silica representative of the very wide-use aluminium-containing zeolites, including various extra framework charge balancing ions, namely ZSM-5. The three-dimensional microporous MFI structure can be described as made of straight, 0.56 nm wide, channels along the b basis vector of the unit cell, which cross similarly sized, e.g. 0.53 nm, sinusoidal(zig-zag) channels running along the c basis vector, forming relatively small, about 0.64 nm, cavities at the intersections. The corresponding structure files are freely available at the International Zeolite Association (IZA) web site. The channel openings are viewed through 10-membered rings(–SiO4–, altogether 12 non-equivalent in the structure) with walls comprising 4-, 5-, and 6-membered rings that build up a rather smooth potential interior for diffusion of the guest molecules that can only feel weak electrostatic and dispersive interactions with the pure silica host.
Experimental
The sample, Silicalite-1, was synthesized following previously published standard recipes50 from CAB-O-Sil M-5 and NH4F 98% as the silica and fluoride sources and TPABr, 98% as the template, all obtained from Fisher Scientific. The MFI crystallographic phase and the phase purity were checked by measuring the powder X-ray diffraction patterns in air, at room temperature, using an URD-6 diffractometer, equipped with a copper radiation source and a graphite monochromator on the detector side. Raman spectra at different equilibrium pressures and room temperature (299 K) were collected using a micro-Raman HORIBA Jobin Yvon Labram HR 800 spectrometer with He–Ne (633 nm wavelength, 5 mW) laser excitation. Some spectra were measured using an external argon laser, 400 μW power, providing an incident beam with a photon energy of 514 nm. A 20× objective was used to focus the beam on the exposed surface of the micron-sized zeolite crystals and the scattered beam was analyzed on a 600 l mm−1 diffraction grating. The 520 cm−1 line of silicon was used for the spectrometer calibration on the energy scale. A Linkam pressure stage type THMS600PS, with a temperature controller T96, was used for the in situ gas adsorption Raman experiments. The gas dosing was done by only controlling the equilibrium gas pressure. The sample for these experiments was in the form of a 10 mm diameter pressed tablet of the pure Silicalite-1 material. Prior to the measurements, the cell with the loaded tablet was evacuated by using a turbomolecular pump, first at room temperature for about 16 h, then for an additional 6 h, and at up to 393 K. A control CO2 adsorption isotherm at 299 K was measured on a sample from the same synthesis batch, at 0.7 g dry weight, obtained after calcination at up to 973 K to remove all of the organic template. A custom-built Sieverts-type gas handling rig, equipped with two pressure sensors by Druck, at 2 bar and 20 bar, with sensitivities of 0.04% of the full range, was used for the sorption isotherm measurements. Because the critical temperature of CO2 is 304 K, subcritical vapour deviation from ideal gas law was expected to be significant, and so we used the NIST thermochemistry web book for calculating the corresponding compressibility at 299 K and up to 20 bar pressure to calculate the real amount of CO2 adsorbed in the material.51 CO2 gas of purity 99.995% from Messer was used for all the gas experiments.Results
The Raman spectrum of the evacuated Silicalite-1 material is shown in Fig. 1a. As previously observed and assigned, in the range up to 600 cm−1, the spectrum was dominated by the Si–O–Si bending modes, with the most intense feature at about 383 cm−1 due to those in the 5-membered rings (5MR).52 Larger rings features appeared at lower frequencies, e.g. those of the 6MR at about 360 cm−1, seen as a low energy shoulder of the 383 cm−1 line, being next to the 294 cm−1 line due to the 10MR.53 The Si–O–Si and O–Si–O stretching modes appeared as a band in the range 800–832 cm−1.52,53 While the spectrum in Fig. 1a already confirms the expected microstructure of the material, in Fig. 1b we further provide the powder X-ray diffraction pattern of our sample, along with the theoretically calculated one for the MFI structure in the space group Pnma (#62).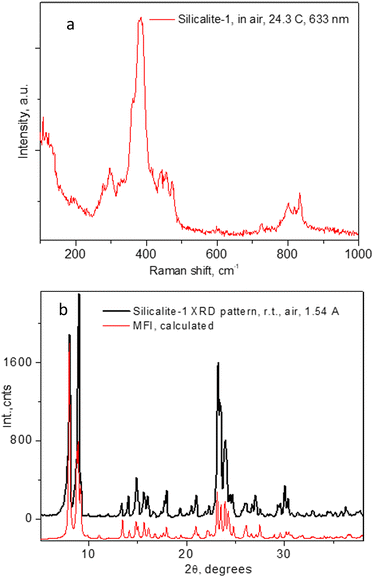 | ||
| Fig. 1 Raman spectra of the Silicalite-1 material used throughout the present study in (a) and the corresponding PXRD pattern in (b). | ||
The Raman spectra of adsorbed CO2 in the Silicalite-1 sample, at each pressure step, are shown in Fig. 2a and b, clearly displaying the expected Fermi diad. At the lowest CO2 pressure in the present study, 0.2 bar, as shown in Fig. 2a, the corresponding diad lines could be observed at 1280.5 ± 0.3 cm−1 and 1383.1 ± 0.1 cm−1, about 5 cm−1 below the gas phase values, bearing in mind the ∼1 cm−1 experimental resolution of the spectrometer, which is to be added on top of the quoted least-squares fitting errors. The corresponding line integral intensities we denote as I1− and I1+, accordingly. Higher energy shoulders could be seen at the next pressure step, 0.4 bar, which clearly developed into a well-resolved new pair of lines in the 0.6 bar spectrum, at 1285.8 ± 0.3 cm−1 and 1388.5 ± 0.2 cm−1, whose integral intensities we further label as I2− and I2+. The appearance of this new pair of lines, possibly originating from the surrounding gas-phase molecules or CO2 molecules at a second adsorption site in the pore interiors, did not influence the position of the first Fermi diad, as verified by the least-squares fitting, remaining at energies of 1280.3 ± 0.1 cm−1 and 1383.1 ± 0.04 cm−1.
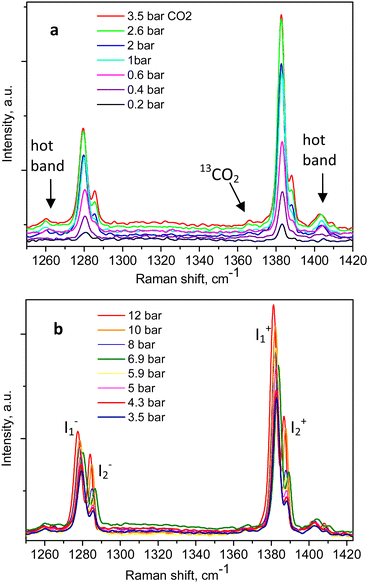 | ||
| Fig. 2 Raman spectra of CO2-loaded Silicalite-1 taken at 299 K and variable pressures: (a) between 0.2 and 3.5 bar; (b) up to 12 bar, as indicated in the figure legends. | ||
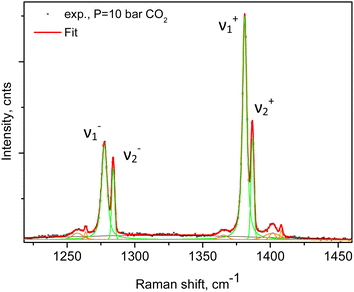
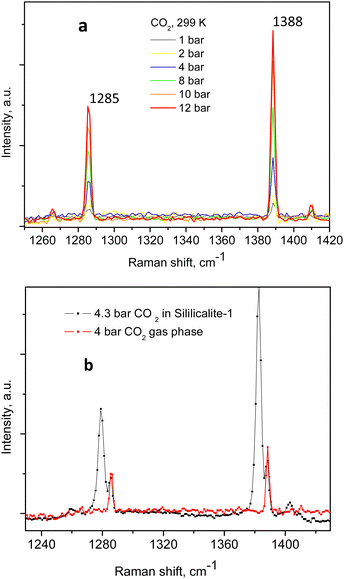
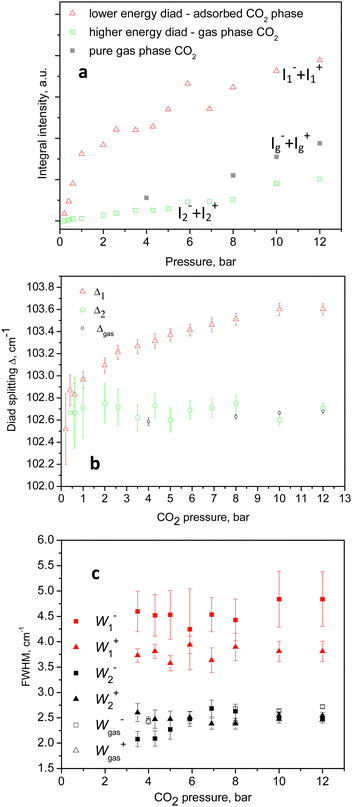
An example of the peak decomposition for the data collected at 10 bar CO2 pressure is shown in Fig. 3, where each pair of lines has its pair counterpart seen in the hot corresponding bands too. Pseudo-Voigt profiles were used for better data peak matching. Significant downshifts of the adsorbate lines were seen in the 4.3 bar data: 1279.2 ± 0.06 cm−1 and 1382.5 ± 0.03 cm−1, and 1285.5 ± 0.08 cm−1 and 1388.2 ± 0.07 cm−1. This latter dynamical trend of a downshift of the lines continued rather monotonically with the increase in carbon dioxide loading as evidenced by the spectral evolution up to the maximum of 12 bar equilibrium pressure, as shown in Fig. 2a and b, at which final pressure the two diads were positioned at 1277.5 ± 0.05 cm−1 and 1381.1 ± 0.03 cm−1, and at 1284.1 ± 0.04 cm−1 and 1386.8 ± 0.03 cm−1, showing a clear increase in the higher energy diad intensity relative to the lower energy counterpart. A small peak, seen near 1365–1370 cm−1, Fig. 2a and b, was attributed to 13CO2 seen at 1370 cm−1 in the fluid and solid pure CO2 phases.54 In an attempt to better identify the origin of the higher energy narrower pair of lines in the observed spectra, CO2 gas-phase Raman spectra, excluding the sample contribution, were recorded by covering the sample by 10 μm thick commercial aluminium foil and recording the spectra at a series of pressures up to 12 bar, at 299 K. These data are shown in Fig. 4a. In Fig. 4b the pure CO2 gas, 4 bar, spectrum is overlaid on the spectrum corresponding to the adsorbed in Silicalite-1 CO2 at 4.3 bar pressure. The pure gas vibrational features coincided within less than 1 cm−1 tolerance to the higher energy pair of peaks of the CO2-loaded Silicalite-1 spectrum, Fig. 4b, and displayed a very similar shape. The detailed dynamical behaviours of the two Fermi diads, derived from the fitting all the spectral data, including the same parameters of the pure gas phase, are shown in Fig. 5 and 6. Consequently, we show the corresponding band intensities in Fig. 5a and the diad splittings ΔI, i = 1,2, for the first and second (higher pressure and energies) appearing diads in Fig. 5b along with those of the pure gas-phase measurements.
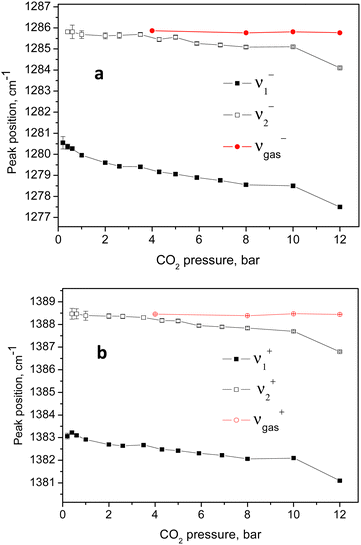 | ||
| Fig. 6 Variation of the positions of the higher and lower energy parts of the two Fermi diads with the CO2 equilibrium pressure. | ||
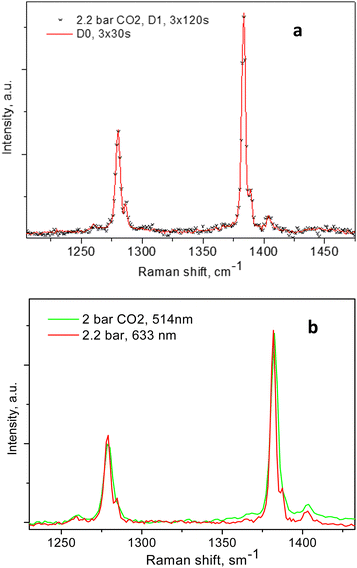
The individual peak positions upon CO2 loading are shown in Fig. 6a and b. The corresponding spectral lines widths, in terms of the full width at half maximum (FWHM) are shown in Fig. 5c. To the best of our knowledge, this complex nature of the CO2 diad has not been reported before. To rule out LASER beam overheating effects, which could cause some of the CO2 molecules to leave their adsorption sites and scatter from the gas phase, we measured some of the data using 10 times lower incident powers as well as a different excitation energy, e.g. 514 nm. A perfect match between the spectra recorded using the 10 times different incident LASER powers can be seen in Fig. 7a, while a comparison of the similar data recorded using the two excitation wavelengths in Fig. 7b shows that the higher incoming photon energy resulted in a somewhat lower resolution and correspondingly asymmetrically broadened lines in the observed spectrum, however well-matching the data measured with the 633 nm incident wavelength. These tests indicate that the LASER beam did not destroy the original adsorbate structure and the observed scattering was mainly due to CO2 adsorbed in the adsorption sites within the open framework structure of Silicalite-1.
It is worth noting that the zeolite crystals themselves did not absorb significantly to become overheated while the incident photons, on the other hand, did not carry a high enough momentum sufficient to kick the adsorbed molecules out of their adsorptive potential wells – therefore, kinetic recoil effects were not to be expected at all. Finally, to relate the in situ loading pressures to the actual amount of CO2 adsorbate within the interiors of the Silicalite-1 material, we also present an adsorption isotherm, measured at the same experimental temperature in Fig. 8.
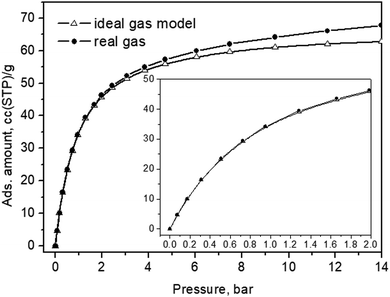 | ||
| Fig. 8 CO2 adsorption isotherm of the Silicalite-1 sample measured at 299 K. The same data, up to a pressure of 2 bar, are shown in the inset. | ||
Discussion
The complex behaviour of the observed Fermi diad bands of CO2 adsorbed in Silicalite-1 can be rationalized in terms of two groups of adsorption sites: (i) one set more closely lying to the internal surfaces of the material, and (ii) a second set of sites formed by larger voids and other neighbouring CO2 molecules. The lower energy diad, appearing at the lowest loading pressures, we assigned to molecules adsorbed in the stronger (preferential) binding sites, i.e. those in which the adsorbate directly interacts with the internal surfaces of the material. As the equilibrium CO2 pressure was raised and the overall loading was increased, the higher energy sites, i.e. group (ii) became occupied. The adsorption energies of the two groups of sites were clearly similar, causing the weaker set to become significantly populated at relatively low total loadings, e.g. 1/3 of the total capacity, and to become contentiously filled with the increase of pressure, with the weaker site reaching about 1/5 of the total scattering at the highest pressures, with some signs of saturation, as shown in Fig. 4a. Using Raman spectroscopy, a similar CO2 heterogeneous site or rather multilayer adsorption has previously been studied in the mesoporous glass Vycor.55 Broad complex signals, due to the molecular fluid phase at the interior surfaces, were observed at the applied pressures between 8.8 and 51 bar, while a better-defined peak, with a shoulder at the low energy side, was observed near the critical pressure at about 58 bar. Only the higher energy branch, i.e. the ν+(1388 sm−1), was monitored and from the peak shapes the authors concluded that the signals originated from single and multiple layer adsorbate structures.56 More specifically, the adsorption of CO2 in the same system, Silicalite-1, was microscopically studied by in situ single-crystal X-ray diffraction.52 Four adsorption sites were localized: two similar binding strength sites in the straight channel, then one adsorption site in the sinusoidal channel, and a weaker site at the intersection of the straight and the sinusoidal channels, at room temperature and 0.8 bar equilibrium pressure.57 Recently, a synchrotron powder diffraction study reinvestigated the same system in a broader CO2 pressure range up to 21 bar,58 basically confirming the earlier observation. A maximum of 16 CO2 molecules per unit cell were determined, distributed over the same four adsorption sites, confirming the preferential character of the straight channel sites and the weakest site at the channels cross-section. High-pressure in situ synchrotron XRD experiments59 up to 13.2 GPa also led to the observation of four adsorption sites, setting the maximum CO2 capacity of Silicalite-1 to 16 molecules per unit cell. Our spectroscopic results agree with the above structural picture, with the main Fermi diad at the lower energies assigned to the preferential adsorption sites lying near the wall of the channels, and the higher energy pair, appearing at slightly higher pressures, originating from molecules adsorbed in the larger voids formed at the channel intersections, surrounded by other CO2 molecules at the sides of the channel openings.This scenario agrees particularly well with the conclusions drawn from the analyses of the CO2 adsorption isotherm in conjunction with the in situ diffraction results53 stating that at the weaker adsorption sites, in the sinusoidal channels and intersections, the adsorbate–adsorbate interactions become significant, changing the nature of adsorption from Langmuirian to Toth-like. According to our peak fitting analyses, about one-fifth to one-quarter of the adsorbate molecules were located in the weaker binding sites, at 12 bar and 299 K, Fig. 5a, presumably at the sinusoidal channels/intersections.
For these presumably weak interactions with the zeolite surfaces molecules, we observed a nearly constant Fermi diad splitting, Δ2, in Fig. 5b, with an average value of 102.7 cm−1 levelling out already at 1 bar, Fig. 5b, and typical for the gas phase;32,33 however, indicating a compression level higher than the external equilibrium pressure. According to the experimental data in ref. 34, a diad splitting of 102.7 cm−1 corresponds to a gas pressure of 10 bar at 293 K. Earlier estimates, however, point to 31 bar31 and even higher32,33 still being typical for the gas/vapour phase at subcritical temperatures. The lower energy diad splitting levels out near 10 bar external pressure, at a value of about 103.7 cm−1, which in the pure CO2 Raman density measurements corresponds to 57 bar pressure and supercritical mass densities between 0.57 and 0.65 g per cc.32–34 A bit lower density, e.g. 0.5 g per cc, was predicted by a more recent extended range (5 to 600 bar) study39 unifying large sets of previously published data. It is worth noting that this occurred at the subcritical temperatures of our experiments, 299 K. Turning to the total adsorption isotherm data presented in Fig. 8, one finds that the region at 10–12 bar pressures corresponded to about a 65 cc(STP) per g adsorbed amount of CO2, which is in very good agreement with the microscopic X-ray diffraction results58,59 as well as earlier CO2 sorption (volumetric) measurements60 that also determined the corresponding isosteric heat of CO2 adsorption, Qst, to be about 30 kJ mol−1 at low loadings, and slightly dropping at higher adsorbate concentrations.
For the Silicalite-1 porosity, e.g. 30%, and an X-ray mass density of 1.934 g per cc,58 our result of 65 cc per g corresponded to an apparent adsorbed CO2 density in the silicalite void space of just above 0.8 g per cc, approaching the liquid-phase density, under the effective long-range attractive intermolecular forces, notably enhanced by the zeolite framework. Considering again the isotherm data in Fig. 8, upon comparing with the Raman integral intensities in Fig. 5, it can be inferred that at 0.4–0.6 bar absolute CO2 pressure, the total CO2 adsorbed amount was about 20 cc(STP) per g, of which only about 5% was located in the weaker adsorption sites, i.e. the sinusoidal channels.61 According to this earlier structural study,61 the adsorption site in the sinusoidal channels becomes significantly occupied at 16 cc(STP) per g. We reached a similar loading level at 0.3 bar absolute CO2 pressure and saw the appearance of the second site contribution in the next spectrum at 0.4 bar, Fig. 2a. Only at low pressures, e.g. 0.2 bar, did we see just a single diad feature in our spectrum, Fig. 2a, again agreeing well with the observed single site occupancy at 6 cc(STP) per g loading observed in the single-crystal XRD study61 transposed to approximately 10 cc(STP) per g in our isotherm data at 0.2 bar, see the inset of Fig. 8.
One may note, however, that at these low pressures, pure gas-phase scattering would also be negligible (the spectra taken at 1 bar were very weak and noisy) and one thus had the chance to observe the pure Silicalite-1 bound CO2 scattering. That is in line with a second possible interpretation of our data in which, considering our supplementary Raman spectral data from the pure gas-phase scattering from the atmosphere around the sample, Fig. 4 and 5a–c, may on the other hand suggest that the higher energy pair of lines in our CO2/Silicalite-1 data, Fig. 2 and 3, originated from the surrounding gas-phase CO2. Moreover, their shape, positions, and intensity increased with the external pressure, as depicted in Fig. 5a–c and 6a and b, and were all quite similar and followed the same trend as for the lines of the pure gas-phase CO2. In this second scenario, only the lower energy and more broadened pair of lines could be assigned to adsorbed CO2 molecules, which underwent continuous compression as witnessed by the continuous downward peak shift, increasing the diad splitting, as well as significant line broadening, following the compression in the corresponding equilibrium gas phase. This continuous adsorbate compression presumably has a two-fold effect: (i) a closer adsorbate–adsorbate distance and hence stronger intermolecular interaction, and (ii) compression of the adsorbate molecules closer to the host framework structure, also leading to a stronger influence on the molecular vibrational modes, however, not resolving the signals from molecules adsorbed in the straight channels from those residing in the sinusoidal channels. Finally, we must note that the observed Fermi diad dynamics of CO2 confined in the micropores of the siliceous zeolite Silicalite-1, representing a qualitatively expected behaviour and being subject to very similar strength adsorption potentials, was considerably different to that observed so far in all studied MOF systems.40–46 As a major difference, one could notice the more complex character of the lower energy band (ν−) in MOFs, with a lowered intensity to complete disappearance. This makes a point regarding the interpretation of the Raman lines of CO2 adsorbed in these materials – a Fermi resonance or as an adsorption site perturbed, independent from each other, by the internal molecular motions. The magnitude of the red-shift in the observed symmetric stretch, i.e. the ν+ line, on the other hand, in our case was about 5 ÷ 5.5 cm−1, with respect to the 1388 cm associated with a heat of adsorption in the range of 30 to 25 kJ mol−1 CO2 from the lowest to higher loadings.60 This compared to a very similar downshift of 6 cm−1 only under the conditions of nearly twice a stronger heat of 45–50 kJ mol−1 in MOF-74-Mg (CPO-27-Mg),42 for instance, making it hard to take the ν+ line shift on its own, as a direct microscopic measure of the adsorbate–adsorbent interactions.
Conclusions
In summary, the intramolecular CO2 dynamics in confinement, within nanosized pure silica cavities, e.g. in Silicalite-1, differs significantly from that in pure CO2 compressed phases, as well as from adsorbed phases in other inorganic minerals and metal–organic frameworks. Most importantly, in the near perfect optically and vibrationally transparent zeolite environment, we could clearly observe the expected Fermi diad, originating from two different phases, manifesting themselves by two well-resolved pairs of Fermi resonances. At the highest adsorbate loadings, the symmetric stretch ν+ was downshifted by about 5 cm−1 as compared to the gas-phase value of 1388 cm−1, while the accompanying resonant line, ν−, was lowered by about 6 cm−1. Both counterparts in this Fermi diad appeared with broadened spectral lines, e.g. 4–4.5 cm−1, compared to 2–2.5 cm−1 in the gas phase, as measured by us. This presumably adsorbed and micropore-confined phase was continuously responding to the equilibrium CO2 pressure, and corresponded to a more strongly bound adsorbed phase, showing a Fermi doublet splitting characteristic for CO2 at the critical density. Second, a compressed gaseous-like phase was observed whose density seemingly exceeded that of the external gas phase even at the lowest observed pressures, but remained rather insensitive to the loading and the external pressure along the whole accessed pressure range, except for the linearly increased intensity. In contrast, the density of the first phase continuously increased, possibly driven by the increase in the amount of the second phase along with the equilibrium gas phase. While we are tempted to interpret our findings for the dynamics of adsorbed CO2 in Silicalite-1 as arising from two different CO2 adsorption environments, our detailed spectral data did not allow us to unequivocally distinguish this well-resolved second phase from the sample surrounding the CO2 gas phase, resembling very similar, although not identical, dynamical behaviours. Upon comparing our results to the earlier available intramolecular dynamics data, it became clear too that neither the absolute vibrational feature position, nor the Fermi resonance splitting could be simply and directly related to the strength of the host–guest interactions, as represented by the corresponding isosteric heats of adsorption. The above-described findings, however, add essential information about the intramolecular dynamics of micropore-confined CO2 species to serve as a reference for future simulation/computational work as well as the remote diagnostics of CO2 deposits in minerals.Conflicts of interest
There are no conflicts to declare.Acknowledgements
This article is based upon work from COST Action CA18212 – Molecular Dynamics in the GAS phase (MD-GAS), supported by COST (European Cooperation in Science and Technology) and BNSF co-finance grant KP-06-COST/5. The authors also thank Prof. M. Abrashev for the access to the Raman instrument and related technical help.Notes and references
- State of the Global Climate 2022 (WMO-No. 1316), SBN 978-92-63-11308-5.
- Z. Liu, Z. Deng, S. Davis and P. Ciais, Nat. Rev. Earth Environ., 2023, 4, 205–206 CrossRef PubMed.
- M. Kabir, U. E. Habiba, W. Khan, A. Shah, S. Rahim, P. R. De los Rios-Escalante and Z.-U.-R. Farooqi, et al. , Science, 2023, 35, 102693 Search PubMed.
- S. Solomon, G.-K. Plattner, R. Knutti and P. Friedlingstein, Proc. Natl. Acad. Sci. U. S. A., 2009, 106, 1704–1709 CrossRef CAS PubMed.
- S. Anderson and R. Newell, Annu. Rev. Environ. Resour., 2004, 29, 102–142 CrossRef.
- Q. Wang, J. Luo, Z. Zhong and A. Borgna, Energy Environ. Sci., 2011, 4, 42–55 RSC.
- M. Ali, N. K. Jha, N. L. Pal, A. Keshavarz, H. Hoteit and M. Sarmadivaleh, Earth-Sci. Rev., 2022, 225, 103895 CrossRef CAS.
- H. Drange, G. Alendal and O. M. Johanness, Res. Lett., 2001, 28, 2637–2640 CrossRef CAS.
- K. Z. House, D. P. Schrag, C. F. Harvey and K. S. Lackner, Proc. Natl. Acad. Sci. U. S. A., 2006, 103, 12291–12295 CrossRef CAS PubMed.
- M. Godec, V. Kuuskraa, T. V. Leeuwen, L. S. Melzer and N. Wildgust, Energy Procedia, 2011, 4, 2162–2169 CrossRef.
- Q. Sun, W. Ampomah, E. J. Kutsienyo, M. Appold, B. Adu-Gyamfi, Z. Dai and M. R. Soltanian, Fuel, 2020, 278, 118356 CrossRef CAS.
- D. Fu and M. E. Davis, Cell Rep. Phys. Sci., 2023, 4, 101389 CrossRef CAS.
- D. Fu and M. E. Davis, Chem. Soc. Rev., 2022, 51, 9340–9370 RSC.
- K. Sumida, D. L. Rogow, J. A. Mason, T. M. McDonald, E. D. Bloch, Z. R. Herm, T.-H. Bae and J. R. Long, Chem. Rev., 2012, 112, 724–781 CrossRef CAS PubMed.
- M. Ding, R. W. Flaig, L. Jiang and O. M. Yaghi, Chem. Soc. Rev., 2019, 48, 2783–2828 RSC.
- P. A. Gerakines, D. C. B. Whittet, P. Ehrenfreud, A. C. A. Boogert and A. G. G. M. Tielens, et al. , Astrophys. J., 1999, 522, 357–377 CrossRef CAS.
- E. L. Gibb, D. C. B. Whittet, A. C. A. Boogert and A. G. G. M. Tielens, Astrophys. J., 2004, 151, 35–73 CAS.
- A. M. Cook, D. C. B. Whittet, S. S. Shenoy, P. A. Gerakines, D. W. White and J. E. Chiar, Astrophys. J., 2011, 730, 124 CrossRef.
- M. Hecht, J. Hoffman, D. Rapp, J. McClean, J. Soo-Hoo, R. Schaefer and A. Aboobaker, et al. , Space Sci. Rev., 2021, 217, 9 CrossRef.
- C. J. Bennett, S. J. Brotton, B. M. Jones, A. K. Misra, S. K. Sharma and R. I. Kaiser, Anal. Chem., 2013, 85, 5659–5665 CrossRef CAS PubMed.
- F. Zagury, arXiv, 2021, preprint, arXiv:2108.10530 DOI:10.48550/arXiv.2108.10530 [astro-ph.GA].
- F. Rull, S. Maurice, E. Diaz and the RLS Team, EPSC Abstr., 2012, 7, 740 Search PubMed.
- S. W. Ruff, Icarus, 2004, 168, 131–143 CrossRef CAS.
- G. Nikolakakos and J. A. Whiteway, Icarus, 2018, 308, 221–229 CrossRef CAS.
- V. Rodriguez-Garcia, S. Hirata, K. Yagi, K. Hirao, T. Taketsugu, I. Schweigert and M. Tasumi, J. Chem. Phys., 2007, 126, 124303 CrossRef PubMed.
- A. Chedin, J. Mol. Spectrosc., 1979, 76, 430–491 CrossRef CAS.
- H. R. Gordon and T. K. McCubbin, J. Mol. Spectrosc., 1966, 19, 137–154 CrossRef CAS.
- A. Anderson and T. S. Sun, Chem. Phys. Lett., 1971, 8, 537–542 CrossRef CAS.
- Y. Garrabos, R. Tufeu, B. Neindre, G. Zalczer and D. Beysens, J. Chem. Phys., 1980, 72, 4637–4651 CrossRef CAS.
- J. F. Bertran, Spectrochim. Acta, Part A, 1982, 39, 119–121 CrossRef.
- Y. Song, I. M. Chou, W. Hu, R. Burruss and W. Lu, Acta Geol. Sin., 2009, 83, 932–938 CrossRef CAS.
- Y. Kawakami, J. Yamamoto and H. Kagi, Appl. Spectrosc., 2003, 57, 1333–1339 CrossRef CAS PubMed.
- J. Yamamoto and H. Kagi, Chem. Lett., 2006, 35, 610–611 CrossRef CAS.
- A. Fall, B. Tattitch and R. J. Bodnar, Geochim. Cosmochim. Acta, 2011, 75, 951–964 CrossRef CAS.
- V.-H. Le, M.-C. Caumon, A. Tarantola, A. Randi, P. Robert and J. Mullis, Anal. Chem., 2019, 91, 14359–14367 CrossRef CAS PubMed.
- V.-H. Le, A. Tarantola and M.-C. Caumon, Phys. Chem. Chem. Phys., 2021, 23, 8767–8777 RSC.
- D. M. Sublett, E. Sendula, H. Lamadrid, M. Steele-MacInnis, G. Spiekermann, R. C. Burruss and R. J. Bodnar, J. Raman Spectrosc., 2020, 51, 555–568 CrossRef CAS.
- D. M. Sublett Jr, E. Sendula, H. M. Lamadrid, M. Steele-MacInnis, G. Spiekermann and R. J. Bodnar, J. Raman Spectrosc., 2020, 52, 750–769 CrossRef.
- V.-H. Le, M.-C. Caumon and A. Tarantola, Comput. Geosci., 2021, 156, 104896 CrossRef CAS.
- H. Liu, Y. Zhao, Z. Zhang, N. Nijem, Y. J. Chabal, H. Zeng and J. Li, Adv. Funct. Mater., 2009, 21, 4754–4762 CrossRef.
- N. Nijem, P. Thissen, Y. Yao, R. C. Longo, K. Roodenko, H. Wu, Y. Zhao, K. Cho, J. Li, D. C. Langreth and Y. J. Chabal, J. Am. Chem. Soc., 2011, 133, 12849–12857 CrossRef CAS PubMed.
- N. Nijem, P. Canepa, L. Kong, H. Wu, J. Li, T. Thonhauser and Y. J. Chabal, J. Phys.: Condens. Matter, 2012, 24, 424203 CrossRef PubMed.
- P. Kanoo, S. K. Reddy, G. Kumari, R. Haldar, C. Narayana, S. Balasubramanian and T. K. Maji, Chem. Commun., 2012, 48, 8487–8489 RSC.
- S. I. Garcés, J. Villarroel-Rocha, K. Sapag, S. A. Korili and A. Gil, Ind. Eng. Chem. Res., 2013, 52(20), 6785–6793 CrossRef.
- G. Kumari, K. Jayaramulu, T. K. Maji and C. Narayana, J. Phys. Chem. A, 2013, 117, 11006–11012 CrossRef CAS PubMed.
- A. G. Kontos, V. Likodimos, C. M. Veziri, E. Kouvelos, N. Moustakas, G. N. Karanikolos, G. E. Romanos and P. Falaras, ChemSusChem, 2014, 7, 1696–1702 CrossRef CAS PubMed.
- J. J. Gutierrez-Sevillano, S. Calero, C. O. Ania, J. B. Parra, F. Kapteijn, J. Gascon and S. Hamad, J. Phys. Chem. C, 2013, 117, 466–471 CrossRef.
- J. Kortus, G. Irmer, J. Monecke and M. R. Pederson, Modell. Simul. Mater. Sci. Eng., 2000, 8, 403–411 CrossRef CAS.
- B. Kolesov and C. A. Geiger, Am. Mineral., 2003, 88, 1364–1368 CrossRef CAS.
- J.-L. Guth, H. Kessler and R. Wey, in Studies in Surface Science and Catalysis, ed. Y. Murakami, A. Iijima and J. W. Ward, Kodansha-Elsevier, Tokyo, 1986, vol. 28, p. 121 Search PubMed.
- R. Span and W. Wagner, J. Phys. Chem. Ref. Data, 1996, 25, 1509–1596 CrossRef CAS.
- Y. Yu, G. Xiong, C. Li and F.-S. Xiao, Microporous Mesoporous Mater., 2001, 46, 23–34 CrossRef CAS.
- A. Martinelli, S. Creci, S. Vavra, P.-A. Carlsson and M. Skoglundh, Phys. Chem. Chem. Phys., 2020, 22, 1640–1654 RSC.
- F. Bogani and P. R. Salvi, J. Chem. Phys., 1984, 81, 4991–5001 CrossRef CAS.
- V. G. Arakcheev and V. B. Morozov, J. Raman Spectrosc., 2014, 45, 501–506 CrossRef CAS.
- V. G. Arakcheev and V. B. Morozov, J. Raman Spectrosc., 2014, 45, 501–506 CrossRef CAS.
- S. Fujiyama, N. Kamiya, K. Nishi and Y. Yokomori, Z. Kristallogr., 2013, 228, 180–186 CAS.
- J. Lill, C. Dejoie, C. Giacobbe and A. N. Fitch, J. Phys. Chem. C, 2022, 126, 2214–2225 CrossRef CAS.
- T. Marqueño, D. Santamaria-Perez, J. Ruiz-Fuertes, R. Chuliá-Jordán, J. L. Jordá, F. Rey and C. McGuire, et al. , Inorg. Chem., 2018, 57, 6447–6455 CrossRef PubMed.
- J. Yang, J. Li, W. Wang, L. Li and J. Li, Ind. Eng. Chem. Res., 2013, 52, 17856–17864 CrossRef CAS.
- S. Fujiyama, N. Kamiya, K. Nishi and Y. Yokomori, Langmuir, 2014, 30, 3749–3753 CrossRef CAS PubMed.
| This journal is © the Owner Societies 2024 |

