A QCM study of strong carbohydrate–carbohydrate interactions of glycopolymers carrying mannosides on substrates†
Takahiro
Oh
,
Takeshi
Uemura
,
Masanori
Nagao
 ,
Yu
Hoshino
 and
Yoshiko
Miura
 *
*
Department of Chemical Engineering, Kyushu University, 744 Motooka, Nishiku, Fukuoka 819-0395, Japan. E-mail: miuray@chem-eng.kyushu-u.ac.jp
First published on 8th December 2021
Abstract
Carbohydrates on cell surfaces are known to interact not only with lectins but also with other carbohydrates; the latter process is known as a carbohydrate–carbohydrate interaction. Such interactions are observed in complex oligosaccharides. It would be surprising if these interactions were observed in simple monosaccharides of mannose. In this study, the interaction between glycopolymers carrying monosaccharides of mannose was quantitatively investigated by quartz crystal microbalance measurements. We measured the interactions with glycopolymers carrying mannose, galactose and glucose. Surprisingly, the interaction between the glycopolymers and mannose was much stronger than that between other saccharides.
1. Introduction
Carbohydrates play important roles in various biological systems such as cell–cell adhesion, cell recognition, immune system, infection disease and cell differentiation.1–4 In glycoscience, most of the research focused on their specific interaction with carbohydrate–carbohydrate recognition proteins (lectins).5,6 Hakomori et al. found that carbohydarate–carbohydrate interactions (CCIs) are also present in living systems and play important roles in living systems.2 However, the role of CCIs in biological systems is not completely clear, because CCIs have been studied less than carbohydrate–lectin interactions. CCIs have been reported to occur with a specific combination of oligosaccharides, such as Lewis X, Gg3, and GM3. It is believed that CCIs are related to specific biological events such as cell recognition of cancer cells, and that CCIs are specific to the cells.2,7,8 If CCIs, which are expressed in complex oligosaccharides, are also present in monosaccharides, the implications for biology would be immense. But at the same time, CCIs have not been investigated for a wide variety of saccharides.Mannose is frequently found in saccharides in living systems. For example, high mannose-type N-glycans function as a quality control system and enable intracellular transportation of glycoproteins.9 Mannose residues are abundant on the surfaces of pathogenic viruses and fungi and are intimately involved in pathogenicity and the host immune response in diseases.10–15 Moreover, various immune cells, such as macrophages and dendric cells, possess mannose-binding lectins, which play important roles related to immune response. Mannose is of high importance, and in particular, much attention has been given to the specific interaction of mannose with C-type lectins.16,17 It would be surprising if CCIs existed between simple mannose moieties.
The interactions of carbohydrates are usually weak, and the CCIs are even weaker than the carbohydrate–lectin interactions, which means they are difficult to measure.7,18 Glycoclusters, like glycolipids and glycoproteins, play important roles in exhibiting CCIs in the natural system. The artificial glycoclusters of glycopolymers are reported to amplify the carbohydrate interaction. It has been reported that glycopolymers can show CCIs based on the multivalent effect.19–21 Recently, we discovered a self-assembling mannose cluster comprising glyco-polymers in an aqueous solution, which suggested CCIs in glyco-polymers.22 In this report, we prepared a biomimetic interface with a glycopolymer-immobilized substrate to measure CCIs between simple mannose clusters (a mannose carrying glycopolymers); we measured this quantitatively and compared it with other simple sugar clusters.
2. Experimental section
2.1. Characterization
1H NMR spectra were recorded with a JNM-ECZ400 spectrometer (JEOL, Tokyo, Japan) using CDCl3, d6-DMSO, or D2O as a solvent. Gel permeation chromatography (GPC) with an organic solvent was performed using an HLC-8320 GPC Eco-SEC system equipped with a TSKgel Super AW guard column and TSKgel Super AW (4000, 3000, and 2500) columns (Tosoh, Tokyo, Japan). GPC with water solvent was performed using a JASCO DG-980-50 degasser equipped with a JASCO PU-980 pump (JASCO Co., Tokyo, Japan), a Shodex OHpak SB-G guard column, a Shodex OHpak LB-806 HQ column (Showa Denko, Tokyo, Japan), and a JASCO RI-2031 Plus RI detector. GPC analyses were performed by injecting 20 μL of a polymer solution (1 g L−1) in DMF buffer containing LiBr (10 mM) or NaNO3 aqueous solution (100 mM). The buffer solution was also used as the eluent at a flow rate of 0.5 mL min−1. GPC was calibrated using a poly(methyl methacrylate) standard (Shodex) for organic solvent GPC and pullulan standard (Shodex) for aqueous GPC. UV-spectra were recorded using an Agilent 8453 spectrometer (Agilent Technologies Inc., Santa Clara, CA, USA). Dynamic light scattering (DLS) was performed with a Zetasizer Nano-ZS (Malvern, UK). DLS analyses were performed by using a 1 mL disposable cell of a polymer solution (1 g L−1) in HEPES buffer solution with Ca2+ (pH 7.4). A 27 MHz quartz crystal microbalance (QCM) system (Affnix Q8, Ulvac Inc., Japan) was used to monitor the interaction.2.2. General procedure for polymer preparation
The glycopolymers were prepared by polymerization with a reversible addition fragmentation chain transfer (RAFT) reagent (Scheme 1).22 The polymers were prepared via the polymerization of 3-(trimethylsilyl)prop-2-yn-1-yl methacrylate (TMS-PrMA) with the RAFT reagent of CPADB and the polyethyelene glycol (PEG) terminated chain transfer reagent. The saccharides of mannose (Man), galactose (Gal) and glucose (Glc) were added to the obtained polymer by the Huisgen reaction. The polymers prepared were homo-glycopolymers and polyethylene glycol (PEG) terminated glycopolymers. The polymer terminals were converted into thiol to immobilize the gold substrate. The details of the syntheses are described in the ESI.†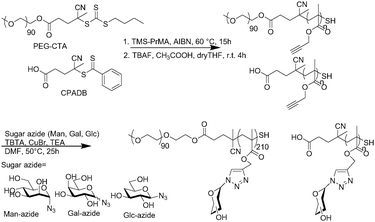 | ||
| Scheme 1 Preparation of glycopolymers in this study via RAFT polymerization and the Huisgen reaction. | ||
2.3. Glycopolymer immobilization on the QCM substrate
A 27 MHz QCM system was used to monitor the interaction. The QCM cell was cleaned with piranha solution (4 μL), and the solution was left for 10 mins and washed with Milli-Q (three cycles). In the last cycle, the gold surface was replaced with Milli-Q 10 times. The QCM cell was placed in the QCM apparatus and monitored with 100 μL of Milli-Q until the frequency was constant. Once the frequency was constant, 100 μL of each glycopolymer was added to bring the concentration in the cell to 10 g L−1, and the cell was kept at 15 °C for 2 hours. To remove unfixed glycopolymers from the cell, the cell was washed with Milli-Q three times, and then washed again with HEPES buffer and monitored until the frequency became constant.2.4. Interaction measurement by QCM
A 27 MHz QCM system was used to monitor the interaction. The glycopolymers were immobilized on the QCM substrate as described in the previous section. After the frequency became constant, each PEG-terminated glycopolymer or PEG solution was added successively at 15 °C, and the cell was measured until the frequency became constant.2.5. Turbidity measurement
Each glycopolymer was dissolved in HEPES buffer (HEPES: 10 mM, NaCl: 137 mM, KCl: 2.7 mM, CaCl2![[thin space (1/6-em)]](https://www.rsc.org/images/entities/char_2009.gif) :
:![[thin space (1/6-em)]](https://www.rsc.org/images/entities/char_2009.gif) 1.8 mM) at 1 g L−1. After incubation at 15 °C for 48 h, the absorbance of 600 nm was recorded.
1.8 mM) at 1 g L−1. After incubation at 15 °C for 48 h, the absorbance of 600 nm was recorded.
2.6. X-ray photoelectron spectroscopy (XPS) measurement
XPS measurement was performed using a Shimadzu/Kratos AXIS-ultra (Kratos Analytical Ltd, Manchester, UK, Shimadzu Co., Kyoto, Japan) for the analysis of the immobilized glycopolymer. All the XPS spectra energies were referenced to the C (1s) photoemission peak at 285.0 eV. The substrates for XPS measurements were prepared by incubating the aqueous solution (10 g L−1) of glycopolymers for 2 h on the glass substrate coated Au (50 nm).3. Results and discussion
Fig. 1(a) illustrates the method of measuring the interaction between glycopolymers by quartz crystal microbalance (QCM) measurements, the chemical structures and the abbreviations of the polymers used in this investigation (Fig. 1(b)). pGal200, pMan200, and pGlc200 stand for glycopolymer carrying galactose, mannose, and glucose with the degree of polymerization (D. P.) of 200, respectively. P90Gal200, P90Man200, and P90Glc200 stand for PEG-terminated glycopolymers. Glycopolymers were synthesized via reversible addition fragmentation chain transfer (RAFT) polymerization (TMS200) and the Huisgen reaction. PEG-terminated block glycopolymers were prepared by macro-RAFT with PEG (Fig. S4–4 and S4–6, ESI†). After the deprotection of the side chain of the TMS group (Fig. S4–5 and S4–7, ESI†), sugar azides (Fig. S4–1 and S4–3, ESI†) were incorporated into the polymer main chain by the Huisgen reaction (pMan200, pGal200, pGlc200, P90Man200, P90Gal200, and P90Glc200).22 All the alkyne groups on the side chain were converted into sugar triazoles, which were confirmed by 1HNMR (Fig. S4–8 and S4–9, ESI†). The polymer terminals were converted into thiol by the deprotection of the TMS group, which was confirmed by the decrease of UV absorbance at 305 nm (Fig. S6–1, ESI†). Molecular weights were estimated by GPC measurements (S5-1 and S5-2, ESI†).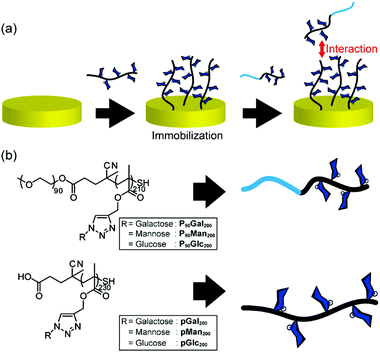 | ||
| Fig. 1 (a) Schematic illustration of QCM measurement; (b) structures and abbreviations of glycopolymers and DHBG used in this study. | ||
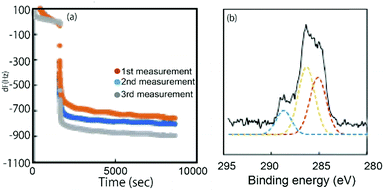
A glycopolymer thin layer with pGal200, pMan200, and pGlc200 was formed by the incubation of the gold electrode of QCM, and the substrate was rinsed with MilliQ water to remove the non-specific adsorbed polymer. The formation of the glycopolymer layer was monitored by QCM and X-ray photoelectron spectroscopy (XPS) (Fig. 2 and Fig. S7-1, S8-1, S8-2, S8-3, ESI†).23 The time course of the frequency change in QCM indicated the adsorption of glycopolymers on Au-S, where the adsorption behaviour was different depending on the type of the polymer (Fig. 2 and Fig. S7–1, ESI†). The XPS spectra were recorded after the formation of the polymer layer and the rinsing with water. In the XPS spectra, the decrease of Au (4f) and the strength of C (1s) peaks showed the formation of the glycopolymer layer (Fig. 2 and Fig. S8–1, 8–2, ESI†). Although there were differences in the adsorption behaviour of each polymer by QCM, the XPS peaks were almost the same for all three polymers, suggesting that the thickness of the polymers on the gold substrate is almost the same regardless of the polymer. The weakly adsorbed glycopolymers on the substrate were removed by vigorously rinsing with water. The thiol-terminated polymers were considered to form pancake-like polymer monolayers due to the interaction between the gold substrate and the polymer. The thickness of the polymer layer was estimated to be around 2–5 nm based on previous reports.23,24
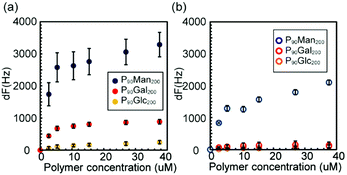
The interaction between the glycopolymers was measured by the frequency change of QCM (Fig. 3(a)). In the case of pMan200 immobilized on the gold surface, the glycopolymer of pMan200 stacked up on the surface (Fig. S7–2, ESI†). Therefore, it was difficult to observe the amount of saturated adsorption of the glycopolymer pMan200 on the pMan200 thin layer. The PEG-terminated glycopolymers were prepared to prevent the aggregation of the glycopolymers.25 The maximum frequency change of P90Man200 was more than ten times that of P90Glc200 and about four times that of P90Gal200 (Fig. 3(a) and Fig. S7–3, ESI†). The amount of glycopolymer bound followed the order: pMan200–P90Man200 ≫ pGal200–P90Gal200 > pGlc200–P90Glc200, which suggests a strong interaction between mannose clusters. Langmuir fitting was performed with the assumption that the interaction between the glycopolymer moieties was a one-to-one binding, though the interaction could occur cooperatively.26 The apparent binding constant of pMan200–P90Man200 was 4.7 × 10⁵ M−1, and that of pGal200–P90Gal200 was similar (Table 1 and Fig. S7–7, ESI†). The interactions of pMan200 with different glycopolymers (P90Gal200, and P90Glc200) were much weaker than those between pMan200 and P90Man200, though a certain level of interaction was observed between pMan200 and P90Gal200 (Fig. S7-6, ESI†). In addition, the interaction of pMan200 with PEG (PEG 4000) was negligible (Fig. S7–5, ESI†). These results indicate that the interaction of glycopolymers with mannose is specific to mannose clusters.
Fig. 3(b) shows the frequency change at each polymer concentration in the absence of calcium ions. The amount of glycopolymer adsorbed on the substrate is reduced in the absence of calcium ions. The amount of glycopolymer bound followed the order pMan200–P90Man200 ≫ pGal200–P90Gal200 and pGlc200–P90Glc200, though the amount is reduced from that in the presence of calcium. The interaction between the glycopolymer and mannose (pMan200–P90Man200) was obvious, and other polymer interactions were small and negligible. The apparent binding constant is 2.0 × 10⁵ M−1. The results indicate that the interaction between mannose clusters is significantly stronger than that between glucose and galactose, suggesting that the interaction between mannose clusters was contributed significantly by hydrogen bonding.
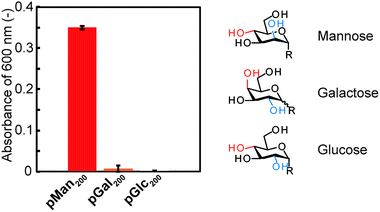
Turbidity measurements also supported that the interaction between each glycopolymer is dependent on the type of monosaccharide (Fig. 4).25 The turbidity was recorded using glycopolymers (pMan200, pGal200, and pGlc200). While pMan200 showed significant turbidity, pGal200 and pGlc200 did not. The increase in turbidity was caused by the interaction between the glycopolymers in aqueous solution and agreed with the QCM results, which indicated that a difference in the stereochemical structure of the saccharide affected the interaction.
These results indicate that the interaction between glycopolymers depends on the saccharide structure, which has a similar self-assembly capability of PEG-terminated glycopolymers. Only P90Man200 showed a significant scattering, with its hydrodynamic diameter and polydispersity index (PDI) of 50 ± 3 nm and 0.17, respectively. In addition, the TEM observation of P90Man200 also confirmed that it had a spherical structure with a 30 ± 5 nm diameter (inset of Fig. 5(a)). These results indicated that among these three PEG-terminated glycopolymers, P90Man200 can self-assemble in aqueous solution. Although all the monosaccharides (mannose, galactose, and glucose) have the same chemical formula, their self-assembly capability differs depending on their structure. In addition, the DLS measurements in the absence of calcium ions did not show any significant scattering in the case of P90Man200, which indicates that calcium ions are involved in the interactions between the glycopolymers and agrees with the results obtained by QCM measurement (Fig. 5(b)).
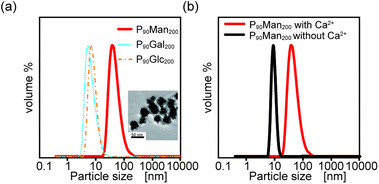 | ||
| Fig. 5 (a) DLS measurement of P90Man200, P90Gal200 and P90Glc200 and the TEM image of P90Man200 (inset). (b) DLS measurement of P90Man200 with (red) and without (black) Ca2+. | ||
Interestingly, strong CCIs were observed with mannose clusters but not with galactose and glucose clusters. There is a possibility that the hydrophobicity of the polymer backbone and the triazole contribute to the interaction. However, in the case of polymers with glucose and galactose as the side chain, the interaction between the glycopolymers was significantly decreased, which shows that the interaction is caused by the mannose moiety. In our previous studies, the self-assembly of glycopolymers with mannose was mediated by hydrogen bonds and calcium coordination bonds, and not by hydrophobic interactions.22 At the same time, it is clear that the dense α-mannose along the polymer backbone induced intermolecular interactions.
Considering the previous results, the apparent binding constants (Ka) between the mannose clusters in this study are weaker than those between carbohydrate and lectin, but are comparable in strength.26–29 To date, CCIs have been observed only qualitatively in most studies, and there are few quantitative results. The reported CCIs are still limited to complex oligosaccharides. Abeyratne-Perera et al. also reported the formation of strong hydrogen bonds between mannobiose clusters using AFM. They reported a quantitative mannobiose cluster force which is comparable to the force of the CCI between specific combinations of oligosaccharides such as Lex, which is different quantitative data to our binding constants.30 The galactose interaction was comparable to the mannose interaction in the presence of calcium, which was similar to the CCI of lactose. The mannose interaction was remarkably strong even in the absence of calcium ions, and the contribution of hydrogen bonding was considered to be significant.
4. Conclusion
We evaluated the stereochemical dependence on the interaction between each glycopolymer moiety by QCM. The interaction between glycopolymers depended on the stereochemistry of the monosaccharide. The binding constants between glycopolymers carrying mannose were comparable to the carbohydrate–lectin recognition. The interaction was strongly affected by calcium ions. Comparing the self-assembly capability of the three kinds of PEG-terminated glycopolymers, only the mannose-carrying polymer could self-assemble in an aqueous solution. Mannose is abundant on the surface of viruses and pathogens, and the human body has many mannose receptors. In addition, the role of mannose has become very important because high mannose type N-glycans play a major role in protein quality control and transport. This mannose–mannose interaction could be an important interaction in biological systems. Mannose–mannose interactions have not been found before, and the bioinspired polymer made a significant contribution to the measurement.Conflicts of interest
The authors declare no conflict of interest.Acknowledgements
This work was supported by the JSPS KAKENHI (Grant Number: JP20H05230, JP20H04825, and JP19H02766).Notes and references
- C. Slawson and G. W. Hart, Nat. Rev. Cancer, 2011, 11, 678–684 CrossRef CAS PubMed.
- S. I. Hakomori, Pure Appl. Chem., 1991, 63, 473–482 CAS.
- D. H. Dube and C. R. Bertozzi, Nat. Rev. Drug Discovery, 2005, 4, 477–488 CrossRef CAS PubMed.
- N. Sharon and H. Lis, Glycobiology, 2004, 14, 53–62 CrossRef PubMed.
- F. A. Quiocho, Pure Appl. Chem., 1989, 61, 1293–1306 CAS.
- S. Elgavish and B. Shaanan, Trends Biochem. Sci., 1997, 22, 462–467 CrossRef CAS PubMed.
- J. Rojo, J. C. Morales and S. Penadés, Host-guest Chem., 2002, 218, 45–92 CAS.
- I. Bucior, S. Scheuring and A. Engel, J. Cell Biol., 2004, 165, 529–537 CrossRef CAS PubMed.
- T. Satoh, T. Yamaguchi and K. Kato, Molecules, 2015, 20, 2475–2491 CrossRef PubMed.
- T. L. A. Doering, J. Bacteriol., 1999, 181, 5482–5488 CrossRef CAS PubMed.
- M. Ibuki, J. Kovacs-Nolan, K. Fukui, H. Kanatani, Y. Mine and Y. Vet, Immunol. Immunopathol., 2011, 139, 289–295 CrossRef CAS PubMed.
- X. Ji, H. Gewurz and G. T. Spear, Mol. Immunol., 2005, 42, 145–152 CrossRef CAS PubMed.
- O. Krokhin, Y. Li, A. Andonov, H. Feldmann, R. Flick, S. Jones, U. Stroeher, N. Bastien, K. V. N. Dasuri, K. Cheng, J. N. Simonsen, H. Perreault, J. Wilkins, W. Ens, F. Plummer and K. G. Mol, Cell. Proteomics, 2003, 2, 346–356 CrossRef CAS PubMed.
- J. L. Miller, B. J. M. DeWet, L. Martinez-Pomares, C. M. Radcliffe, R. A. Dwek, P. M. Rudd and S. Gordon, PLoS Pathog., 2008, 4, 1–11 Search PubMed.
- I. C. Michelow, C. Lear, C. Scully, L. I. Prugar, C. B. Longley, L. M. Yantosca, X. Ji, M. Karpel, M. Brudner, K. Takahashi, G. T. Spear, R. A. B. Ezekowitz, E. V. Schmidt and G. G. Olinger, J. Infect. Dis., 2011, 203, 175–179 CrossRef CAS PubMed.
- C. Wong, L. Jayaram and L. Chang, Lancet Respir. Med., 2013, 1, 179–180 CrossRef PubMed.
- J. A. Willment and G. D. Brown, Trends Microbiol., 2008, 16, 27–32 CrossRef CAS PubMed.
- A. Varki, Proc. Natl. Acad. Sci. U. S. A., 1994, 91, 7390–7397 CrossRef CAS PubMed.
- K. Matsuura, H. Kitakouji, N. Sawada, H. Ishida, M. Kiso, K. Kitajima and K. Kobayashi, J. Am. Chem. Soc., 2000, 122, 7406–7407 CrossRef CAS.
- N. Jayaraman, K. Maiti and K. Naresh, Chem. Soc. Rev., 2013, 42, 4640–4656 RSC.
- H. Witt, F. Savić, M. Oelkers, S. I. Awan, D. B. Werz, B. Geil and A. Janshoff, Biophys. J., 2016, 110, 1582–1592 CrossRef CAS PubMed.
- T. Oh, M. Nagao, Y. Hoshino and Y. Miura, Langmuir, 2018, 34, 8591–8598 CrossRef CAS PubMed.
- Y. Terada, H. Seto, Y. Hoshino, T. Murakami, S. Shinohara, K. Tamada and Y. Miura, Polym. J., 2017, 49, 255–262 CrossRef CAS.
- M. Toyoshima, T. Oura, T. Fukuda, E. Matsumoto and Y. Miura, Polym. J., 2010, 42, 172–178 CrossRef CAS.
- T. Oh, Y. Hoshino and Y. Miura, J. Mater. Chem. B, 2020, 8, 10101–10107 RSC.
- K. Jono, M. Nagao, T. Oh, S. Sonoda, Y. Hoshino and Y. Miura, Chem. Commun., 2017, 54, 82–85 RSC.
- S. R. S. Ting, G. Chen and M. H. Stenzel, Polym. Chem., 2010, 1, 1392–1412 RSC.
- C. R. Becer, Macromol. Rapid Commun., 2012, 33, 742–752 CrossRef CAS PubMed.
- M. Ambrosi, N. R. Cameron, B. G. Davis and S. Stolnik, Org. Biomol. Chem., 2005, 3, 1476–1480 RSC.
- H. K. Abeyratne-Perera and P. L. Chandran, Langmuir, 2017, 33, 9178–9189 CrossRef CAS PubMed.
Footnote |
| † Electronic supplementary information (ESI) available. See DOI: 10.1039/d1tb02344f |
| This journal is © The Royal Society of Chemistry 2022 |

